
 Login Sign Up


| |||||
 |  | ||||

| 12Stocks.com Market Intelligence |
Best Financial Stocks
| In a hurry? Financial Stocks Lists: Performance Trends Table, Stock Charts
Sort Financial stocks: Daily, Weekly, Year-to-Date, Market Cap & Trends. Filter Financial stocks list by size:All Financial Large Mid-Range Small & MicroCap |
| 12Stocks.com Financial Stocks Performances & Trends Daily | |||||||||
|
|  The overall Smart Investing & Trading Score is 90 (0-bearish to 100-bullish) which puts Financial sector in short term bullish trend. The Smart Investing & Trading Score from previous trading session is 60 and an improvement of trend continues.
| ||||||||
Here are the Smart Investing & Trading Scores of the most requested Financial stocks at 12Stocks.com (click stock name for detailed review):
|


| 12Stocks.com: Investing in Financial sector with Stocks | |
|
The following table helps investors and traders sort through current performance and trends (as measured by Smart Investing & Trading Score) of various
stocks in the Financial sector. Quick View: Move mouse or cursor over stock symbol (ticker) to view short-term Technical chart and over stock name to view long term chart. Click on  to add stock symbol to your watchlist and to add stock symbol to your watchlist and  to view watchlist. Click on any ticker or stock name for detailed market intelligence report for that stock. to view watchlist. Click on any ticker or stock name for detailed market intelligence report for that stock. |
12Stocks.com Performance of Stocks in Financial Sector
| Ticker | Stock Name | Watchlist | Category | Recent Price | Smart Investing & Trading Score | Change % | YTD Change% |
| AC | Associated Capital |   | Asset Mgmt | 30.92 | 0 | -7.31% | -11.37% |
| CTO | CTO Realty | | REIT - | 16.46 | 20 | 0.55% | -11.49% |
| BDN | Brandywine Realty | | REIT - Office | 4.51 | 60 | 0.89% | -11.69% |
| TBNK | Territorial Bancorp | | Regional Banks | 8.33 | 10 | -0.60% | -11.94% |
| XFLT | XAI Octagon | | Closed-End Fund - Debt | 5.40 | 10 | -5.26% | -12.16% |
| IRT | Independence Realty | | REIT | 17.06 | 20 | 0.77% | -12.17% |
| AMAL | Amalgamated | | Banks - Regional | 28.73 | 50 | 3.35% | -12.20% |
| APLE | Apple Hospitality | | REIT - Hotel & Motel | 12.66 | 50 | 1.69% | -12.63% |
| EQC | Equity Commonwealth | | REIT - Office | 1.58 | 20 | 0.00% | -12.71% |
| MMI | Marcus & Millichap | | Real Estate Services | 32.35 | 50 | 1.44% | -12.90% |
| APO | Apollo Global | | Asset Mgmt | 143.49 | 80 | 3.36% | -12.93% |
| EGBN | Eagle Bancorp | | Banks - Regional | 21.42 | 100 | 4.54% | -13.00% |
| AKR | Acadia Realty | | REIT - Retail | 20.37 | 100 | 0.89% | -13.02% |
| SUNS | Sunrise Realty | | REIT - Mortgage | 11.71 | 100 | 2.36% | -13.08% |
| SHO | Sunstone Hotel | | REIT - Hotel & Motel | 9.92 | 80 | 1.85% | -13.16% |
| CCAP | Crescent Capital | | Asset Mgmt | 15.69 | 50 | 1.16% | -13.30% |
| PNFP | Pinnacle | | Banks - Regional | 97.68 | 70 | 0.77% | -13.35% |
| BHFAM | Brighthouse | | Insurance - Life | 12.02 | 38 | -0.30% | -13.47% |
| ACRE | Ares Commercial | | REIT - Mortgage | 4.83 | 50 | 0.84% | -13.52% |
| SASR | Sandy Spring | | Regional Banks | 27.95 | 10 | 1.27% | -13.87% |
| EIG | Employers | | Insurance - Specialty | 42.79 | 60 | 1.30% | -14.12% |
| ARR | ARMOUR Residential | | REIT - Mortgage | 14.75 | 0 | -1.27% | -14.17% |
| TW | Tradeweb Markets | | Capital Markets | 112.52 | 0 | -4.00% | -14.18% |
| SIGI | Selective Insurance | | Insurance - Property & Casualty | 78.30 | 80 | 1.14% | -14.26% |
| SFBC | Sound | | Banks - Regional | 46.46 | 40 | 2.47% | -14.51% |
| For chart view version of above stock list: Chart View ➞ 0 - 25 , 25 - 50 , 50 - 75 , 75 - 100 , 100 - 125 , 125 - 150 , 150 - 175 , 175 - 200 , 200 - 225 , 225 - 250 , 250 - 275 , 275 - 300 , 300 - 325 , 325 - 350 , 350 - 375 , 375 - 400 , 400 - 425 , 425 - 450 , 450 - 475 , 475 - 500 , 500 - 525 , 525 - 550 , 550 - 575 , 575 - 600 , 600 - 625 , 625 - 650 , 650 - 675 , 675 - 700 , 700 - 725 , 725 - 750 , 750 - 775 , 775 - 800 , 800 - 825 , 825 - 850 , 850 - 875 , 875 - 900 , 900 - 925 , 925 - 950 , 950 - 975 , 975 - 1000 , 1000 - 1025 , 1025 - 1050 , 1050 - 1075 , 1075 - 1100 , 1100 - 1125 , 1125 - 1150 , 1150 - 1175 , 1175 - 1200 , 1200 - 1225 , 1225 - 1250 , 1250 - 1275 , 1275 - 1300 , 1300 - 1325 , 1325 - 1350 , 1350 - 1375 , 1375 - 1400 , 1400 - 1425 , 1425 - 1450 , 1450 - 1475 , 1475 - 1500 , 1500 - 1525 , 1525 - 1550 | ||
 | Click To Change The Sort Order: By Market Cap or Company Size Performance: Year-to-date, Week and Day |  |
|
Get the most comprehensive stock market coverage daily at 12Stocks.com ➞ Best Stocks Today ➞ Best Stocks Weekly ➞ Best Stocks Year-to-Date ➞ Best Stocks Trends ➞  Best Stocks Today 12Stocks.com Best Nasdaq Stocks ➞ Best S&P 500 Stocks ➞ Best Tech Stocks ➞ Best Biotech Stocks ➞ |
| Detailed Overview of Financial Stocks |
| Financial Technical Overview, Leaders & Laggards, Top Financial ETF Funds & Detailed Financial Stocks List, Charts, Trends & More |
| Financial Sector: Technical Analysis, Trends & YTD Performance | |
| Financial sector is composed of stocks
from banks, brokers, insurance, REITs
and services subsectors. Financial sector, as represented by XLF, an exchange-traded fund [ETF] that holds basket of Financial stocks (e.g, Bank of America, Goldman Sachs) is up by 13.0735% and is currently underperforming the overall market by -0.7866% year-to-date. Below is a quick view of Technical charts and trends: |
|
 XLF Weekly Chart |
|
| Long Term Trend: Good | |
| Medium Term Trend: Good | |
 XLF Daily Chart |
|
| Short Term Trend: Very Good | |
| Overall Trend Score: 90 | |
| YTD Performance: 13.0735% | |
| **Trend Scores & Views Are Only For Educational Purposes And Not For Investing | |
| 12Stocks.com: Top Performing Financial Sector Stocks | |||||||||||||||||||||||||||||||||||||||||||||||
 The top performing Financial sector stocks year to date are
Now, more recently, over last week, the top performing Financial sector stocks on the move are


|
|||||||||||||||||||||||||||||||||||||||||||||||
| 12Stocks.com: Investing in Financial Sector using Exchange Traded Funds | |
|
The following table shows list of key exchange traded funds (ETF) that
help investors track Financial Index. For detailed view, check out our ETF Funds section of our website. Quick View: Move mouse or cursor over ETF symbol (ticker) to view short-term Technical chart and over ETF name to view long term chart. Click on ticker or stock name for detailed view. Click on to add stock symbol to your watchlist and to view watchlist. |
12Stocks.com List of ETFs that track Financial Index
| Ticker | ETF Name | Watchlist | Recent Price | Smart Investing & Trading Score | Change % | Week % | Year-to-date % |
| CHIX | China Financials | | 10.57 | 20 | 0 | 0 | 0% |
| 12Stocks.com: Charts, Trends, Fundamental Data and Performances of Financial Stocks | |
|
We now take in-depth look at all Financial stocks including charts, multi-period performances and overall trends (as measured by Smart Investing & Trading Score). One can sort Financial stocks (click link to choose) by Daily, Weekly and by Year-to-Date performances. Also, one can sort by size of the company or by market capitalization. |
| Select Your Default Chart Type: | |||||
| |||||
| Click on stock symbol or name for detailed view. Click on to add stock symbol to your watchlist and to view watchlist. Quick View: Move mouse or cursor over "Daily" to quickly view daily Technical stock chart and over "Weekly" to view weekly Technical stock chart. | |||||

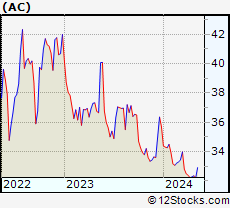 | AC Associated Capital Group Inc |
| Sector: Financials | |
| SubSector: Asset Management | |
| MarketCap: 649.89 Millions | |
| Recent Price: 30.92 Smart Investing & Trading Score: 0 | |
| Day Percent Change: -7.31415% Day Change: -0.22 | |
| Week Change: -7.00752% Year-to-date Change: -11.4% | |
| AC Links: Profile News Message Board | |
| Charts:- Daily , Weekly | |
| Add AC to Watchlist: View: Get Complete AC Trend Analysis ➞ | |
 | CTO CTO Realty Growth Inc |
| Sector: Financials | |
| SubSector: REIT - Diversified | |
| MarketCap: 573.81 Millions | |
| Recent Price: 16.46 Smart Investing & Trading Score: 20 | |
| Day Percent Change: 0.549786% Day Change: 0 | |
| Week Change: -3.29025% Year-to-date Change: -11.5% | |
| CTO Links: Profile News Message Board | |
| Charts:- Daily , Weekly | |
| Add CTO to Watchlist: View: Get Complete CTO Trend Analysis ➞ | |
 | BDN Brandywine Realty Trust |
| Sector: Financials | |
| SubSector: REIT - Office | |
| MarketCap: 761.32 Millions | |
| Recent Price: 4.51 Smart Investing & Trading Score: 60 | |
| Day Percent Change: 0.894855% Day Change: -0.04 | |
| Week Change: 2.96804% Year-to-date Change: -11.7% | |
| BDN Links: Profile News Message Board | |
| Charts:- Daily , Weekly | |
| Add BDN to Watchlist: View: Get Complete BDN Trend Analysis ➞ | |
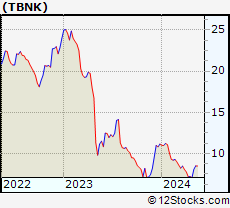 | TBNK Territorial Bancorp Inc. |
| Sector: Financials | |
| SubSector: Regional - Pacific Banks | |
| MarketCap: 220.029 Millions | |
| Recent Price: 8.33 Smart Investing & Trading Score: 10 | |
| Day Percent Change: -0.596659% Day Change: -9999 | |
| Week Change: -1.18624% Year-to-date Change: -11.9% | |
| TBNK Links: Profile News Message Board | |
| Charts:- Daily , Weekly | |
| Add TBNK to Watchlist: View: Get Complete TBNK Trend Analysis ➞ | |
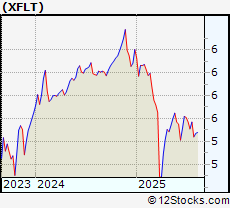 | XFLT XAI Octagon Floating Rate & Alternative Income Trust |
| Sector: Financials | |
| SubSector: Closed-End Fund - Debt | |
| MarketCap: 425.5 Millions | |
| Recent Price: 5.40 Smart Investing & Trading Score: 10 | |
| Day Percent Change: -5.26316% Day Change: -0.01 | |
| Week Change: -1.45985% Year-to-date Change: -12.2% | |
| XFLT Links: Profile News Message Board | |
| Charts:- Daily , Weekly | |
| Add XFLT to Watchlist: View: Get Complete XFLT Trend Analysis ➞ | |
 | IRT Independence Realty Trust Inc |
| Sector: Financials | |
| SubSector: REIT - Residential | |
| MarketCap: 4325.25 Millions | |
| Recent Price: 17.06 Smart Investing & Trading Score: 20 | |
| Day Percent Change: 0.767868% Day Change: -0.12 | |
| Week Change: -1.8412% Year-to-date Change: -12.2% | |
| IRT Links: Profile News Message Board | |
| Charts:- Daily , Weekly | |
| Add IRT to Watchlist: View: Get Complete IRT Trend Analysis ➞ | |
 | AMAL Amalgamated Financial Corp |
| Sector: Financials | |
| SubSector: Banks - Regional | |
| MarketCap: 869.25 Millions | |
| Recent Price: 28.73 Smart Investing & Trading Score: 50 | |
| Day Percent Change: 3.34532% Day Change: -0.1 | |
| Week Change: 0.9487% Year-to-date Change: -12.2% | |
| AMAL Links: Profile News Message Board | |
| Charts:- Daily , Weekly | |
| Add AMAL to Watchlist: View: Get Complete AMAL Trend Analysis ➞ | |
 | APLE Apple Hospitality REIT Inc |
| Sector: Financials | |
| SubSector: REIT - Hotel & Motel | |
| MarketCap: 3090.35 Millions | |
| Recent Price: 12.66 Smart Investing & Trading Score: 50 | |
| Day Percent Change: 1.68675% Day Change: -0.01 | |
| Week Change: 1.03751% Year-to-date Change: -12.6% | |
| APLE Links: Profile News Message Board | |
| Charts:- Daily , Weekly | |
| Add APLE to Watchlist: View: Get Complete APLE Trend Analysis ➞ | |
 | EQC Equity Commonwealth |
| Sector: Financials | |
| SubSector: REIT - Office | |
| MarketCap: 3659.36 Millions | |
| Recent Price: 1.58 Smart Investing & Trading Score: 20 | |
| Day Percent Change: 0% Day Change: -9999 | |
| Week Change: 0% Year-to-date Change: -12.7% | |
| EQC Links: Profile News Message Board | |
| Charts:- Daily , Weekly | |
| Add EQC to Watchlist: View: Get Complete EQC Trend Analysis ➞ | |
 | MMI Marcus & Millichap Inc |
| Sector: Financials | |
| SubSector: Real Estate Services | |
| MarketCap: 1291.58 Millions | |
| Recent Price: 32.35 Smart Investing & Trading Score: 50 | |
| Day Percent Change: 1.44246% Day Change: -0.16 | |
| Week Change: 0.497049% Year-to-date Change: -12.9% | |
| MMI Links: Profile News Message Board | |
| Charts:- Daily , Weekly | |
| Add MMI to Watchlist: View: Get Complete MMI Trend Analysis ➞ | |
 | APO Apollo Global Management Inc |
| Sector: Financials | |
| SubSector: Asset Management | |
| MarketCap: 75692.1 Millions | |
| Recent Price: 143.49 Smart Investing & Trading Score: 80 | |
| Day Percent Change: 3.36407% Day Change: 4.09 | |
| Week Change: 7.37055% Year-to-date Change: -12.9% | |
| APO Links: Profile News Message Board | |
| Charts:- Daily , Weekly | |
| Add APO to Watchlist: View: Get Complete APO Trend Analysis ➞ | |
 | EGBN Eagle Bancorp Inc (MD) |
| Sector: Financials | |
| SubSector: Banks - Regional | |
| MarketCap: 601.91 Millions | |
| Recent Price: 21.42 Smart Investing & Trading Score: 100 | |
| Day Percent Change: 4.5388% Day Change: -0.45 | |
| Week Change: 9.17431% Year-to-date Change: -13.0% | |
| EGBN Links: Profile News Message Board | |
| Charts:- Daily , Weekly | |
| Add EGBN to Watchlist: View: Get Complete EGBN Trend Analysis ➞ | |
 | AKR Acadia Realty Trust |
| Sector: Financials | |
| SubSector: REIT - Retail | |
| MarketCap: 2675.99 Millions | |
| Recent Price: 20.37 Smart Investing & Trading Score: 100 | |
| Day Percent Change: 0.89153% Day Change: 0.14 | |
| Week Change: 5.05415% Year-to-date Change: -13.0% | |
| AKR Links: Profile News Message Board | |
| Charts:- Daily , Weekly | |
| Add AKR to Watchlist: View: Get Complete AKR Trend Analysis ➞ | |
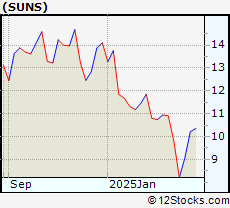 | SUNS Sunrise Realty Trust Inc |
| Sector: Financials | |
| SubSector: REIT - Mortgage | |
| MarketCap: 145.48 Millions | |
| Recent Price: 11.71 Smart Investing & Trading Score: 100 | |
| Day Percent Change: 2.36014% Day Change: -0.24 | |
| Week Change: 6.165% Year-to-date Change: -13.1% | |
| SUNS Links: Profile News Message Board | |
| Charts:- Daily , Weekly | |
| Add SUNS to Watchlist: View: Get Complete SUNS Trend Analysis ➞ | |
 | SHO Sunstone Hotel Investors Inc |
| Sector: Financials | |
| SubSector: REIT - Hotel & Motel | |
| MarketCap: 1816.11 Millions | |
| Recent Price: 9.92 Smart Investing & Trading Score: 80 | |
| Day Percent Change: 1.84805% Day Change: 0.06 | |
| Week Change: 6.55209% Year-to-date Change: -13.2% | |
| SHO Links: Profile News Message Board | |
| Charts:- Daily , Weekly | |
| Add SHO to Watchlist: View: Get Complete SHO Trend Analysis ➞ | |
 | CCAP Crescent Capital BDC Inc |
| Sector: Financials | |
| SubSector: Asset Management | |
| MarketCap: 590.76 Millions | |
| Recent Price: 15.69 Smart Investing & Trading Score: 50 | |
| Day Percent Change: 1.16054% Day Change: -0.03 | |
| Week Change: 0.641437% Year-to-date Change: -13.3% | |
| CCAP Links: Profile News Message Board | |
| Charts:- Daily , Weekly | |
| Add CCAP to Watchlist: View: Get Complete CCAP Trend Analysis ➞ | |
 | PNFP Pinnacle Financial Partners Inc |
| Sector: Financials | |
| SubSector: Banks - Regional | |
| MarketCap: 7552.4 Millions | |
| Recent Price: 97.68 Smart Investing & Trading Score: 70 | |
| Day Percent Change: 0.773754% Day Change: 0.75 | |
| Week Change: -0.0102365% Year-to-date Change: -13.4% | |
| PNFP Links: Profile News Message Board | |
| Charts:- Daily , Weekly | |
| Add PNFP to Watchlist: View: Get Complete PNFP Trend Analysis ➞ | |
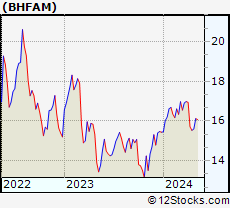 | BHFAM Brighthouse Financial, Inc. |
| Sector: Financials | |
| SubSector: Insurance - Life | |
| MarketCap: 3170 Millions | |
| Recent Price: 12.02 Smart Investing & Trading Score: 38 | |
| Day Percent Change: -0.3% Day Change: -0.04 | |
| Week Change: 4.03% Year-to-date Change: -13.5% | |
| BHFAM Links: Profile News Message Board | |
| Charts:- Daily , Weekly | |
| Add BHFAM to Watchlist: View: Get Complete BHFAM Trend Analysis ➞ | |
 | ACRE Ares Commercial Real Estate Corp |
| Sector: Financials | |
| SubSector: REIT - Mortgage | |
| MarketCap: 282.18 Millions | |
| Recent Price: 4.83 Smart Investing & Trading Score: 50 | |
| Day Percent Change: 0.835073% Day Change: -0.15 | |
| Week Change: -0.412371% Year-to-date Change: -13.5% | |
| ACRE Links: Profile News Message Board | |
| Charts:- Daily , Weekly | |
| Add ACRE to Watchlist: View: Get Complete ACRE Trend Analysis ➞ | |
 | SASR Sandy Spring Bancorp, Inc. |
| Sector: Financials | |
| SubSector: Regional - Mid-Atlantic Banks | |
| MarketCap: 764.659 Millions | |
| Recent Price: 27.95 Smart Investing & Trading Score: 10 | |
| Day Percent Change: 1.26812% Day Change: -9999 | |
| Week Change: -3.01874% Year-to-date Change: -13.9% | |
| SASR Links: Profile News Message Board | |
| Charts:- Daily , Weekly | |
| Add SASR to Watchlist: View: Get Complete SASR Trend Analysis ➞ | |
 | EIG Employers Holdings Inc |
| Sector: Financials | |
| SubSector: Insurance - Specialty | |
| MarketCap: 1001.12 Millions | |
| Recent Price: 42.79 Smart Investing & Trading Score: 60 | |
| Day Percent Change: 1.30208% Day Change: 0.34 | |
| Week Change: 2.49102% Year-to-date Change: -14.1% | |
| EIG Links: Profile News Message Board | |
| Charts:- Daily , Weekly | |
| Add EIG to Watchlist: View: Get Complete EIG Trend Analysis ➞ | |
 | ARR ARMOUR Residential REIT Inc |
| Sector: Financials | |
| SubSector: REIT - Mortgage | |
| MarketCap: 1780.79 Millions | |
| Recent Price: 14.75 Smart Investing & Trading Score: 0 | |
| Day Percent Change: -1.27175% Day Change: -0.07 | |
| Week Change: -4.5925% Year-to-date Change: -14.2% | |
| ARR Links: Profile News Message Board | |
| Charts:- Daily , Weekly | |
| Add ARR to Watchlist: View: Get Complete ARR Trend Analysis ➞ | |
 | TW Tradeweb Markets Inc |
| Sector: Financials | |
| SubSector: Capital Markets | |
| MarketCap: 28158.8 Millions | |
| Recent Price: 112.52 Smart Investing & Trading Score: 0 | |
| Day Percent Change: -4.00137% Day Change: -4.58 | |
| Week Change: -5.05443% Year-to-date Change: -14.2% | |
| TW Links: Profile News Message Board | |
| Charts:- Daily , Weekly | |
| Add TW to Watchlist: View: Get Complete TW Trend Analysis ➞ | |
 | SIGI Selective Insurance Group Inc |
| Sector: Financials | |
| SubSector: Insurance - Property & Casualty | |
| MarketCap: 4856.46 Millions | |
| Recent Price: 78.30 Smart Investing & Trading Score: 80 | |
| Day Percent Change: 1.13666% Day Change: 0.22 | |
| Week Change: 0.371747% Year-to-date Change: -14.3% | |
| SIGI Links: Profile News Message Board | |
| Charts:- Daily , Weekly | |
| Add SIGI to Watchlist: View: Get Complete SIGI Trend Analysis ➞ | |
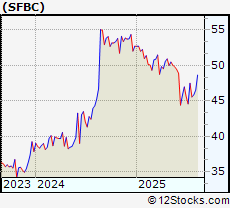 | SFBC Sound Financial Bancorp Inc |
| Sector: Financials | |
| SubSector: Banks - Regional | |
| MarketCap: 121.4 Millions | |
| Recent Price: 46.46 Smart Investing & Trading Score: 40 | |
| Day Percent Change: 2.47022% Day Change: -0.98 | |
| Week Change: -1.52607% Year-to-date Change: -14.5% | |
| SFBC Links: Profile News Message Board | |
| Charts:- Daily , Weekly | |
| Add SFBC to Watchlist: View: Get Complete SFBC Trend Analysis ➞ | |
| For tabular summary view of above stock list: Summary View ➞ 0 - 25 , 25 - 50 , 50 - 75 , 75 - 100 , 100 - 125 , 125 - 150 , 150 - 175 , 175 - 200 , 200 - 225 , 225 - 250 , 250 - 275 , 275 - 300 , 300 - 325 , 325 - 350 , 350 - 375 , 375 - 400 , 400 - 425 , 425 - 450 , 450 - 475 , 475 - 500 , 500 - 525 , 525 - 550 , 550 - 575 , 575 - 600 , 600 - 625 , 625 - 650 , 650 - 675 , 675 - 700 , 700 - 725 , 725 - 750 , 750 - 775 , 775 - 800 , 800 - 825 , 825 - 850 , 850 - 875 , 875 - 900 , 900 - 925 , 925 - 950 , 950 - 975 , 975 - 1000 , 1000 - 1025 , 1025 - 1050 , 1050 - 1075 , 1075 - 1100 , 1100 - 1125 , 1125 - 1150 , 1150 - 1175 , 1175 - 1200 , 1200 - 1225 , 1225 - 1250 , 1250 - 1275 , 1275 - 1300 , 1300 - 1325 , 1325 - 1350 , 1350 - 1375 , 1375 - 1400 , 1400 - 1425 , 1425 - 1450 , 1450 - 1475 , 1475 - 1500 , 1500 - 1525 , 1525 - 1550 | ||
| Click To Change The Sort Order: By Market Cap or Company Size Performance: Year-to-date, Week and Day | |
| Select Chart Type: | ||
|
Best Stocks Today 12Stocks.com |
© 2025 12Stocks.com Terms & Conditions Privacy Contact Us
All Information Provided Only For Education And Not To Be Used For Investing or Trading. See Terms & Conditions


One More Thing ... Get Best Stocks Delivered Daily!
Never Ever Miss A Move With Our Top Ten Stocks Lists
Find Best Stocks In Any Market - Bull or Bear Market
Take A Peek At Our Top Ten Stocks Lists: Daily, Weekly, Year-to-Date & Top Trends
Find Best Stocks In Any Market - Bull or Bear Market
Take A Peek At Our Top Ten Stocks Lists: Daily, Weekly, Year-to-Date & Top Trends
Financial Stocks With Best Up Trends [0-bearish to 100-bullish]: Better Home[100], AMREP Corp[100], PIMCO California[100], Torchmark [100], PIMCO California[100], Triumph Bancorp[100], StepStone [100], Radian [100], National Bank[100], PIMCO Municipal[100], MARA [100]
Best Financial Stocks Year-to-Date:
Insight Select[12384.6%], Oxford Lane[292.479%], Better Home[250.328%], Metalpha Technology[213.274%], Robinhood Markets[206.567%], Cipher Mining[145.528%], Mr. Cooper[133.957%], Banco Santander[130.037%], IHS Holding[117.61%], Deutsche Bank[114.776%], LoanDepot [110.733%] Best Financial Stocks This Week:
Colony Starwood[15929900%], Blackhawk Network[91300%], Macquarie Global[81662.9%], Credit Suisse[63241.6%], Pennsylvania Real[23823%], First Republic[22570.9%], Select ome[14000%], CorEnergy Infrastructure[6797.78%], FedNat Holding[5525%], BlackRock Municipal[5340%], BlackRock MuniYield[3379.04%] Best Financial Stocks Daily:
Better Home[13.3451%], AMREP Corp[11.992%], PIMCO California[11.9545%], Torchmark [11.8363%], Forge Global[11.5409%], PIMCO California[11.4754%], BlackRock Muni[10.8108%], Blackrock MuniYield[10.72%], Triumph Bancorp[10.2661%], StepStone [8.74771%], BlackRock MuniYield[8.15348%]