
 Login Sign Up


| |||||
 |  | ||||

| 12Stocks.com Market Intelligence |
Best Financial Stocks
| In a hurry? Financial Stocks Lists: Performance Trends Table, Stock Charts
Sort Financial stocks: Daily, Weekly, Year-to-Date, Market Cap & Trends. Filter Financial stocks list by size:All Financial Large Mid-Range Small & MicroCap |
| 12Stocks.com Financial Stocks Performances & Trends Daily | |||||||||
|
|  The overall Smart Investing & Trading Score is 33 (0-bearish to 100-bullish) which puts Financial sector in short term bearish to neutral trend. The Smart Investing & Trading Score from previous trading session is 26 and an improvement of trend continues.
| ||||||||
Here are the Smart Investing & Trading Scores of the most requested Financial stocks at 12Stocks.com (click stock name for detailed review):
|


| 12Stocks.com: Investing in Financial sector with Stocks | |
|
The following table helps investors and traders sort through current performance and trends (as measured by Smart Investing & Trading Score) of various
stocks in the Financial sector. Quick View: Move mouse or cursor over stock symbol (ticker) to view short-term Technical chart and over stock name to view long term chart. Click on  to add stock symbol to your watchlist and to add stock symbol to your watchlist and  to view watchlist. Click on any ticker or stock name for detailed market intelligence report for that stock. to view watchlist. Click on any ticker or stock name for detailed market intelligence report for that stock. |
12Stocks.com Performance of Stocks in Financial Sector
| Ticker | Stock Name | Watchlist | Category | Recent Price | Trend Score | Change % | YTD Change% |
| COR | CoreSite Realty |   | REIT - Office | 292.35 | 70 | -0.44% | 30.41% |
| GTY | Getty Realty | | REIT - Retail | 28.46 | 69 | -0.28% | -4.08% |
| AMBC | Ambac | | Insurance | 8.51 | 68 | 2.90% | -32.73% |
| RMR | RMR | | Real Estatet | 16.42 | 68 | 1.80% | -16.04% |
| FIBK | First Interstate | | Regional Banks | 29.71 | 68 | 1.47% | -7.17% |
| GBCI | Glacier Bancorp | | Regional Banks | 44.32 | 68 | 1.26% | -11.00% |
| SYF | Synchrony | | Credit Services | 69.99 | 68 | 1.07% | 8.07% |
| DHC | Diversified Healthcare | | REIT | 3.43 | 68 | 0.59% | 50.49% |
| BPOP | Popular | | Foreign Banks | 115.43 | 68 | 0.32% | 23.68% |
| CATY | Cathay General | | Regional Banks | 45.64 | 68 | 0.26% | -3.43% |
| XHR | Xenia Hotels | | REIT | 12.75 | 68 | -0.31% | -13.17% |
| CMTG | Claros Mortgage | | REIT - Mortgage | 2.89 | 68 | -0.34% | -36.06% |
| LADR | Ladder Capital | | Mortgage | 11.00 | 68 | -0.36% | 0.31% |
| BLK | BlackRock | | Asset Mgmt | 1109.64 | 68 | -0.58% | 8.84% |
| RWT | Redwood Trust | | Mortgage | 5.68 | 68 | -0.87% | -10.46% |
| CUBI | Customers Bancorp | | Regional Banks | 63.43 | 68 | 0.84% | 30.30% |
| GS | Goldman Sachs | | Brokerage | 720.91 | 68 | -0.71% | 26.52% |
| FCFS | FirstCash | | Credit Services | 133.28 | 68 | -1.09% | 29.06% |
| COLD | Americold Realty | | REIT - Industrial | 16.44 | 67 | 4.38% | -22.36% |
| SITC | SITE Centers | | REIT - Retail | 11.34 | 67 | 1.89% | -25.83% |
| CNS | Cohen & Steers | | Asset Mgmt | 74.78 | 67 | 1.27% | -18.44% |
| TWO | Two Harbors | | Mortgage | 10.03 | 67 | 0.50% | -8.72% |
| ELS | Equity LifeStyle | | REIT | 62.05 | 67 | 1.01% | -6.10% |
| SF | Stifel | | Brokerage | 112.20 | 65 | -0.06% | 6.23% |
| BK | Bank of New York | | Asset Mgmt | 100.66 | 65 | -0.74% | 32.58% |
| For chart view version of above stock list: Chart View ➞ 0 - 25 , 25 - 50 , 50 - 75 , 75 - 100 , 100 - 125 , 125 - 150 , 150 - 175 , 175 - 200 , 200 - 225 , 225 - 250 , 250 - 275 , 275 - 300 , 300 - 325 , 325 - 350 , 350 - 375 , 375 - 400 , 400 - 425 , 425 - 450 , 450 - 475 , 475 - 500 , 500 - 525 , 525 - 550 , 550 - 575 | ||
 | Click To Change The Sort Order: By Market Cap or Company Size Performance: Year-to-date, Week and Day |  |
|
Get the most comprehensive stock market coverage daily at 12Stocks.com ➞ Best Stocks Today ➞ Best Stocks Weekly ➞ Best Stocks Year-to-Date ➞ Best Stocks Trends ➞  Best Stocks Today 12Stocks.com Best Nasdaq Stocks ➞ Best S&P 500 Stocks ➞ Best Tech Stocks ➞ Best Biotech Stocks ➞ |
| Detailed Overview of Financial Stocks |
| Financial Technical Overview, Leaders & Laggards, Top Financial ETF Funds & Detailed Financial Stocks List, Charts, Trends & More |
| Financial Sector: Technical Analysis, Trends & YTD Performance | |
| Financial sector is composed of stocks
from banks, brokers, insurance, REITs
and services subsectors. Financial sector, as represented by XLF, an exchange-traded fund [ETF] that holds basket of Financial stocks (e.g, Bank of America, Goldman Sachs) is up by 7.36% and is currently outperforming the overall market by 0.31% year-to-date. Below is a quick view of Technical charts and trends: |
|
 XLF Weekly Chart |
|
| Long Term Trend: Good | |
| Medium Term Trend: Not Good | |
 XLF Daily Chart |
|
| Short Term Trend: Not Good | |
| Overall Trend Score: 33 | |
| YTD Performance: 7.36% | |
| **Trend Scores & Views Are Only For Educational Purposes And Not For Investing | |
| 12Stocks.com: Top Performing Financial Sector Stocks | ||||||||||||||||||||||||||||||||||||||||||||||||
 The top performing Financial sector stocks year to date are
Now, more recently, over last week, the top performing Financial sector stocks on the move are


|
||||||||||||||||||||||||||||||||||||||||||||||||
| 12Stocks.com: Investing in Financial Sector using Exchange Traded Funds | |
|
The following table shows list of key exchange traded funds (ETF) that
help investors track Financial Index. For detailed view, check out our ETF Funds section of our website. Quick View: Move mouse or cursor over ETF symbol (ticker) to view short-term Technical chart and over ETF name to view long term chart. Click on ticker or stock name for detailed view. Click on to add stock symbol to your watchlist and to view watchlist. |
12Stocks.com List of ETFs that track Financial Index
| Ticker | ETF Name | Watchlist | Recent Price | Smart Investing & Trading Score | Change % | Week % | Year-to-date % |
| XLF | Financial | | 51.70 | 33 | -0.4 | 0.58 | 7.36% |
| IAI | Broker-Dealers & Secs | | 173.45 | 53 | -0.87 | 1.45 | 20.77% |
| KBE | Bank | | 56.27 | 51 | 0.52 | 1.83 | 2.16% |
| FAS | Financial Bull 3X | | 159.77 | 33 | -1.27 | 1.61 | 6.12% |
| FAZ | Financial Bear 3X | | 4.60 | 62 | 1.32 | -1.5 | -26.44% |
| UYG | Financials | | 92.14 | 26 | -0.79 | 0.92 | 8.14% |
| KIE | Insurance | | 56.82 | 35 | 0.71 | 1.99 | 1.03% |
| 12Stocks.com: Charts, Trends, Fundamental Data and Performances of Financial Stocks | |
|
We now take in-depth look at all Financial stocks including charts, multi-period performances and overall trends (as measured by Smart Investing & Trading Score). One can sort Financial stocks (click link to choose) by Daily, Weekly and by Year-to-Date performances. Also, one can sort by size of the company or by market capitalization. |
| Select Your Default Chart Type: | |||||
| |||||
| Click on stock symbol or name for detailed view. Click on to add stock symbol to your watchlist and to view watchlist. Quick View: Move mouse or cursor over "Daily" to quickly view daily Technical stock chart and over "Weekly" to view weekly Technical stock chart. | |||||

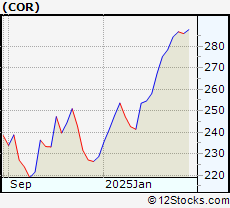 | COR CoreSite Realty Corporation |
| Sector: Financials | |
| SubSector: REIT - Office | |
| MarketCap: 4164.46 Millions | |
| Recent Price: 292.35 Smart Investing & Trading Score: 70 | |
| Day Percent Change: -0.44% Day Change: -1.29 | |
| Week Change: 1.39% Year-to-date Change: 30.4% | |
| COR Links: Profile News Message Board | |
| Charts:- Daily , Weekly | |
| Add COR to Watchlist: View: Get Complete COR Trend Analysis ➞ | |
 | GTY Getty Realty Corp. |
| Sector: Financials | |
| SubSector: REIT - Retail | |
| MarketCap: 926.114 Millions | |
| Recent Price: 28.46 Smart Investing & Trading Score: 69 | |
| Day Percent Change: -0.28% Day Change: -0.08 | |
| Week Change: 1.5% Year-to-date Change: -4.1% | |
| GTY Links: Profile News Message Board | |
| Charts:- Daily , Weekly | |
| Add GTY to Watchlist: View: Get Complete GTY Trend Analysis ➞ | |
 | AMBC Ambac Financial Group, Inc. |
| Sector: Financials | |
| SubSector: Surety & Title Insurance | |
| MarketCap: 587.818 Millions | |
| Recent Price: 8.51 Smart Investing & Trading Score: 68 | |
| Day Percent Change: 2.9% Day Change: 0.24 | |
| Week Change: 2.04% Year-to-date Change: -32.7% | |
| AMBC Links: Profile News Message Board | |
| Charts:- Daily , Weekly | |
| Add AMBC to Watchlist: View: Get Complete AMBC Trend Analysis ➞ | |
 | RMR The RMR Group Inc. |
| Sector: Financials | |
| SubSector: Real Estate Development | |
| MarketCap: 797.419 Millions | |
| Recent Price: 16.42 Smart Investing & Trading Score: 68 | |
| Day Percent Change: 1.8% Day Change: 0.29 | |
| Week Change: 4.25% Year-to-date Change: -16.0% | |
| RMR Links: Profile News Message Board | |
| Charts:- Daily , Weekly | |
| Add RMR to Watchlist: View: Get Complete RMR Trend Analysis ➞ | |
 | FIBK First Interstate BancSystem, Inc. |
| Sector: Financials | |
| SubSector: Regional - Pacific Banks | |
| MarketCap: 1797.69 Millions | |
| Recent Price: 29.71 Smart Investing & Trading Score: 68 | |
| Day Percent Change: 1.47% Day Change: 0.43 | |
| Week Change: 4.58% Year-to-date Change: -7.2% | |
| FIBK Links: Profile News Message Board | |
| Charts:- Daily , Weekly | |
| Add FIBK to Watchlist: View: Get Complete FIBK Trend Analysis ➞ | |
 | GBCI Glacier Bancorp, Inc. |
| Sector: Financials | |
| SubSector: Regional - Pacific Banks | |
| MarketCap: 3142.89 Millions | |
| Recent Price: 44.32 Smart Investing & Trading Score: 68 | |
| Day Percent Change: 1.26% Day Change: 0.55 | |
| Week Change: 3.41% Year-to-date Change: -11.0% | |
| GBCI Links: Profile News Message Board | |
| Charts:- Daily , Weekly | |
| Add GBCI to Watchlist: View: Get Complete GBCI Trend Analysis ➞ | |
 | SYF Synchrony Financial |
| Sector: Financials | |
| SubSector: Credit Services | |
| MarketCap: 9297.28 Millions | |
| Recent Price: 69.99 Smart Investing & Trading Score: 68 | |
| Day Percent Change: 1.07% Day Change: 0.74 | |
| Week Change: 3.64% Year-to-date Change: 8.1% | |
| SYF Links: Profile News Message Board | |
| Charts:- Daily , Weekly | |
| Add SYF to Watchlist: View: Get Complete SYF Trend Analysis ➞ | |
 | DHC Diversified Healthcare Trust |
| Sector: Financials | |
| SubSector: REIT - Healthcare Facilities | |
| MarketCap: 814.114 Millions | |
| Recent Price: 3.43 Smart Investing & Trading Score: 68 | |
| Day Percent Change: 0.59% Day Change: 0.02 | |
| Week Change: 4.89% Year-to-date Change: 50.5% | |
| DHC Links: Profile News Message Board | |
| Charts:- Daily , Weekly | |
| Add DHC to Watchlist: View: Get Complete DHC Trend Analysis ➞ | |
 | BPOP Popular, Inc. |
| Sector: Financials | |
| SubSector: Foreign Regional Banks | |
| MarketCap: 2671.99 Millions | |
| Recent Price: 115.43 Smart Investing & Trading Score: 68 | |
| Day Percent Change: 0.32% Day Change: 0.37 | |
| Week Change: 1.98% Year-to-date Change: 23.7% | |
| BPOP Links: Profile News Message Board | |
| Charts:- Daily , Weekly | |
| Add BPOP to Watchlist: View: Get Complete BPOP Trend Analysis ➞ | |
 | CATY Cathay General Bancorp |
| Sector: Financials | |
| SubSector: Regional - Pacific Banks | |
| MarketCap: 1781.99 Millions | |
| Recent Price: 45.64 Smart Investing & Trading Score: 68 | |
| Day Percent Change: 0.26% Day Change: 0.12 | |
| Week Change: 1.81% Year-to-date Change: -3.4% | |
| CATY Links: Profile News Message Board | |
| Charts:- Daily , Weekly | |
| Add CATY to Watchlist: View: Get Complete CATY Trend Analysis ➞ | |
 | XHR Xenia Hotels & Resorts, Inc. |
| Sector: Financials | |
| SubSector: REIT - Hotel/Motel | |
| MarketCap: 1058.24 Millions | |
| Recent Price: 12.75 Smart Investing & Trading Score: 68 | |
| Day Percent Change: -0.31% Day Change: -0.04 | |
| Week Change: 2.16% Year-to-date Change: -13.2% | |
| XHR Links: Profile News Message Board | |
| Charts:- Daily , Weekly | |
| Add XHR to Watchlist: View: Get Complete XHR Trend Analysis ➞ | |
 | CMTG Claros Mortgage Trust, Inc. |
| Sector: Financials | |
| SubSector: REIT - Mortgage | |
| MarketCap: 1610 Millions | |
| Recent Price: 2.89 Smart Investing & Trading Score: 68 | |
| Day Percent Change: -0.34% Day Change: -0.01 | |
| Week Change: 3.58% Year-to-date Change: -36.1% | |
| CMTG Links: Profile News Message Board | |
| Charts:- Daily , Weekly | |
| Add CMTG to Watchlist: View: Get Complete CMTG Trend Analysis ➞ | |
 | LADR Ladder Capital Corp |
| Sector: Financials | |
| SubSector: Mortgage Investment | |
| MarketCap: 660.039 Millions | |
| Recent Price: 11.00 Smart Investing & Trading Score: 68 | |
| Day Percent Change: -0.36% Day Change: -0.04 | |
| Week Change: 1.2% Year-to-date Change: 0.3% | |
| LADR Links: Profile News Message Board | |
| Charts:- Daily , Weekly | |
| Add LADR to Watchlist: View: Get Complete LADR Trend Analysis ➞ | |
 | BLK BlackRock, Inc. |
| Sector: Financials | |
| SubSector: Asset Management | |
| MarketCap: 61284.9 Millions | |
| Recent Price: 1109.64 Smart Investing & Trading Score: 68 | |
| Day Percent Change: -0.58% Day Change: -6.42 | |
| Week Change: 1.63% Year-to-date Change: 8.8% | |
| BLK Links: Profile News Message Board | |
| Charts:- Daily , Weekly | |
| Add BLK to Watchlist: View: Get Complete BLK Trend Analysis ➞ | |
 | RWT Redwood Trust, Inc. |
| Sector: Financials | |
| SubSector: Mortgage Investment | |
| MarketCap: 674.739 Millions | |
| Recent Price: 5.68 Smart Investing & Trading Score: 68 | |
| Day Percent Change: -0.87% Day Change: -0.05 | |
| Week Change: 4.03% Year-to-date Change: -10.5% | |
| RWT Links: Profile News Message Board | |
| Charts:- Daily , Weekly | |
| Add RWT to Watchlist: View: Get Complete RWT Trend Analysis ➞ | |
 | CUBI Customers Bancorp, Inc. |
| Sector: Financials | |
| SubSector: Regional - Northeast Banks | |
| MarketCap: 385.399 Millions | |
| Recent Price: 63.43 Smart Investing & Trading Score: 68 | |
| Day Percent Change: 0.84% Day Change: 0.53 | |
| Week Change: 1.98% Year-to-date Change: 30.3% | |
| CUBI Links: Profile News Message Board | |
| Charts:- Daily , Weekly | |
| Add CUBI to Watchlist: View: Get Complete CUBI Trend Analysis ➞ | |
 | GS The Goldman Sachs Group, Inc. |
| Sector: Financials | |
| SubSector: Investment Brokerage - National | |
| MarketCap: 54579.3 Millions | |
| Recent Price: 720.91 Smart Investing & Trading Score: 68 | |
| Day Percent Change: -0.71% Day Change: -5.12 | |
| Week Change: 1.6% Year-to-date Change: 26.5% | |
| GS Links: Profile News Message Board | |
| Charts:- Daily , Weekly | |
| Add GS to Watchlist: View: Get Complete GS Trend Analysis ➞ | |
 | FCFS FirstCash, Inc. |
| Sector: Financials | |
| SubSector: Credit Services | |
| MarketCap: 2795.48 Millions | |
| Recent Price: 133.28 Smart Investing & Trading Score: 68 | |
| Day Percent Change: -1.09% Day Change: -1.47 | |
| Week Change: 1.68% Year-to-date Change: 29.1% | |
| FCFS Links: Profile News Message Board | |
| Charts:- Daily , Weekly | |
| Add FCFS to Watchlist: View: Get Complete FCFS Trend Analysis ➞ | |
 | COLD Americold Realty Trust |
| Sector: Financials | |
| SubSector: REIT - Industrial | |
| MarketCap: 6569.69 Millions | |
| Recent Price: 16.44 Smart Investing & Trading Score: 67 | |
| Day Percent Change: 4.38% Day Change: 0.69 | |
| Week Change: 4.65% Year-to-date Change: -22.4% | |
| COLD Links: Profile News Message Board | |
| Charts:- Daily , Weekly | |
| Add COLD to Watchlist: View: Get Complete COLD Trend Analysis ➞ | |
 | SITC SITE Centers Corp. |
| Sector: Financials | |
| SubSector: REIT - Retail | |
| MarketCap: 1449.54 Millions | |
| Recent Price: 11.34 Smart Investing & Trading Score: 67 | |
| Day Percent Change: 1.89% Day Change: 0.21 | |
| Week Change: 6.68% Year-to-date Change: -25.8% | |
| SITC Links: Profile News Message Board | |
| Charts:- Daily , Weekly | |
| Add SITC to Watchlist: View: Get Complete SITC Trend Analysis ➞ | |
 | CNS Cohen & Steers, Inc. |
| Sector: Financials | |
| SubSector: Asset Management | |
| MarketCap: 2082.43 Millions | |
| Recent Price: 74.78 Smart Investing & Trading Score: 67 | |
| Day Percent Change: 1.27% Day Change: 0.94 | |
| Week Change: 3.56% Year-to-date Change: -18.4% | |
| CNS Links: Profile News Message Board | |
| Charts:- Daily , Weekly | |
| Add CNS to Watchlist: View: Get Complete CNS Trend Analysis ➞ | |
 | TWO Two Harbors Investment Corp. |
| Sector: Financials | |
| SubSector: Mortgage Investment | |
| MarketCap: 1979.59 Millions | |
| Recent Price: 10.03 Smart Investing & Trading Score: 67 | |
| Day Percent Change: 0.5% Day Change: 0.05 | |
| Week Change: 2.56% Year-to-date Change: -8.7% | |
| TWO Links: Profile News Message Board | |
| Charts:- Daily , Weekly | |
| Add TWO to Watchlist: View: Get Complete TWO Trend Analysis ➞ | |
 | ELS Equity LifeStyle Properties, Inc. |
| Sector: Financials | |
| SubSector: REIT - Residential | |
| MarketCap: 9570.61 Millions | |
| Recent Price: 62.05 Smart Investing & Trading Score: 67 | |
| Day Percent Change: 1.01% Day Change: 0.62 | |
| Week Change: 2.97% Year-to-date Change: -6.1% | |
| ELS Links: Profile News Message Board | |
| Charts:- Daily , Weekly | |
| Add ELS to Watchlist: View: Get Complete ELS Trend Analysis ➞ | |
 | SF Stifel Financial Corp. |
| Sector: Financials | |
| SubSector: Investment Brokerage - Regional | |
| MarketCap: 2783.65 Millions | |
| Recent Price: 112.20 Smart Investing & Trading Score: 65 | |
| Day Percent Change: -0.06% Day Change: -0.07 | |
| Week Change: 0.93% Year-to-date Change: 6.2% | |
| SF Links: Profile News Message Board | |
| Charts:- Daily , Weekly | |
| Add SF to Watchlist: View: Get Complete SF Trend Analysis ➞ | |
 | BK The Bank of New York Mellon Corporation |
| Sector: Financials | |
| SubSector: Asset Management | |
| MarketCap: 29807.5 Millions | |
| Recent Price: 100.66 Smart Investing & Trading Score: 65 | |
| Day Percent Change: -0.74% Day Change: -0.75 | |
| Week Change: 0.85% Year-to-date Change: 32.6% | |
| BK Links: Profile News Message Board | |
| Charts:- Daily , Weekly | |
| Add BK to Watchlist: View: Get Complete BK Trend Analysis ➞ | |
| For tabular summary view of above stock list: Summary View ➞ 0 - 25 , 25 - 50 , 50 - 75 , 75 - 100 , 100 - 125 , 125 - 150 , 150 - 175 , 175 - 200 , 200 - 225 , 225 - 250 , 250 - 275 , 275 - 300 , 300 - 325 , 325 - 350 , 350 - 375 , 375 - 400 , 400 - 425 , 425 - 450 , 450 - 475 , 475 - 500 , 500 - 525 , 525 - 550 , 550 - 575 | ||
| Click To Change The Sort Order: By Market Cap or Company Size Performance: Year-to-date, Week and Day | |
| Select Chart Type: | ||
|
Best Stocks Today 12Stocks.com |
© 2025 12Stocks.com Terms & Conditions Privacy Contact Us
All Information Provided Only For Education And Not To Be Used For Investing or Trading. See Terms & Conditions


One More Thing ... Get Best Stocks Delivered Daily!
Never Ever Miss A Move With Our Top Ten Stocks Lists
Find Best Stocks In Any Market - Bull or Bear Market
Take A Peek At Our Top Ten Stocks Lists: Daily, Weekly, Year-to-Date & Top Trends
Find Best Stocks In Any Market - Bull or Bear Market
Take A Peek At Our Top Ten Stocks Lists: Daily, Weekly, Year-to-Date & Top Trends
Financial Stocks With Best Up Trends [0-bearish to 100-bullish]: Lemonade [100], MBIA [100], AlTi Global[100], Cushman & Wakefield[100], LGI Homes[100], Rocket [100], Tanger Factory[100], Mr. Cooper[100], CBL & Associates Properties[100], Hamilton Lane[100], Simon Property[100]
Best Financial Stocks Year-to-Date:
ESSA Bancorp[3207.77%], Easterly Government[107.23%], Mr. Cooper[97.21%], Heritage Insurance[79.01%], Root [72.94%], Industrial Logistics[70.13%], Rocket [69.21%], Diversified Healthcare[50.49%], ProAssurance [49.72%], World Acceptance[41.78%], XP [41.43%] Best Financial Stocks This Week:
Uniti [47.66%], Lemonade [31.68%], AlTi Global[24.1%], MBIA [20.54%], Industrial Logistics[14.9%], Cushman & Wakefield[12.24%], Tanger Factory[9.38%], Hippo [9.07%], Rocket [9.01%], LGI Homes[8.92%], eXp World[8.81%] Best Financial Stocks Daily:
Lemonade [29.54%], MBIA [22.5%], AlTi Global[18.05%], Cushman & Wakefield[8.69%], LGI Homes[8.6%], Rocket [6.81%], Alexander s[6.14%], Tanger Factory[5.97%], Brookfield Business[5.91%], Mr. Cooper[5.69%], B. Riley[5.38%]