
 Login Sign Up


| |||||
 |  | ||||

| 12Stocks.com Market Intelligence |
Best Financial Stocks
| In a hurry? Financial Stocks Lists: Performance Trends Table, Stock Charts
Sort Financial stocks: Daily, Weekly, Year-to-Date, Market Cap & Trends. Filter Financial stocks list by size:All Financial Large Mid-Range Small & MicroCap |
| 12Stocks.com Financial Stocks Performances & Trends Daily | |||||||||
|
|  The overall Smart Investing & Trading Score is 90 (0-bearish to 100-bullish) which puts Financial sector in short term bullish trend. The Smart Investing & Trading Score from previous trading session is 60 and an improvement of trend continues.
| ||||||||
Here are the Smart Investing & Trading Scores of the most requested Financial stocks at 12Stocks.com (click stock name for detailed review):
|


| 12Stocks.com: Investing in Financial sector with Stocks | |
|
The following table helps investors and traders sort through current performance and trends (as measured by Smart Investing & Trading Score) of various
stocks in the Financial sector. Quick View: Move mouse or cursor over stock symbol (ticker) to view short-term Technical chart and over stock name to view long term chart. Click on  to add stock symbol to your watchlist and to add stock symbol to your watchlist and  to view watchlist. Click on any ticker or stock name for detailed market intelligence report for that stock. to view watchlist. Click on any ticker or stock name for detailed market intelligence report for that stock. |
12Stocks.com Performance of Stocks in Financial Sector
| Ticker | Stock Name | Watchlist | Category | Recent Price | Smart Investing & Trading Score | Change % | YTD Change% |
| KSM | DWS Strategic |   | Closed-End Fund - Debt | 10.07 | 20 | 0.35% | 0.00% |
| FAM | First Trust/Aberdeen | | Closed-End Fund - Debt | 6.74 | 100 | 3.53% | 0.00% |
| AGM.A | Federal Agricultural | | N/A | 95.40 | 20 | 0.00% | 0.00% |
| APSG | Apollo Strategic | | SPAC | 7.39 | 0 | -2.12% | 0.00% |
| CIIC | CIIG Merger | | SPAC | 9.81 | 20 | 0.10% | 0.00% |
| AVAN | Avanti Acquisition | | SPAC | 10.04 | 20 | 0.00% | 0.00% |
| FST | FAST Acquisition | | SPAC | 10.18 | 30 | 0.00% | 0.00% |
| BRLI | Brilliant Acquisition | | SPAC | 4.70 | 10 | 0.00% | 0.00% |
| VIRS | Pacer BioThreat | | Exchange Traded Fund | 40.03 | 50 | 0.00% | 0.00% |
| QQQN | VictoryShares Nasdaq | | Exchange Traded Fund | 31.65 | 30 | 0.00% | 0.00% |
| IBTE | iShares iBonds | | Exchange Traded Fund | 23.87 | 30 | 0.00% | 0.00% |
| GERM | ETFMG Treatments | | Exchange Traded Fund | 19.16 | 40 | -0.29% | 0.00% |
| AMTR | ETRACS Alerian | | Exchange Traded Fund | 76.66 | 10 | 0.00% | 0.00% |
| NETC | Nabors Energy | | SPAC | 11.00 | 50 | 2.52% | 0.00% |
| HMA | Heartland Media | | SPAC | 10.54 | 30 | 0.00% | 0.00% |
| MVF | BlackRock MuniVest | | Closed-End Fund - Debt | 6.94 | 80 | -0.29% | -0.01% |
| AON | Aon | | Insurance | 352.76 | 0 | -1.46% | -0.03% |
| NRK | Nuveen New | | Closed-End Fund - Debt | 10.02 | 90 | 0.00% | -0.09% |
| USA | Liberty All-Star | | Closed-End Fund - Equity | 6.49 | 20 | 0.15% | -0.10% |
| WABC | Westamerica Ban | | Banks - Regional | 50.08 | 90 | 3.34% | -0.13% |
| PROV | Provident | | Banks - Regional | 15.71 | 90 | 0.96% | -0.16% |
| UE | Urban Edge | | REIT - Retail | 20.76 | 60 | 1.17% | -0.18% |
| EPRT | Essential Properties | | REIT - Retail | 30.19 | 40 | 0.90% | -0.24% |
| IVR | Invesco Mortgage | | REIT - Mortgage | 7.43 | 0 | -2.24% | -0.28% |
| NYMTL | New York | | REIT - Mortgage | 21.82 | 10 | -0.32% | -0.34% |
| For chart view version of above stock list: Chart View ➞ 0 - 25 , 25 - 50 , 50 - 75 , 75 - 100 , 100 - 125 , 125 - 150 , 150 - 175 , 175 - 200 , 200 - 225 , 225 - 250 , 250 - 275 , 275 - 300 , 300 - 325 , 325 - 350 , 350 - 375 , 375 - 400 , 400 - 425 , 425 - 450 , 450 - 475 , 475 - 500 , 500 - 525 , 525 - 550 , 550 - 575 , 575 - 600 , 600 - 625 , 625 - 650 , 650 - 675 , 675 - 700 , 700 - 725 , 725 - 750 , 750 - 775 , 775 - 800 , 800 - 825 , 825 - 850 , 850 - 875 , 875 - 900 , 900 - 925 , 925 - 950 , 950 - 975 , 975 - 1000 , 1000 - 1025 , 1025 - 1050 , 1050 - 1075 , 1075 - 1100 , 1100 - 1125 , 1125 - 1150 , 1150 - 1175 , 1175 - 1200 , 1200 - 1225 , 1225 - 1250 , 1250 - 1275 , 1275 - 1300 , 1300 - 1325 , 1325 - 1350 , 1350 - 1375 , 1375 - 1400 , 1400 - 1425 , 1425 - 1450 , 1450 - 1475 , 1475 - 1500 , 1500 - 1525 , 1525 - 1550 | ||
 | Click To Change The Sort Order: By Market Cap or Company Size Performance: Year-to-date, Week and Day |  |
|
Get the most comprehensive stock market coverage daily at 12Stocks.com ➞ Best Stocks Today ➞ Best Stocks Weekly ➞ Best Stocks Year-to-Date ➞ Best Stocks Trends ➞  Best Stocks Today 12Stocks.com Best Nasdaq Stocks ➞ Best S&P 500 Stocks ➞ Best Tech Stocks ➞ Best Biotech Stocks ➞ |
| Detailed Overview of Financial Stocks |
| Financial Technical Overview, Leaders & Laggards, Top Financial ETF Funds & Detailed Financial Stocks List, Charts, Trends & More |
| Financial Sector: Technical Analysis, Trends & YTD Performance | |
| Financial sector is composed of stocks
from banks, brokers, insurance, REITs
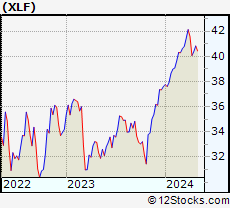
and services subsectors. Financial sector, as represented by XLF, an exchange-traded fund [ETF] that holds basket of Financial stocks (e.g, Bank of America, Goldman Sachs) is up by 13.0735% and is currently underperforming the overall market by -0.7866% year-to-date. Below is a quick view of Technical charts and trends: |
|
 XLF Weekly Chart |
|
| Long Term Trend: Good | |
| Medium Term Trend: Good | |
 XLF Daily Chart |
|
| Short Term Trend: Very Good | |
| Overall Trend Score: 90 | |
| YTD Performance: 13.0735% | |
| **Trend Scores & Views Are Only For Educational Purposes And Not For Investing | |
| 12Stocks.com: Top Performing Financial Sector Stocks | |||||||||||||||||||||||||||||||||||||||||||||||
 The top performing Financial sector stocks year to date are
Now, more recently, over last week, the top performing Financial sector stocks on the move are


|
|||||||||||||||||||||||||||||||||||||||||||||||
| 12Stocks.com: Investing in Financial Sector using Exchange Traded Funds | |
|
The following table shows list of key exchange traded funds (ETF) that
help investors track Financial Index. For detailed view, check out our ETF Funds section of our website. Quick View: Move mouse or cursor over ETF symbol (ticker) to view short-term Technical chart and over ETF name to view long term chart. Click on ticker or stock name for detailed view. Click on to add stock symbol to your watchlist and to view watchlist. |
12Stocks.com List of ETFs that track Financial Index
| Ticker | ETF Name | Watchlist | Recent Price | Smart Investing & Trading Score | Change % | Week % | Year-to-date % |
| CHIX | China Financials | | 10.57 | 20 | 0 | 0 | 0% |
| 12Stocks.com: Charts, Trends, Fundamental Data and Performances of Financial Stocks | |
|
We now take in-depth look at all Financial stocks including charts, multi-period performances and overall trends (as measured by Smart Investing & Trading Score). One can sort Financial stocks (click link to choose) by Daily, Weekly and by Year-to-Date performances. Also, one can sort by size of the company or by market capitalization. |
| Select Your Default Chart Type: | |||||
| |||||
| Click on stock symbol or name for detailed view. Click on to add stock symbol to your watchlist and to view watchlist. Quick View: Move mouse or cursor over "Daily" to quickly view daily Technical stock chart and over "Weekly" to view weekly Technical stock chart. | |||||

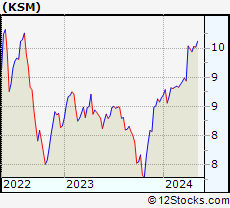 | KSM DWS Strategic Municipal Income Trust |
| Sector: Financials | |
| SubSector: Closed-End Fund - Debt | |
| MarketCap: 103.607 Millions | |
| Recent Price: 10.07 Smart Investing & Trading Score: 20 | |
| Day Percent Change: 0.348606% Day Change: -9999 | |
| Week Change: -0.738916% Year-to-date Change: 0.0% | |
| KSM Links: Profile News Message Board | |
| Charts:- Daily , Weekly | |
| Add KSM to Watchlist: View: Get Complete KSM Trend Analysis ➞ | |
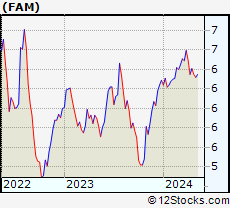 | FAM First Trust/Aberdeen Global Opportunity Income Fund |
| Sector: Financials | |
| SubSector: Closed-End Fund - Debt | |
| MarketCap: 103.307 Millions | |
| Recent Price: 6.74 Smart Investing & Trading Score: 100 | |
| Day Percent Change: 3.53303% Day Change: -9999 | |
| Week Change: 3.21593% Year-to-date Change: 0.0% | |
| FAM Links: Profile News Message Board | |
| Charts:- Daily , Weekly | |
| Add FAM to Watchlist: View: Get Complete FAM Trend Analysis ➞ | |
 | AGM.A Federal Agricultural Mtge A |
| Sector: Financials | |
| SubSector: N/A | |
| MarketCap: 208.327 Millions | |
| Recent Price: 95.40 Smart Investing & Trading Score: 20 | |
| Day Percent Change: 0% Day Change: -9999 | |
| Week Change: 2.58065% Year-to-date Change: 0.0% | |
| AGM.A Links: Profile News Message Board | |
| Charts:- Daily , Weekly | |
| Add AGM.A to Watchlist: View: Get Complete AGM.A Trend Analysis ➞ | |
 | APSG Apollo Strategic Growth Capital |
| Sector: Financials | |
| SubSector: SPAC | |
| MarketCap: 10357 Millions | |
| Recent Price: 7.39 Smart Investing & Trading Score: 0 | |
| Day Percent Change: -2.11921% Day Change: -9999 | |
| Week Change: -25.8776% Year-to-date Change: 0.0% | |
| APSG Links: Profile News Message Board | |
| Charts:- Daily , Weekly | |
| Add APSG to Watchlist: View: Get Complete APSG Trend Analysis ➞ | |
 | CIIC CIIG Merger Corp. |
| Sector: Financials | |
| SubSector: SPAC | |
| MarketCap: 10157 Millions | |
| Recent Price: 9.81 Smart Investing & Trading Score: 20 | |
| Day Percent Change: 0.102041% Day Change: -9999 | |
| Week Change: -54.5833% Year-to-date Change: 0.0% | |
| CIIC Links: Profile News Message Board | |
| Charts:- Daily , Weekly | |
| Add CIIC to Watchlist: View: Get Complete CIIC Trend Analysis ➞ | |
 | AVAN Avanti Acquisition Corp. |
| Sector: Financials | |
| SubSector: SPAC | |
| MarketCap: 60157 Millions | |
| Recent Price: 10.04 Smart Investing & Trading Score: 20 | |
| Day Percent Change: 0% Day Change: -9999 | |
| Week Change: 0% Year-to-date Change: 0.0% | |
| AVAN Links: Profile News Message Board | |
| Charts:- Daily , Weekly | |
| Add AVAN to Watchlist: View: Get Complete AVAN Trend Analysis ➞ | |
 | FST FAST Acquisition Corp. |
| Sector: Financials | |
| SubSector: SPAC | |
| MarketCap: 20157 Millions | |
| Recent Price: 10.18 Smart Investing & Trading Score: 30 | |
| Day Percent Change: 0% Day Change: -9999 | |
| Week Change: 0% Year-to-date Change: 0.0% | |
| FST Links: Profile News Message Board | |
| Charts:- Daily , Weekly | |
| Add FST to Watchlist: View: Get Complete FST Trend Analysis ➞ | |
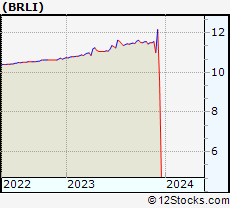 | BRLI Brilliant Acquisition Corporation |
| Sector: Financials | |
| SubSector: SPAC | |
| MarketCap: 60157 Millions | |
| Recent Price: 4.70 Smart Investing & Trading Score: 10 | |
| Day Percent Change: 0% Day Change: -9999 | |
| Week Change: 0% Year-to-date Change: 0.0% | |
| BRLI Links: Profile News Message Board | |
| Charts:- Daily , Weekly | |
| Add BRLI to Watchlist: View: Get Complete BRLI Trend Analysis ➞ | |
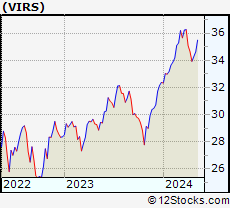 | VIRS Pacer BioThreat Strategy ETF |
| Sector: Financials | |
| SubSector: Exchange Traded Fund | |
| MarketCap: 60157 Millions | |
| Recent Price: 40.03 Smart Investing & Trading Score: 50 | |
| Day Percent Change: 0.00374766% Day Change: -9999 | |
| Week Change: 0.103789% Year-to-date Change: 0.0% | |
| VIRS Links: Profile News Message Board | |
| Charts:- Daily , Weekly | |
| Add VIRS to Watchlist: View: Get Complete VIRS Trend Analysis ➞ | |
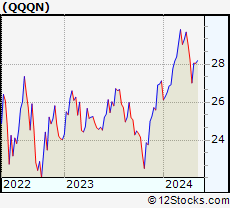 | QQQN VictoryShares Nasdaq Next 50 ETF |
| Sector: Financials | |
| SubSector: Exchange Traded Fund | |
| MarketCap: 60157 Millions | |
| Recent Price: 31.65 Smart Investing & Trading Score: 30 | |
| Day Percent Change: 0% Day Change: -9999 | |
| Week Change: 0% Year-to-date Change: 0.0% | |
| QQQN Links: Profile News Message Board | |
| Charts:- Daily , Weekly | |
| Add QQQN to Watchlist: View: Get Complete QQQN Trend Analysis ➞ | |
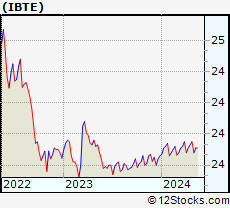 | IBTE iShares iBonds Dec 2024 Term Treasury ETF |
| Sector: Financials | |
| SubSector: Exchange Traded Fund | |
| MarketCap: 60157 Millions | |
| Recent Price: 23.87 Smart Investing & Trading Score: 30 | |
| Day Percent Change: 0% Day Change: -9999 | |
| Week Change: 0.0419111% Year-to-date Change: 0.0% | |
| IBTE Links: Profile News Message Board | |
| Charts:- Daily , Weekly | |
| Add IBTE to Watchlist: View: Get Complete IBTE Trend Analysis ➞ | |
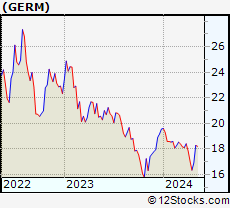 | GERM ETFMG Treatments, Testing and Advancements ETF |
| Sector: Financials | |
| SubSector: Exchange Traded Fund | |
| MarketCap: 60157 Millions | |
| Recent Price: 19.16 Smart Investing & Trading Score: 40 | |
| Day Percent Change: -0.287307% Day Change: -9999 | |
| Week Change: -0.00365375% Year-to-date Change: 0.0% | |
| GERM Links: Profile News Message Board | |
| Charts:- Daily , Weekly | |
| Add GERM to Watchlist: View: Get Complete GERM Trend Analysis ➞ | |
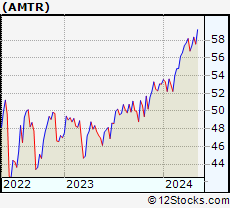 | AMTR ETRACS Alerian Midstream Energy Total Return Index ETN |
| Sector: Financials | |
| SubSector: Exchange Traded Fund | |
| MarketCap: 60157 Millions | |
| Recent Price: 76.66 Smart Investing & Trading Score: 10 | |
| Day Percent Change: 0% Day Change: -9999 | |
| Week Change: -2.44585% Year-to-date Change: 0.0% | |
| AMTR Links: Profile News Message Board | |
| Charts:- Daily , Weekly | |
| Add AMTR to Watchlist: View: Get Complete AMTR Trend Analysis ➞ | |
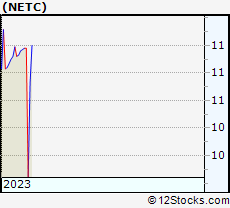 | NETC Nabors Energy Transition Corp. |
| Sector: Financials | |
| SubSector: SPAC | |
| MarketCap: 367 Millions | |
| Recent Price: 11.00 Smart Investing & Trading Score: 50 | |
| Day Percent Change: 2.51631% Day Change: -9999 | |
| Week Change: 9.56175% Year-to-date Change: 0.0% | |
| NETC Links: Profile News Message Board | |
| Charts:- Daily , Weekly | |
| Add NETC to Watchlist: View: Get Complete NETC Trend Analysis ➞ | |
 | HMA Heartland Media Acquisition Corp. |
| Sector: Financials | |
| SubSector: SPAC | |
| MarketCap: 254 Millions | |
| Recent Price: 10.54 Smart Investing & Trading Score: 30 | |
| Day Percent Change: 0% Day Change: -9999 | |
| Week Change: 0% Year-to-date Change: 0.0% | |
| HMA Links: Profile News Message Board | |
| Charts:- Daily , Weekly | |
| Add HMA to Watchlist: View: Get Complete HMA Trend Analysis ➞ | |
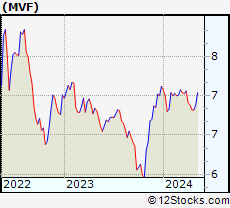 | MVF BlackRock MuniVest Fund, Inc |
| Sector: Financials | |
| SubSector: Closed-End Fund - Debt | |
| MarketCap: 395.18 Millions | |
| Recent Price: 6.94 Smart Investing & Trading Score: 80 | |
| Day Percent Change: -0.287356% Day Change: -0.03 | |
| Week Change: 1.01892% Year-to-date Change: 0.0% | |
| MVF Links: Profile News Message Board | |
| Charts:- Daily , Weekly | |
| Add MVF to Watchlist: View: Get Complete MVF Trend Analysis ➞ | |
 | AON Aon plc |
| Sector: Financials | |
| SubSector: Insurance Brokers | |
| MarketCap: 79898.3 Millions | |
| Recent Price: 352.76 Smart Investing & Trading Score: 0 | |
| Day Percent Change: -1.46369% Day Change: -2.35 | |
| Week Change: -2.65199% Year-to-date Change: 0.0% | |
| AON Links: Profile News Message Board | |
| Charts:- Daily , Weekly | |
| Add AON to Watchlist: View: Get Complete AON Trend Analysis ➞ | |
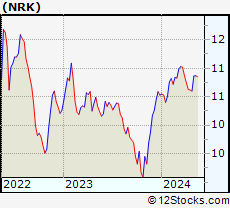 | NRK Nuveen New York AMT-Free Quality Municipal Income Fund |
| Sector: Financials | |
| SubSector: Closed-End Fund - Debt | |
| MarketCap: 841.82 Millions | |
| Recent Price: 10.02 Smart Investing & Trading Score: 90 | |
| Day Percent Change: 0% Day Change: -0.02 | |
| Week Change: 1.93286% Year-to-date Change: -0.1% | |
| NRK Links: Profile News Message Board | |
| Charts:- Daily , Weekly | |
| Add NRK to Watchlist: View: Get Complete NRK Trend Analysis ➞ | |
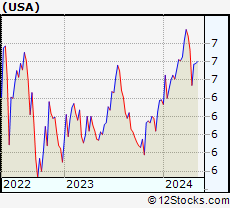 | USA Liberty All-Star Equity Fund |
| Sector: Financials | |
| SubSector: Closed-End Fund - Equity | |
| MarketCap: 1939.61 Millions | |
| Recent Price: 6.49 Smart Investing & Trading Score: 20 | |
| Day Percent Change: 0.154321% Day Change: -0.08 | |
| Week Change: -1.06707% Year-to-date Change: -0.1% | |
| USA Links: Profile News Message Board | |
| Charts:- Daily , Weekly | |
| Add USA to Watchlist: View: Get Complete USA Trend Analysis ➞ | |
 | WABC Westamerica Bancorporation |
| Sector: Financials | |
| SubSector: Banks - Regional | |
| MarketCap: 1261.13 Millions | |
| Recent Price: 50.08 Smart Investing & Trading Score: 90 | |
| Day Percent Change: 3.34296% Day Change: -0.26 | |
| Week Change: 2.12072% Year-to-date Change: -0.1% | |
| WABC Links: Profile News Message Board | |
| Charts:- Daily , Weekly | |
| Add WABC to Watchlist: View: Get Complete WABC Trend Analysis ➞ | |
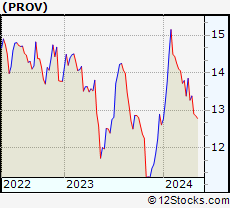 | PROV Provident Financial Holdings, Inc |
| Sector: Financials | |
| SubSector: Banks - Regional | |
| MarketCap: 101.94 Millions | |
| Recent Price: 15.71 Smart Investing & Trading Score: 90 | |
| Day Percent Change: 0.96401% Day Change: -0.28 | |
| Week Change: 1.68285% Year-to-date Change: -0.2% | |
| PROV Links: Profile News Message Board | |
| Charts:- Daily , Weekly | |
| Add PROV to Watchlist: View: Get Complete PROV Trend Analysis ➞ | |
 | UE Urban Edge Properties |
| Sector: Financials | |
| SubSector: REIT - Retail | |
| MarketCap: 2806.92 Millions | |
| Recent Price: 20.76 Smart Investing & Trading Score: 60 | |
| Day Percent Change: 1.16959% Day Change: -0.2 | |
| Week Change: -1.23692% Year-to-date Change: -0.2% | |
| UE Links: Profile News Message Board | |
| Charts:- Daily , Weekly | |
| Add UE to Watchlist: View: Get Complete UE Trend Analysis ➞ | |
 | EPRT Essential Properties Realty Trust Inc |
| Sector: Financials | |
| SubSector: REIT - Retail | |
| MarketCap: 6119.76 Millions | |
| Recent Price: 30.19 Smart Investing & Trading Score: 40 | |
| Day Percent Change: 0.902406% Day Change: 0.04 | |
| Week Change: 1.68407% Year-to-date Change: -0.2% | |
| EPRT Links: Profile News Message Board | |
| Charts:- Daily , Weekly | |
| Add EPRT to Watchlist: View: Get Complete EPRT Trend Analysis ➞ | |
 | IVR Invesco Mortgage Capital Inc |
| Sector: Financials | |
| SubSector: REIT - Mortgage | |
| MarketCap: 529.13 Millions | |
| Recent Price: 7.43 Smart Investing & Trading Score: 0 | |
| Day Percent Change: -2.23684% Day Change: -0.09 | |
| Week Change: -4.3758% Year-to-date Change: -0.3% | |
| IVR Links: Profile News Message Board | |
| Charts:- Daily , Weekly | |
| Add IVR to Watchlist: View: Get Complete IVR Trend Analysis ➞ | |
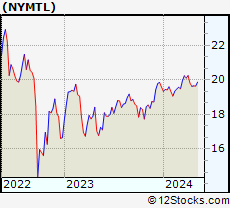 | NYMTL New York Mortgage Trust, Inc. |
| Sector: Financials | |
| SubSector: REIT - Mortgage | |
| MarketCap: 905 Millions | |
| Recent Price: 21.82 Smart Investing & Trading Score: 10 | |
| Day Percent Change: -0.319781% Day Change: 0.02 | |
| Week Change: -0.365297% Year-to-date Change: -0.3% | |
| NYMTL Links: Profile News Message Board | |
| Charts:- Daily , Weekly | |
| Add NYMTL to Watchlist: View: Get Complete NYMTL Trend Analysis ➞ | |
| For tabular summary view of above stock list: Summary View ➞ 0 - 25 , 25 - 50 , 50 - 75 , 75 - 100 , 100 - 125 , 125 - 150 , 150 - 175 , 175 - 200 , 200 - 225 , 225 - 250 , 250 - 275 , 275 - 300 , 300 - 325 , 325 - 350 , 350 - 375 , 375 - 400 , 400 - 425 , 425 - 450 , 450 - 475 , 475 - 500 , 500 - 525 , 525 - 550 , 550 - 575 , 575 - 600 , 600 - 625 , 625 - 650 , 650 - 675 , 675 - 700 , 700 - 725 , 725 - 750 , 750 - 775 , 775 - 800 , 800 - 825 , 825 - 850 , 850 - 875 , 875 - 900 , 900 - 925 , 925 - 950 , 950 - 975 , 975 - 1000 , 1000 - 1025 , 1025 - 1050 , 1050 - 1075 , 1075 - 1100 , 1100 - 1125 , 1125 - 1150 , 1150 - 1175 , 1175 - 1200 , 1200 - 1225 , 1225 - 1250 , 1250 - 1275 , 1275 - 1300 , 1300 - 1325 , 1325 - 1350 , 1350 - 1375 , 1375 - 1400 , 1400 - 1425 , 1425 - 1450 , 1450 - 1475 , 1475 - 1500 , 1500 - 1525 , 1525 - 1550 | ||
| Click To Change The Sort Order: By Market Cap or Company Size Performance: Year-to-date, Week and Day | |
| Select Chart Type: | ||
|
Best Stocks Today 12Stocks.com |
© 2025 12Stocks.com Terms & Conditions Privacy Contact Us
All Information Provided Only For Education And Not To Be Used For Investing or Trading. See Terms & Conditions


One More Thing ... Get Best Stocks Delivered Daily!
Never Ever Miss A Move With Our Top Ten Stocks Lists
Find Best Stocks In Any Market - Bull or Bear Market
Take A Peek At Our Top Ten Stocks Lists: Daily, Weekly, Year-to-Date & Top Trends
Find Best Stocks In Any Market - Bull or Bear Market
Take A Peek At Our Top Ten Stocks Lists: Daily, Weekly, Year-to-Date & Top Trends
Financial Stocks With Best Up Trends [0-bearish to 100-bullish]: Better Home[100], AMREP Corp[100], PIMCO California[100], Torchmark [100], PIMCO California[100], Triumph Bancorp[100], StepStone [100], Radian [100], National Bank[100], PIMCO Municipal[100], MARA [100]
Best Financial Stocks Year-to-Date:
Insight Select[12384.6%], Oxford Lane[292.479%], Better Home[250.328%], Metalpha Technology[213.274%], Robinhood Markets[206.567%], Cipher Mining[145.528%], Mr. Cooper[133.957%], Banco Santander[130.037%], IHS Holding[117.61%], Deutsche Bank[114.776%], LoanDepot [110.733%] Best Financial Stocks This Week:
Colony Starwood[15929900%], Blackhawk Network[91300%], Macquarie Global[81662.9%], Credit Suisse[63241.6%], Pennsylvania Real[23823%], First Republic[22570.9%], Select ome[14000%], CorEnergy Infrastructure[6797.78%], FedNat Holding[5525%], BlackRock Municipal[5340%], BlackRock MuniYield[3379.04%] Best Financial Stocks Daily:
Better Home[13.3451%], AMREP Corp[11.992%], PIMCO California[11.9545%], Torchmark [11.8363%], Forge Global[11.5409%], PIMCO California[11.4754%], BlackRock Muni[10.8108%], Blackrock MuniYield[10.72%], Triumph Bancorp[10.2661%], StepStone [8.74771%], BlackRock MuniYield[8.15348%]