
 Login Sign Up


| |||||
 |  | ||||

| 12Stocks.com Market Intelligence |
Best Financial Stocks
| In a hurry? Financial Stocks Lists: Performance Trends Table, Stock Charts
Sort Financial stocks: Daily, Weekly, Year-to-Date, Market Cap & Trends. Filter Financial stocks list by size:All Financial Large Mid-Range Small & MicroCap |
| 12Stocks.com Financial Stocks Performances & Trends Daily | |||||||||
|
|  The overall Smart Investing & Trading Score is 33 (0-bearish to 100-bullish) which puts Financial sector in short term bearish to neutral trend. The Smart Investing & Trading Score from previous trading session is 26 and an improvement of trend continues.
| ||||||||
Here are the Smart Investing & Trading Scores of the most requested Financial stocks at 12Stocks.com (click stock name for detailed review):
|


| 12Stocks.com: Investing in Financial sector with Stocks | |
|
The following table helps investors and traders sort through current performance and trends (as measured by Smart Investing & Trading Score) of various
stocks in the Financial sector. Quick View: Move mouse or cursor over stock symbol (ticker) to view short-term Technical chart and over stock name to view long term chart. Click on  to add stock symbol to your watchlist and to add stock symbol to your watchlist and  to view watchlist. Click on any ticker or stock name for detailed market intelligence report for that stock. to view watchlist. Click on any ticker or stock name for detailed market intelligence report for that stock. |
12Stocks.com Performance of Stocks in Financial Sector
| Ticker | Stock Name | Watchlist | Category | Recent Price | Trend Score | Change % | YTD Change% |
| FBNC | First Bancorp |   | Regional Banks | 49.95 | 78 | 1.40% | 14.22% |
| CMA | Comerica | | Banks | 67.60 | 78 | 0.31% | 10.67% |
| TPG | TPG | | Asset Mgmt | 57.28 | 78 | 0.25% | -8.01% |
| RJF | Raymond James | | Brokerage | 166.62 | 78 | 0.08% | 8.00% |
| JHG | Janus Henderson | | Asset Mgmt | 42.99 | 78 | -0.42% | 1.97% |
| NDAQ | Nasdaq | | Investments | 96.34 | 78 | -0.59% | 25.03% |
| WSBF | Waterstone | | S&L | 13.47 | 76 | 1.13% | 2.66% |
| WAFD | Washington Federal | | S&L | 29.72 | 76 | 1.05% | -6.98% |
| IBOC | Bancshares | | Regional - Southwest Banks | 69.48 | 76 | 0.40% | 11.20% |
| PJT | PJT Partners | | Asset Mgmt | 181.73 | 76 | 0.00% | 15.35% |
| HPP | Hudson Pacific | | REIT - Office | 2.52 | 75 | 4.56% | -16.83% |
| AX | Axos | | S&L | 85.90 | 75 | 0.43% | 22.98% |
| HTH | Hilltop | | Mortgage | 30.35 | 75 | 0.00% | 6.61% |
| CNA | CNA | | Insurance | 46.58 | 74 | 2.01% | -2.79% |
| ESNT | Essent | | Mortgage | 57.56 | 74 | 1.11% | 6.34% |
| FBRT | Franklin BSP | | REIT - Mortgage | 10.89 | 74 | 0.65% | -10.72% |
| EXPI | eXp World | | Property Mgmt | 10.25 | 73 | 1.43% | -10.49% |
| MC | Moelis & | | Asset Mgmt | 70.25 | 73 | 1.25% | -4.09% |
| HIFS | Hingham Institution | | S&L | 248.48 | 73 | 1.07% | -1.99% |
| AROW | Arrow | | Regional Banks | 26.82 | 73 | 0.94% | -5.60% |
| FCF | First Commonwealth | | Regional Banks | 16.70 | 73 | 0.72% | -0.55% |
| TBBK | Bancorp | | Regional Banks | 64.85 | 73 | 0.57% | 23.22% |
| FSBC | Five Star | | Banks - Regional | 30.17 | 73 | 0.27% | 0.93% |
| COLB | Columbia Banking | | S&L | 24.17 | 71 | 1.21% | -9.29% |
| NTB | Bank of N.T. Butterfield & Son | | Foreign Banks | 45.63 | 70 | -0.72% | 26.29% |
| For chart view version of above stock list: Chart View ➞ 0 - 25 , 25 - 50 , 50 - 75 , 75 - 100 , 100 - 125 , 125 - 150 , 150 - 175 , 175 - 200 , 200 - 225 , 225 - 250 , 250 - 275 , 275 - 300 , 300 - 325 , 325 - 350 , 350 - 375 , 375 - 400 , 400 - 425 , 425 - 450 , 450 - 475 , 475 - 500 , 500 - 525 , 525 - 550 , 550 - 575 | ||
 | Click To Change The Sort Order: By Market Cap or Company Size Performance: Year-to-date, Week and Day |  |
|
Get the most comprehensive stock market coverage daily at 12Stocks.com ➞ Best Stocks Today ➞ Best Stocks Weekly ➞ Best Stocks Year-to-Date ➞ Best Stocks Trends ➞  Best Stocks Today 12Stocks.com Best Nasdaq Stocks ➞ Best S&P 500 Stocks ➞ Best Tech Stocks ➞ Best Biotech Stocks ➞ |
| Detailed Overview of Financial Stocks |
| Financial Technical Overview, Leaders & Laggards, Top Financial ETF Funds & Detailed Financial Stocks List, Charts, Trends & More |
| Financial Sector: Technical Analysis, Trends & YTD Performance | |
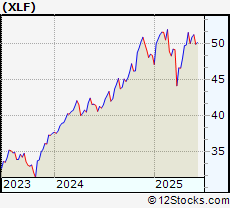
| Financial sector is composed of stocks
from banks, brokers, insurance, REITs
and services subsectors. Financial sector, as represented by XLF, an exchange-traded fund [ETF] that holds basket of Financial stocks (e.g, Bank of America, Goldman Sachs) is up by 7.36% and is currently outperforming the overall market by 0.31% year-to-date. Below is a quick view of Technical charts and trends: |
|
 XLF Weekly Chart |
|
| Long Term Trend: Good | |
| Medium Term Trend: Not Good | |
 XLF Daily Chart |
|
| Short Term Trend: Not Good | |
| Overall Trend Score: 33 | |
| YTD Performance: 7.36% | |
| **Trend Scores & Views Are Only For Educational Purposes And Not For Investing | |
| 12Stocks.com: Top Performing Financial Sector Stocks | ||||||||||||||||||||||||||||||||||||||||||||||||
 The top performing Financial sector stocks year to date are
Now, more recently, over last week, the top performing Financial sector stocks on the move are


|
||||||||||||||||||||||||||||||||||||||||||||||||
| 12Stocks.com: Investing in Financial Sector using Exchange Traded Funds | |
|
The following table shows list of key exchange traded funds (ETF) that
help investors track Financial Index. For detailed view, check out our ETF Funds section of our website. Quick View: Move mouse or cursor over ETF symbol (ticker) to view short-term Technical chart and over ETF name to view long term chart. Click on ticker or stock name for detailed view. Click on to add stock symbol to your watchlist and to view watchlist. |
12Stocks.com List of ETFs that track Financial Index
| Ticker | ETF Name | Watchlist | Recent Price | Smart Investing & Trading Score | Change % | Week % | Year-to-date % |
| XLF | Financial | | 51.70 | 33 | -0.4 | 0.58 | 7.36% |
| IAI | Broker-Dealers & Secs | | 173.45 | 53 | -0.87 | 1.45 | 20.77% |
| KBE | Bank | | 56.27 | 51 | 0.52 | 1.83 | 2.16% |
| FAS | Financial Bull 3X | | 159.77 | 33 | -1.27 | 1.61 | 6.12% |
| FAZ | Financial Bear 3X | | 4.60 | 62 | 1.32 | -1.5 | -26.44% |
| UYG | Financials | | 92.14 | 26 | -0.79 | 0.92 | 8.14% |
| KIE | Insurance | | 56.82 | 35 | 0.71 | 1.99 | 1.03% |
| 12Stocks.com: Charts, Trends, Fundamental Data and Performances of Financial Stocks | |
|
We now take in-depth look at all Financial stocks including charts, multi-period performances and overall trends (as measured by Smart Investing & Trading Score). One can sort Financial stocks (click link to choose) by Daily, Weekly and by Year-to-Date performances. Also, one can sort by size of the company or by market capitalization. |
| Select Your Default Chart Type: | |||||
| |||||
| Click on stock symbol or name for detailed view. Click on to add stock symbol to your watchlist and to view watchlist. Quick View: Move mouse or cursor over "Daily" to quickly view daily Technical stock chart and over "Weekly" to view weekly Technical stock chart. | |||||

 | FBNC First Bancorp |
| Sector: Financials | |
| SubSector: Regional - Mid-Atlantic Banks | |
| MarketCap: 664.959 Millions | |
| Recent Price: 49.95 Smart Investing & Trading Score: 78 | |
| Day Percent Change: 1.4% Day Change: 0.69 | |
| Week Change: 3.29% Year-to-date Change: 14.2% | |
| FBNC Links: Profile News Message Board | |
| Charts:- Daily , Weekly | |
| Add FBNC to Watchlist: View: Get Complete FBNC Trend Analysis ➞ | |
 | CMA Comerica Incorporated |
| Sector: Financials | |
| SubSector: Money Center Banks | |
| MarketCap: 4449.49 Millions | |
| Recent Price: 67.60 Smart Investing & Trading Score: 78 | |
| Day Percent Change: 0.31% Day Change: 0.21 | |
| Week Change: 1.49% Year-to-date Change: 10.7% | |
| CMA Links: Profile News Message Board | |
| Charts:- Daily , Weekly | |
| Add CMA to Watchlist: View: Get Complete CMA Trend Analysis ➞ | |
 | TPG TPG Inc. |
| Sector: Financials | |
| SubSector: Asset Management | |
| MarketCap: 8700 Millions | |
| Recent Price: 57.28 Smart Investing & Trading Score: 78 | |
| Day Percent Change: 0.25% Day Change: 0.14 | |
| Week Change: 2.58% Year-to-date Change: -8.0% | |
| TPG Links: Profile News Message Board | |
| Charts:- Daily , Weekly | |
| Add TPG to Watchlist: View: Get Complete TPG Trend Analysis ➞ | |
 | RJF Raymond James Financial, Inc. |
| Sector: Financials | |
| SubSector: Investment Brokerage - Regional | |
| MarketCap: 9490.65 Millions | |
| Recent Price: 166.62 Smart Investing & Trading Score: 78 | |
| Day Percent Change: 0.08% Day Change: 0.14 | |
| Week Change: 2.2% Year-to-date Change: 8.0% | |
| RJF Links: Profile News Message Board | |
| Charts:- Daily , Weekly | |
| Add RJF to Watchlist: View: Get Complete RJF Trend Analysis ➞ | |
 | JHG Janus Henderson Group plc |
| Sector: Financials | |
| SubSector: Asset Management | |
| MarketCap: 2992.33 Millions | |
| Recent Price: 42.99 Smart Investing & Trading Score: 78 | |
| Day Percent Change: -0.42% Day Change: -0.18 | |
| Week Change: 1.63% Year-to-date Change: 2.0% | |
| JHG Links: Profile News Message Board | |
| Charts:- Daily , Weekly | |
| Add JHG to Watchlist: View: Get Complete JHG Trend Analysis ➞ | |
 | NDAQ Nasdaq, Inc. |
| Sector: Financials | |
| SubSector: Diversified Investments | |
| MarketCap: 14885.2 Millions | |
| Recent Price: 96.34 Smart Investing & Trading Score: 78 | |
| Day Percent Change: -0.59% Day Change: -0.57 | |
| Week Change: 1.23% Year-to-date Change: 25.0% | |
| NDAQ Links: Profile News Message Board | |
| Charts:- Daily , Weekly | |
| Add NDAQ to Watchlist: View: Get Complete NDAQ Trend Analysis ➞ | |
 | WSBF Waterstone Financial, Inc. |
| Sector: Financials | |
| SubSector: Savings & Loans | |
| MarketCap: 371.93 Millions | |
| Recent Price: 13.47 Smart Investing & Trading Score: 76 | |
| Day Percent Change: 1.13% Day Change: 0.15 | |
| Week Change: 1.97% Year-to-date Change: 2.7% | |
| WSBF Links: Profile News Message Board | |
| Charts:- Daily , Weekly | |
| Add WSBF to Watchlist: View: Get Complete WSBF Trend Analysis ➞ | |
 | WAFD Washington Federal, Inc. |
| Sector: Financials | |
| SubSector: Savings & Loans | |
| MarketCap: 2219.2 Millions | |
| Recent Price: 29.72 Smart Investing & Trading Score: 76 | |
| Day Percent Change: 1.05% Day Change: 0.31 | |
| Week Change: 2.94% Year-to-date Change: -7.0% | |
| WAFD Links: Profile News Message Board | |
| Charts:- Daily , Weekly | |
| Add WAFD to Watchlist: View: Get Complete WAFD Trend Analysis ➞ | |
 | IBOC International Bancshares Corporation |
| Sector: Financials | |
| SubSector: Regional - Southwest Banks | |
| MarketCap: 1159.45 Millions | |
| Recent Price: 69.48 Smart Investing & Trading Score: 76 | |
| Day Percent Change: 0.4% Day Change: 0.28 | |
| Week Change: 3.02% Year-to-date Change: 11.2% | |
| IBOC Links: Profile News Message Board | |
| Charts:- Daily , Weekly | |
| Add IBOC to Watchlist: View: Get Complete IBOC Trend Analysis ➞ | |
 | PJT PJT Partners Inc. |
| Sector: Financials | |
| SubSector: Asset Management | |
| MarketCap: 1100.93 Millions | |
| Recent Price: 181.73 Smart Investing & Trading Score: 76 | |
| Day Percent Change: 0% Day Change: 0 | |
| Week Change: 1.51% Year-to-date Change: 15.4% | |
| PJT Links: Profile News Message Board | |
| Charts:- Daily , Weekly | |
| Add PJT to Watchlist: View: Get Complete PJT Trend Analysis ➞ | |
 | HPP Hudson Pacific Properties, Inc. |
| Sector: Financials | |
| SubSector: REIT - Office | |
| MarketCap: 3267.16 Millions | |
| Recent Price: 2.52 Smart Investing & Trading Score: 75 | |
| Day Percent Change: 4.56% Day Change: 0.11 | |
| Week Change: 4.56% Year-to-date Change: -16.8% | |
| HPP Links: Profile News Message Board | |
| Charts:- Daily , Weekly | |
| Add HPP to Watchlist: View: Get Complete HPP Trend Analysis ➞ | |
 | AX Axos Financial, Inc. |
| Sector: Financials | |
| SubSector: Savings & Loans | |
| MarketCap: 1037.3 Millions | |
| Recent Price: 85.90 Smart Investing & Trading Score: 75 | |
| Day Percent Change: 0.43% Day Change: 0.37 | |
| Week Change: 1.77% Year-to-date Change: 23.0% | |
| AX Links: Profile News Message Board | |
| Charts:- Daily , Weekly | |
| Add AX to Watchlist: View: Get Complete AX Trend Analysis ➞ | |
 | HTH Hilltop Holdings Inc. |
| Sector: Financials | |
| SubSector: Mortgage Investment | |
| MarketCap: 1317.89 Millions | |
| Recent Price: 30.35 Smart Investing & Trading Score: 75 | |
| Day Percent Change: 0% Day Change: 0 | |
| Week Change: 2.64% Year-to-date Change: 6.6% | |
| HTH Links: Profile News Message Board | |
| Charts:- Daily , Weekly | |
| Add HTH to Watchlist: View: Get Complete HTH Trend Analysis ➞ | |
 | CNA CNA Financial Corporation |
| Sector: Financials | |
| SubSector: Property & Casualty Insurance | |
| MarketCap: 9123.32 Millions | |
| Recent Price: 46.58 Smart Investing & Trading Score: 74 | |
| Day Percent Change: 2.01% Day Change: 0.92 | |
| Week Change: 6.13% Year-to-date Change: -2.8% | |
| CNA Links: Profile News Message Board | |
| Charts:- Daily , Weekly | |
| Add CNA to Watchlist: View: Get Complete CNA Trend Analysis ➞ | |
 | ESNT Essent Group Ltd. |
| Sector: Financials | |
| SubSector: Mortgage Investment | |
| MarketCap: 2806.19 Millions | |
| Recent Price: 57.56 Smart Investing & Trading Score: 74 | |
| Day Percent Change: 1.11% Day Change: 0.63 | |
| Week Change: 1.84% Year-to-date Change: 6.3% | |
| ESNT Links: Profile News Message Board | |
| Charts:- Daily , Weekly | |
| Add ESNT to Watchlist: View: Get Complete ESNT Trend Analysis ➞ | |
 | FBRT Franklin BSP Realty Trust, Inc. |
| Sector: Financials | |
| SubSector: REIT - Mortgage | |
| MarketCap: 1170 Millions | |
| Recent Price: 10.89 Smart Investing & Trading Score: 74 | |
| Day Percent Change: 0.65% Day Change: 0.07 | |
| Week Change: 3.91% Year-to-date Change: -10.7% | |
| FBRT Links: Profile News Message Board | |
| Charts:- Daily , Weekly | |
| Add FBRT to Watchlist: View: Get Complete FBRT Trend Analysis ➞ | |
 | EXPI eXp World Holdings, Inc. |
| Sector: Financials | |
| SubSector: Property Management | |
| MarketCap: 448.042 Millions | |
| Recent Price: 10.25 Smart Investing & Trading Score: 73 | |
| Day Percent Change: 1.43% Day Change: 0.14 | |
| Week Change: 8.81% Year-to-date Change: -10.5% | |
| EXPI Links: Profile News Message Board | |
| Charts:- Daily , Weekly | |
| Add EXPI to Watchlist: View: Get Complete EXPI Trend Analysis ➞ | |
 | MC Moelis & Company |
| Sector: Financials | |
| SubSector: Asset Management | |
| MarketCap: 1675.93 Millions | |
| Recent Price: 70.25 Smart Investing & Trading Score: 73 | |
| Day Percent Change: 1.25% Day Change: 0.87 | |
| Week Change: 2.44% Year-to-date Change: -4.1% | |
| MC Links: Profile News Message Board | |
| Charts:- Daily , Weekly | |
| Add MC to Watchlist: View: Get Complete MC Trend Analysis ➞ | |
 | HIFS Hingham Institution for Savings |
| Sector: Financials | |
| SubSector: Savings & Loans | |
| MarketCap: 341.93 Millions | |
| Recent Price: 248.48 Smart Investing & Trading Score: 73 | |
| Day Percent Change: 1.07% Day Change: 2.64 | |
| Week Change: 3.62% Year-to-date Change: -2.0% | |
| HIFS Links: Profile News Message Board | |
| Charts:- Daily , Weekly | |
| Add HIFS to Watchlist: View: Get Complete HIFS Trend Analysis ➞ | |
 | AROW Arrow Financial Corporation |
| Sector: Financials | |
| SubSector: Regional - Northeast Banks | |
| MarketCap: 413.999 Millions | |
| Recent Price: 26.82 Smart Investing & Trading Score: 73 | |
| Day Percent Change: 0.94% Day Change: 0.25 | |
| Week Change: 2.52% Year-to-date Change: -5.6% | |
| AROW Links: Profile News Message Board | |
| Charts:- Daily , Weekly | |
| Add AROW to Watchlist: View: Get Complete AROW Trend Analysis ➞ | |
 | FCF First Commonwealth Financial Corporation |
| Sector: Financials | |
| SubSector: Regional - Northeast Banks | |
| MarketCap: 900.299 Millions | |
| Recent Price: 16.70 Smart Investing & Trading Score: 73 | |
| Day Percent Change: 0.72% Day Change: 0.12 | |
| Week Change: 2.27% Year-to-date Change: -0.6% | |
| FCF Links: Profile News Message Board | |
| Charts:- Daily , Weekly | |
| Add FCF to Watchlist: View: Get Complete FCF Trend Analysis ➞ | |
 | TBBK The Bancorp, Inc. |
| Sector: Financials | |
| SubSector: Regional - Mid-Atlantic Banks | |
| MarketCap: 267.859 Millions | |
| Recent Price: 64.85 Smart Investing & Trading Score: 73 | |
| Day Percent Change: 0.57% Day Change: 0.37 | |
| Week Change: 3.78% Year-to-date Change: 23.2% | |
| TBBK Links: Profile News Message Board | |
| Charts:- Daily , Weekly | |
| Add TBBK to Watchlist: View: Get Complete TBBK Trend Analysis ➞ | |
 | FSBC Five Star Bancorp |
| Sector: Financials | |
| SubSector: Banks - Regional | |
| MarketCap: 377 Millions | |
| Recent Price: 30.17 Smart Investing & Trading Score: 73 | |
| Day Percent Change: 0.27% Day Change: 0.08 | |
| Week Change: 2.48% Year-to-date Change: 0.9% | |
| FSBC Links: Profile News Message Board | |
| Charts:- Daily , Weekly | |
| Add FSBC to Watchlist: View: Get Complete FSBC Trend Analysis ➞ | |
 | COLB Columbia Banking System, Inc. |
| Sector: Financials | |
| SubSector: Savings & Loans | |
| MarketCap: 1868.3 Millions | |
| Recent Price: 24.17 Smart Investing & Trading Score: 71 | |
| Day Percent Change: 1.21% Day Change: 0.29 | |
| Week Change: 3.91% Year-to-date Change: -9.3% | |
| COLB Links: Profile News Message Board | |
| Charts:- Daily , Weekly | |
| Add COLB to Watchlist: View: Get Complete COLB Trend Analysis ➞ | |
 | NTB The Bank of N.T. Butterfield & Son Limited |
| Sector: Financials | |
| SubSector: Foreign Regional Banks | |
| MarketCap: 889.379 Millions | |
| Recent Price: 45.63 Smart Investing & Trading Score: 70 | |
| Day Percent Change: -0.72% Day Change: -0.33 | |
| Week Change: 2.03% Year-to-date Change: 26.3% | |
| NTB Links: Profile News Message Board | |
| Charts:- Daily , Weekly | |
| Add NTB to Watchlist: View: Get Complete NTB Trend Analysis ➞ | |
| For tabular summary view of above stock list: Summary View ➞ 0 - 25 , 25 - 50 , 50 - 75 , 75 - 100 , 100 - 125 , 125 - 150 , 150 - 175 , 175 - 200 , 200 - 225 , 225 - 250 , 250 - 275 , 275 - 300 , 300 - 325 , 325 - 350 , 350 - 375 , 375 - 400 , 400 - 425 , 425 - 450 , 450 - 475 , 475 - 500 , 500 - 525 , 525 - 550 , 550 - 575 | ||
| Click To Change The Sort Order: By Market Cap or Company Size Performance: Year-to-date, Week and Day | |
| Select Chart Type: | ||
|
Best Stocks Today 12Stocks.com |
© 2025 12Stocks.com Terms & Conditions Privacy Contact Us
All Information Provided Only For Education And Not To Be Used For Investing or Trading. See Terms & Conditions


One More Thing ... Get Best Stocks Delivered Daily!
Never Ever Miss A Move With Our Top Ten Stocks Lists
Find Best Stocks In Any Market - Bull or Bear Market
Take A Peek At Our Top Ten Stocks Lists: Daily, Weekly, Year-to-Date & Top Trends
Find Best Stocks In Any Market - Bull or Bear Market
Take A Peek At Our Top Ten Stocks Lists: Daily, Weekly, Year-to-Date & Top Trends
Financial Stocks With Best Up Trends [0-bearish to 100-bullish]: Lemonade [100], MBIA [100], AlTi Global[100], Cushman & Wakefield[100], LGI Homes[100], Rocket [100], Tanger Factory[100], Mr. Cooper[100], CBL & Associates Properties[100], Hamilton Lane[100], Simon Property[100]
Best Financial Stocks Year-to-Date:
ESSA Bancorp[3207.77%], Easterly Government[107.23%], Mr. Cooper[97.21%], Heritage Insurance[79.01%], Root [72.94%], Industrial Logistics[70.13%], Rocket [69.21%], Diversified Healthcare[50.49%], ProAssurance [49.72%], World Acceptance[41.78%], XP [41.43%] Best Financial Stocks This Week:
Uniti [47.66%], Lemonade [31.68%], AlTi Global[24.1%], MBIA [20.54%], Industrial Logistics[14.9%], Cushman & Wakefield[12.24%], Tanger Factory[9.38%], Hippo [9.07%], Rocket [9.01%], LGI Homes[8.92%], eXp World[8.81%] Best Financial Stocks Daily:
Lemonade [29.54%], MBIA [22.5%], AlTi Global[18.05%], Cushman & Wakefield[8.69%], LGI Homes[8.6%], Rocket [6.81%], Alexander s[6.14%], Tanger Factory[5.97%], Brookfield Business[5.91%], Mr. Cooper[5.69%], B. Riley[5.38%]