
 Login Sign Up


| |||||
 |  | ||||

| 12Stocks.com Market Intelligence |
Best Emerging Markets Stocks
| In a hurry? Emerging Markets Stocks Lists: Trends Table, Stock Charts
Sort Emerging Markets stocks: Daily, Weekly, Year-to-Date, Market Cap & Trends. Filter Emerging Markets stocks list by sector: Show all, Tech, Finance, Energy, Staples, Retail, Industrial, Materials, Utilities and HealthCare Filter Emerging Markets stocks list by size:All Large Medium Small |
| 12Stocks.com Emerging Markets Stocks Performances & Trends Daily | |||||||||
|
|  The overall Smart Investing & Trading Score is 100 (0-bearish to 100-bullish) which puts Emerging Markets index in short term bullish trend. The Smart Investing & Trading Score from previous trading session is 78 and hence an improvement of trend.
| ||||||||
Here are the Smart Investing & Trading Scores of the most requested Emerging Markets stocks at 12Stocks.com (click stock name for detailed review):
|


| 12Stocks.com: Top Performing Emerging Markets Index Stocks | ||||||||||||||||||||||||||||||||||||||||||||||||
 The top performing Emerging Markets Index stocks year to date are
Now, more recently, over last week, the top performing Emerging Markets Index stocks on the move are


|
||||||||||||||||||||||||||||||||||||||||||||||||
| 12Stocks.com: Investing in Emerging Markets Index with Stocks | |
|
The following table helps investors and traders sort through current performance and trends (as measured by Smart Investing & Trading Score ) of various
stocks in the Emerging Markets Index. Quick View: Move mouse or cursor over stock symbol (ticker) to view short-term technical chart and over stock name to view long term chart. Click on  to add stock symbol to your watchlist and to add stock symbol to your watchlist and  to view watchlist. Click on any ticker or stock name for detailed market intelligence report for that stock. to view watchlist. Click on any ticker or stock name for detailed market intelligence report for that stock. |
12Stocks.com Performance of Stocks in Emerging Markets Index
| Ticker | Stock Name | Watchlist | Category | Recent Price | Smart Investing & Trading Score | Change % | YTD Change% |
| BSBR | Banco Santander |   | Financials | 5.74 | 77 | 1.59% | -12.37% |
| TOUR | Tuniu | | Consumer Staples | 0.94 | 76 | -0.53% | 39.34% |
| EH | EHang | | Industrials | 18.32 | 75 | 3.15% | 9.05% |
| PBR | Petroleo Brasileiro | | Energy | 17.34 | 75 | 2.36% | 8.58% |
| OMAB | Grupo Aeroportuario | | Transports | 87.68 | 75 | 1.82% | 3.60% |
| VLRS | Controladora Vuela | | Transports | 8.38 | 75 | 1.45% | -10.66% |
| TWN | Taiwan Fund | | Financials | 39.32 | 75 | 1.39% | 13.67% |
| PAC | Grupo Aeroportuario | | Transports | 182.95 | 75 | 0.96% | 4.41% |
| LND | BrasilAgro - | | Financials | 4.95 | 75 | 0.61% | -6.25% |
| AMX | America Movil | | Technology | 18.87 | 75 | -1.31% | 1.89% |
| MLCO | Melco Resorts | | Services & Goods | 7.15 | 74 | 8.50% | -19.39% |
| YI | 111 | | Services & Goods | 1.12 | 74 | 6.67% | -27.74% |
| NIO | NIO | | Consumer Staples | 5.59 | 74 | 6.07% | -38.37% |
| ZLAB | Zai Lab | | Health Care | 16.59 | 74 | 4.34% | -39.30% |
| ATAT | Atour Lifestyle | | Services & Goods | 18.54 | 74 | 3.84% | 5.82% |
| BGNE | BeiGene | | Health Care | 162.01 | 74 | 3.50% | -10.17% |
| ABEV | Ambev S.A | | Consumer Staples | 2.41 | 74 | 2.99% | -13.93% |
| JKS | JinkoSolar Holding | | Technology | 25.53 | 74 | 1.63% | -30.89% |
| BEST | BEST | | Consumer Staples | 2.13 | 73 | 0.95% | -16.52% |
| SY | So-Young | | Technology | 1.29 | 73 | 0.78% | 0.00% |
| ERJ | Embraer S.A | | Industrials | 25.77 | 70 | -0.69% | 39.67% |
| HKD | AMTD Digital | | Technology | 3.48 | 69 | -4.40% | -15.74% |
| VTMX | Vesta Financials | | Financials | 36.12 | 68 | 0.33% | -9.17% |
| SDA | SunCar | | Services & Goods | 7.59 | 68 | -1.88% | -2.38% |
| VALE | Vale S.A | | Materials | 12.52 | 67 | 2.62% | -21.06% |
| For chart view version of above stock list: Chart View ➞ 0 - 25 , 25 - 50 , 50 - 75 , 75 - 100 , 100 - 125 , 125 - 150 , 150 - 175 , 175 - 200 | ||
 | Click To Change The Sort Order: By Market Cap or Company Size Performance: Year-to-date, Week and Day |  |
|
Get the most comprehensive stock market coverage daily at 12Stocks.com ➞ Best Stocks Today ➞ Best Stocks Weekly ➞ Best Stocks Year-to-Date ➞ Best Stocks Trends ➞  Best Stocks Today 12Stocks.com Best Nasdaq Stocks ➞ Best S&P 500 Stocks ➞ Best Tech Stocks ➞ Best Biotech Stocks ➞ |
| Detailed Overview of Emerging Markets Stocks |
| Emerging Markets Technical Overview, Leaders & Laggards, Top Emerging Markets ETF Funds & Detailed Emerging Markets Stocks List, Charts, Trends & More |
| Emerging Markets: Technical Analysis, Trends & YTD Performance | |
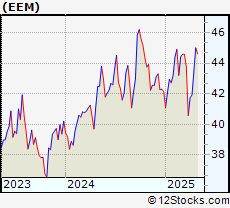
 EEM Weekly Chart |
|
| Long Term Trend: Very Good | |
| Medium Term Trend: Very Good | |
 EEM Daily Chart |
|
| Short Term Trend: Very Good | |
| Overall Trend Score: 100 | |
| YTD Performance: 4.68% | |
| **Trend Scores & Views Are Only For Educational Purposes And Not For Investing | |
| 12Stocks.com: Investing in Emerging Markets Index using Exchange Traded Funds | |
|
The following table shows list of key exchange traded funds (ETF) that
help investors play Emerging Markets stock market. For detailed view, check out our ETF Funds section of our website. Quick View: Move mouse or cursor over ETF symbol (ticker) to view short-term technical chart and over ETF name to view long term chart. Click on ticker or stock name for detailed view. Click on to add stock symbol to your watchlist and to view watchlist. |
12Stocks.com List of ETFs that track Emerging Markets Index
| Ticker | ETF Name | Watchlist | Recent Price | Smart Investing & Trading Score | Change % | Week % | Year-to-date % |
| EEM | Emerging Markets | | 42.09 | 100 | 2.58 | 2.23 | 4.68% |
| VWO | Emerging Markets | | 43.25 | 100 | 2.44 | 2.2 | 5.23% |
| SCHE | Emerging Markets Equity | | 26.16 | 100 | 2.59 | 2.31 | 5.53% |
| EWX | Emerging Markets Small | | 57.90 | 100 | 1.74 | 2.24 | 2.55% |
| EET | Emerging Markets | | 53.45 | 100 | 5.05 | 4.32 | 5.09% |
| EDC | Emrg Mkts Bull | | 31.95 | 100 | 7.48 | 6.46 | 5% |
| EEV | Short Emerging | | 18.17 | 0 | -5.36 | -5.48 | -7.87% |
| EUM | Short Emerging | | 13.68 | 0 | -2.56 | -2.18 | -3.32% |
| EDIV | Emerging Markets Dividend | | 34.42 | 95 | 1.62 | 2.41 | 5.84% |
| EMIF | Emerging Markets Infrastructure | | 22.05 | 66 | 0.00 | -0.32 | 3.03% |
| CEW | Emerging Currency Strat | | 17.78 | 62 | 0.48 | 0.57 | -1.24% |
| EBND | Em Mkts Lcl | | 20.05 | 35 | 0.96 | 0.5 | -5.6% |
| EMCB | Emerging Markets Corp | | 63.96 | 55 | 0.47 | 0.38 | 0.09% |
| VWOB | Emerging Mkts Govt | | 62.56 | 45 | 0.76 | 0.26 | -1.87% |
| EEMA | Emerging Markets Asia | | 70.34 | 100 | 2.99 | 2.31 | 6.4% |
| EELV | Em Mkts Low | | 23.94 | 87 | 1.92 | 2.26 | -0.42% |
| DVYE | Emerging Markets Dividend | | 27.64 | 100 | 1.92 | 2.48 | 4.34% |
| SDEM | SuperDividend Em Mkts | | 25.99 | 70 | 1.39 | 1.84 | 4.81% |
| DBEM | Em Mkts Hdgd | | 24.36 | 100 | 1.68 | 1.68 | 5.6% |
| PCY | Emerging Markets Sov | | 19.89 | 27 | 0.91 | 0.76 | -3.54% |
| QEMM | Emerging Mkts StratcFacts | | 58.41 | 100 | 1.93 | 1.87 | 2.2% |
| 12Stocks.com: Charts, Trends, Fundamental Data and Performances of Emerging Markets Stocks | |
|
We now take in-depth look at all Emerging Markets stocks including charts, multi-period performances and overall trends (as measured by Smart Investing & Trading Score ). One can sort Emerging Markets stocks (click link to choose) by Daily, Weekly and by Year-to-Date performances. Also, one can sort by size of the company or by market capitalization. |
| Select Your Default Chart Type: | |||||
| |||||
| Click on stock symbol or name for detailed view. Click on to add stock symbol to your watchlist and to view watchlist. Quick View: Move mouse or cursor over "Daily" to quickly view daily technical stock chart and over "Weekly" to view weekly technical stock chart. | |||||

 | BSBR Banco Santander (Brasil) S.A. |
| Sector: Financials | |
| SubSector: Foreign Regional Banks | |
| MarketCap: 21961.4 Millions | |
| Recent Price: 5.74 Smart Investing & Trading Score : 77 | |
| Day Percent Change: 1.59% Day Change: 0.09 | |
| Week Change: 7.09% Year-to-date Change: -12.4% | |
| BSBR Links: Profile News Message Board | |
| Charts:- Daily , Weekly | |
| Add BSBR to Watchlist: View: Get Complete BSBR Trend Analysis ➞ | |
 | TOUR Tuniu Corporation |
| Sector: Consumer Staples | |
| SubSector: Recreational Goods, Other | |
| MarketCap: 124.459 Millions | |
| Recent Price: 0.94 Smart Investing & Trading Score : 76 | |
| Day Percent Change: -0.53% Day Change: 0.00 | |
| Week Change: 10.31% Year-to-date Change: 39.3% | |
| TOUR Links: Profile News Message Board | |
| Charts:- Daily , Weekly | |
| Add TOUR to Watchlist: View: Get Complete TOUR Trend Analysis ➞ | |
 | EH EHang Holdings Limited |
| Sector: Industrials | |
| SubSector: Aerospace/Defense Products & Services | |
| MarketCap: 513.401 Millions | |
| Recent Price: 18.32 Smart Investing & Trading Score : 75 | |
| Day Percent Change: 3.15% Day Change: 0.56 | |
| Week Change: 0.44% Year-to-date Change: 9.1% | |
| EH Links: Profile News Message Board | |
| Charts:- Daily , Weekly | |
| Add EH to Watchlist: View: Get Complete EH Trend Analysis ➞ | |
 | PBR Petroleo Brasileiro S.A. - Petrobras |
| Sector: Energy | |
| SubSector: Oil & Gas Drilling & Exploration | |
| MarketCap: 38939.2 Millions | |
| Recent Price: 17.34 Smart Investing & Trading Score : 75 | |
| Day Percent Change: 2.36% Day Change: 0.40 | |
| Week Change: 1.7% Year-to-date Change: 8.6% | |
| PBR Links: Profile News Message Board | |
| Charts:- Daily , Weekly | |
| Add PBR to Watchlist: View: Get Complete PBR Trend Analysis ➞ | |
 | OMAB Grupo Aeroportuario del Centro Norte, S.A.B. de C.V. |
| Sector: Transports | |
| SubSector: Air Services, Other | |
| MarketCap: 1196.38 Millions | |
| Recent Price: 87.68 Smart Investing & Trading Score : 75 | |
| Day Percent Change: 1.82% Day Change: 1.57 | |
| Week Change: -0.5% Year-to-date Change: 3.6% | |
| OMAB Links: Profile News Message Board | |
| Charts:- Daily , Weekly | |
| Add OMAB to Watchlist: View: Get Complete OMAB Trend Analysis ➞ | |
 | VLRS Controladora Vuela Compania de Aviacion, S.A.B. de C.V. |
| Sector: Transports | |
| SubSector: Major Airlines | |
| MarketCap: 382 Millions | |
| Recent Price: 8.38 Smart Investing & Trading Score : 75 | |
| Day Percent Change: 1.45% Day Change: 0.12 | |
| Week Change: -2.78% Year-to-date Change: -10.7% | |
| VLRS Links: Profile News Message Board | |
| Charts:- Daily , Weekly | |
| Add VLRS to Watchlist: View: Get Complete VLRS Trend Analysis ➞ | |
 | TWN The Taiwan Fund, Inc. |
| Sector: Financials | |
| SubSector: Closed-End Fund - Foreign | |
| MarketCap: 110.547 Millions | |
| Recent Price: 39.32 Smart Investing & Trading Score : 75 | |
| Day Percent Change: 1.39% Day Change: 0.54 | |
| Week Change: 2.5% Year-to-date Change: 13.7% | |
| TWN Links: Profile News Message Board | |
| Charts:- Daily , Weekly | |
| Add TWN to Watchlist: View: Get Complete TWN Trend Analysis ➞ | |
 | PAC Grupo Aeroportuario del Pacifico, S.A.B. de C.V. |
| Sector: Transports | |
| SubSector: Air Services, Other | |
| MarketCap: 3204.18 Millions | |
| Recent Price: 182.95 Smart Investing & Trading Score : 75 | |
| Day Percent Change: 0.96% Day Change: 1.74 | |
| Week Change: -0.28% Year-to-date Change: 4.4% | |
| PAC Links: Profile News Message Board | |
| Charts:- Daily , Weekly | |
| Add PAC to Watchlist: View: Get Complete PAC Trend Analysis ➞ | |
 | LND BrasilAgro - Companhia Brasileira de Propriedades Agricolas |
| Sector: Financials | |
| SubSector: Property Management | |
| MarketCap: 157.842 Millions | |
| Recent Price: 4.95 Smart Investing & Trading Score : 75 | |
| Day Percent Change: 0.61% Day Change: 0.03 | |
| Week Change: 0% Year-to-date Change: -6.3% | |
| LND Links: Profile News Message Board | |
| Charts:- Daily , Weekly | |
| Add LND to Watchlist: View: Get Complete LND Trend Analysis ➞ | |
 | AMX America Movil, S.A.B. de C.V. |
| Sector: Technology | |
| SubSector: Wireless Communications | |
| MarketCap: 44726.6 Millions | |
| Recent Price: 18.87 Smart Investing & Trading Score : 75 | |
| Day Percent Change: -1.31% Day Change: -0.25 | |
| Week Change: 0.21% Year-to-date Change: 1.9% | |
| AMX Links: Profile News Message Board | |
| Charts:- Daily , Weekly | |
| Add AMX to Watchlist: View: Get Complete AMX Trend Analysis ➞ | |
 | MLCO Melco Resorts & Entertainment Limited |
| Sector: Services & Goods | |
| SubSector: Resorts & Casinos | |
| MarketCap: 7031.14 Millions | |
| Recent Price: 7.15 Smart Investing & Trading Score : 74 | |
| Day Percent Change: 8.50% Day Change: 0.56 | |
| Week Change: 12.78% Year-to-date Change: -19.4% | |
| MLCO Links: Profile News Message Board | |
| Charts:- Daily , Weekly | |
| Add MLCO to Watchlist: View: Get Complete MLCO Trend Analysis ➞ | |
 | YI 111, Inc. |
| Sector: Services & Goods | |
| SubSector: Drug Stores | |
| MarketCap: 520.351 Millions | |
| Recent Price: 1.12 Smart Investing & Trading Score : 74 | |
| Day Percent Change: 6.67% Day Change: 0.07 | |
| Week Change: 9.27% Year-to-date Change: -27.7% | |
| YI Links: Profile News Message Board | |
| Charts:- Daily , Weekly | |
| Add YI to Watchlist: View: Get Complete YI Trend Analysis ➞ | |
 | NIO NIO Limited |
| Sector: Consumer Staples | |
| SubSector: Auto Manufacturers - Major | |
| MarketCap: 2679.71 Millions | |
| Recent Price: 5.59 Smart Investing & Trading Score : 74 | |
| Day Percent Change: 6.07% Day Change: 0.32 | |
| Week Change: 24.5% Year-to-date Change: -38.4% | |
| NIO Links: Profile News Message Board | |
| Charts:- Daily , Weekly | |
| Add NIO to Watchlist: View: Get Complete NIO Trend Analysis ➞ | |
 | ZLAB Zai Lab Limited |
| Sector: Health Care | |
| SubSector: Biotechnology | |
| MarketCap: 3970.35 Millions | |
| Recent Price: 16.59 Smart Investing & Trading Score : 74 | |
| Day Percent Change: 4.34% Day Change: 0.69 | |
| Week Change: 4.27% Year-to-date Change: -39.3% | |
| ZLAB Links: Profile News Message Board | |
| Charts:- Daily , Weekly | |
| Add ZLAB to Watchlist: View: Get Complete ZLAB Trend Analysis ➞ | |
 | ATAT Atour Lifestyle Holdings Limited |
| Sector: Services & Goods | |
| SubSector: Lodging | |
| MarketCap: 2120 Millions | |
| Recent Price: 18.54 Smart Investing & Trading Score : 74 | |
| Day Percent Change: 3.84% Day Change: 0.68 | |
| Week Change: -0.7% Year-to-date Change: 5.8% | |
| ATAT Links: Profile News Message Board | |
| Charts:- Daily , Weekly | |
| Add ATAT to Watchlist: View: Get Complete ATAT Trend Analysis ➞ | |
 | BGNE BeiGene, Ltd. |
| Sector: Health Care | |
| SubSector: Biotechnology | |
| MarketCap: 10838.5 Millions | |
| Recent Price: 162.01 Smart Investing & Trading Score : 74 | |
| Day Percent Change: 3.50% Day Change: 5.48 | |
| Week Change: 5.49% Year-to-date Change: -10.2% | |
| BGNE Links: Profile News Message Board | |
| Charts:- Daily , Weekly | |
| Add BGNE to Watchlist: View: Get Complete BGNE Trend Analysis ➞ | |
 | ABEV Ambev S.A. |
| Sector: Consumer Staples | |
| SubSector: Beverages - Brewers | |
| MarketCap: 37753.5 Millions | |
| Recent Price: 2.41 Smart Investing & Trading Score : 74 | |
| Day Percent Change: 2.99% Day Change: 0.07 | |
| Week Change: 3.43% Year-to-date Change: -13.9% | |
| ABEV Links: Profile News Message Board | |
| Charts:- Daily , Weekly | |
| Add ABEV to Watchlist: View: Get Complete ABEV Trend Analysis ➞ | |
 | JKS JinkoSolar Holding Co., Ltd. |
| Sector: Technology | |
| SubSector: Semiconductor - Specialized | |
| MarketCap: 629.36 Millions | |
| Recent Price: 25.53 Smart Investing & Trading Score : 74 | |
| Day Percent Change: 1.63% Day Change: 0.41 | |
| Week Change: 5.76% Year-to-date Change: -30.9% | |
| JKS Links: Profile News Message Board | |
| Charts:- Daily , Weekly | |
| Add JKS to Watchlist: View: Get Complete JKS Trend Analysis ➞ | |
 | BEST BEST Inc. |
| Sector: Consumer Staples | |
| SubSector: Packaging & Containers | |
| MarketCap: 1981.73 Millions | |
| Recent Price: 2.13 Smart Investing & Trading Score : 73 | |
| Day Percent Change: 0.95% Day Change: 0.02 | |
| Week Change: 0.95% Year-to-date Change: -16.5% | |
| BEST Links: Profile News Message Board | |
| Charts:- Daily , Weekly | |
| Add BEST to Watchlist: View: Get Complete BEST Trend Analysis ➞ | |
 | SY So-Young International Inc. |
| Sector: Technology | |
| SubSector: Healthcare Information Services | |
| MarketCap: 1000.55 Millions | |
| Recent Price: 1.29 Smart Investing & Trading Score : 73 | |
| Day Percent Change: 0.78% Day Change: 0.01 | |
| Week Change: 2.79% Year-to-date Change: 0.0% | |
| SY Links: Profile News Message Board | |
| Charts:- Daily , Weekly | |
| Add SY to Watchlist: View: Get Complete SY Trend Analysis ➞ | |
 | ERJ Embraer S.A. |
| Sector: Industrials | |
| SubSector: Aerospace/Defense Products & Services | |
| MarketCap: 1623.71 Millions | |
| Recent Price: 25.77 Smart Investing & Trading Score : 70 | |
| Day Percent Change: -0.69% Day Change: -0.18 | |
| Week Change: -0.85% Year-to-date Change: 39.7% | |
| ERJ Links: Profile News Message Board | |
| Charts:- Daily , Weekly | |
| Add ERJ to Watchlist: View: Get Complete ERJ Trend Analysis ➞ | |
 | HKD AMTD Digital Inc. |
| Sector: Technology | |
| SubSector: Software - Application | |
| MarketCap: 1200 Millions | |
| Recent Price: 3.48 Smart Investing & Trading Score : 69 | |
| Day Percent Change: -4.40% Day Change: -0.16 | |
| Week Change: 7.41% Year-to-date Change: -15.7% | |
| HKD Links: Profile News Message Board | |
| Charts:- Daily , Weekly | |
| Add HKD to Watchlist: View: Get Complete HKD Trend Analysis ➞ | |
 | VTMX Vesta Financials Corp SAB de CV |
| Sector: Financials | |
| SubSector: REIT - Industrial | |
| MarketCap: 2270 Millions | |
| Recent Price: 36.12 Smart Investing & Trading Score : 68 | |
| Day Percent Change: 0.33% Day Change: 0.12 | |
| Week Change: -0.25% Year-to-date Change: -9.2% | |
| VTMX Links: Profile News Message Board | |
| Charts:- Daily , Weekly | |
| Add VTMX to Watchlist: View: Get Complete VTMX Trend Analysis ➞ | |
 | SDA SunCar Technology Group Inc. |
| Sector: Services & Goods | |
| SubSector: Auto & Truck Dealerships | |
| MarketCap: 2680 Millions | |
| Recent Price: 7.59 Smart Investing & Trading Score : 68 | |
| Day Percent Change: -1.88% Day Change: -0.15 | |
| Week Change: 4.48% Year-to-date Change: -2.4% | |
| SDA Links: Profile News Message Board | |
| Charts:- Daily , Weekly | |
| Add SDA to Watchlist: View: Get Complete SDA Trend Analysis ➞ | |
 | VALE Vale S.A. |
| Sector: Materials | |
| SubSector: Industrial Metals & Minerals | |
| MarketCap: 43601 Millions | |
| Recent Price: 12.52 Smart Investing & Trading Score : 67 | |
| Day Percent Change: 2.62% Day Change: 0.32 | |
| Week Change: 1.95% Year-to-date Change: -21.1% | |
| VALE Links: Profile News Message Board | |
| Charts:- Daily , Weekly | |
| Add VALE to Watchlist: View: Get Complete VALE Trend Analysis ➞ | |
| For tabular summary view of above stock list: Summary View ➞ 0 - 25 , 25 - 50 , 50 - 75 , 75 - 100 , 100 - 125 , 125 - 150 , 150 - 175 , 175 - 200 | ||
| Click To Change The Sort Order: By Market Cap or Company Size Performance: Year-to-date, Week and Day | |
| Select Chart Type: | ||
|
Best Stocks Today 12Stocks.com |
© 2024 12Stocks.com Terms & Conditions Privacy Contact Us
All Information Provided Only For Education And Not To Be Used For Investing or Trading. See Terms & Conditions


One More Thing ... Get Best Stocks Delivered Daily!
Never Ever Miss A Move With Our Top Ten Stocks Lists
Find Best Stocks In Any Market - Bull or Bear Market
Take A Peek At Our Top Ten Stocks Lists: Daily, Weekly, Year-to-Date & Top Trends
Find Best Stocks In Any Market - Bull or Bear Market
Take A Peek At Our Top Ten Stocks Lists: Daily, Weekly, Year-to-Date & Top Trends
Emerging Markets Stocks With Best Up Trends [0-bearish to 100-bullish]: Bilibili [100], KE [100], JD.com [100], 21Vianet [100], Boqii Holding[100], MINISO [100], Smart Share[100], Weibo [100], Noah [100], Baidu [100], 360 Finance[100]
Best Emerging Markets Stocks Year-to-Date:
U Power[2974.78%], DouYu [856.84%], MicroCloud Hologram[635.25%], China Liberal[487.25%], Yatsen Holding[475.45%], Zhongchao [380.69%], Uxin [176.75%], QuantaSing [101.23%], GigaCloud [89.46%], Yiren Digital[74.68%], Cheetah Mobile[74.56%] Best Emerging Markets Stocks This Week:
Smart Share[39.89%], NIO [24.5%], Huize Holding[22.7%], Regencell Bioscience[21.31%], 21Vianet [20.89%], XPeng [19.9%], Dingdong (Cayman)[17.86%], Li Auto[15.73%], Golden Heaven[15.1%], Viomi [14.43%], GDS [14.05%] Best Emerging Markets Stocks Daily:
Regencell Bioscience[23.15%], XPeng [15.76%], Bilibili [15.63%], Huize Holding[13.70%], KE [12.64%], Kingsoft Cloud[11.86%], JD.com [11.51%], Pinduoduo [10.48%], Li Auto[9.98%], 21Vianet [9.77%], Boqii Holding[9.43%]