
 Login Sign Up


| |||||
 |  | ||||

| 12Stocks.com Market Intelligence |
Best Emerging Markets Stocks
| In a hurry? Emerging Markets Stocks Lists: Trends Table, Stock Charts
Sort Emerging Markets stocks: Daily, Weekly, Year-to-Date, Market Cap & Trends. Filter Emerging Markets stocks list by sector: Show all, Tech, Finance, Energy, Staples, Retail, Industrial, Materials, Utilities and HealthCare Filter Emerging Markets stocks list by size:All Large Medium Small |
| 12Stocks.com Emerging Markets Stocks Performances & Trends Daily | |||||||||
|
|  The overall Smart Investing & Trading Score is 100 (0-bearish to 100-bullish) which puts Emerging Markets index in short term bullish trend. The Smart Investing & Trading Score from previous trading session is 78 and hence an improvement of trend.
| ||||||||
Here are the Smart Investing & Trading Scores of the most requested Emerging Markets stocks at 12Stocks.com (click stock name for detailed review):
|


| 12Stocks.com: Top Performing Emerging Markets Index Stocks | ||||||||||||||||||||||||||||||||||||||||||||||||
 The top performing Emerging Markets Index stocks year to date are
Now, more recently, over last week, the top performing Emerging Markets Index stocks on the move are


|
||||||||||||||||||||||||||||||||||||||||||||||||
| 12Stocks.com: Investing in Emerging Markets Index with Stocks | |
|
The following table helps investors and traders sort through current performance and trends (as measured by Smart Investing & Trading Score ) of various
stocks in the Emerging Markets Index. Quick View: Move mouse or cursor over stock symbol (ticker) to view short-term technical chart and over stock name to view long term chart. Click on  to add stock symbol to your watchlist and to add stock symbol to your watchlist and  to view watchlist. Click on any ticker or stock name for detailed market intelligence report for that stock. to view watchlist. Click on any ticker or stock name for detailed market intelligence report for that stock. |
12Stocks.com Performance of Stocks in Emerging Markets Index
| Ticker | Stock Name | Watchlist | Category | Recent Price | Smart Investing & Trading Score | Change % | YTD Change% |
| VNET | 21Vianet |   | Technology | 1.91 | 100 | 9.77% | -33.45% |
| BQ | Boqii Holding | | Services & Goods | 0.33 | 100 | 9.43% | -28.26% |
| MNSO | MINISO | | Services & Goods | 24.20 | 100 | 9.01% | 18.63% |
| EM | Smart Share | | Services & Goods | 0.87 | 100 | 8.63% | 68.74% |
| WB | | Technology | 9.29 | 100 | 8.28% | -15.16% | |
| NOAH | Noah | | Financials | 13.09 | 100 | 7.83% | -5.21% |
| BIDU | Baidu | | Technology | 111.75 | 100 | 7.12% | -6.16% |
| QFIN | 360 Finance | | Financials | 19.88 | 100 | 7.05% | 25.66% |
| DADA | Dada Nexus | | Services & Goods | 2.16 | 100 | 6.93% | -34.94% |
| CIG | Companhia Energetica | | Utilities | 2.59 | 100 | 6.58% | 11.64% |
| BABA | Alibaba | | Services & Goods | 80.33 | 100 | 6.38% | 3.64% |
| TME | Tencent Music | | Technology | 13.05 | 100 | 5.33% | 44.84% |
| GDS | GDS | | Technology | 8.85 | 100 | 5.11% | -2.96% |
| HSAI | Hesai | | Services & Goods | 4.90 | 100 | 4.93% | -46.04% |
| NIU | Niu | | Consumer Staples | 2.38 | 100 | 4.39% | 8.68% |
| HCM | Hutchison China | | Health Care | 19.56 | 100 | 4.26% | 8.01% |
| YMM | Full Truck | | Technology | 8.88 | 100 | 4.16% | 27.02% |
| ZTO | ZTO Express | | Transports | 21.62 | 100 | 2.61% | 1.60% |
| RERE | ATRenew | | Services & Goods | 2.12 | 100 | 2.17% | 11.90% |
| BILI | Bilibili | | Technology | 14.72 | 100 | 15.63% | 20.95% |
| BEKE | KE | | Financials | 16.84 | 100 | 12.64% | 3.89% |
| JD | JD.com | | Technology | 32.64 | 100 | 11.51% | 12.98% |
| HDB | HDFC Bank | | Financials | 58.87 | 100 | 1.26% | -12.28% |
| BZUN | Baozun | | Services & Goods | 2.86 | 95 | 5.93% | 4.38% |
| DOYU | DouYu | | Technology | 9.09 | 95 | 5.70% | 856.84% |
| For chart view version of above stock list: Chart View ➞ 0 - 25 , 25 - 50 , 50 - 75 , 75 - 100 , 100 - 125 , 125 - 150 , 150 - 175 , 175 - 200 | ||
 | Click To Change The Sort Order: By Market Cap or Company Size Performance: Year-to-date, Week and Day |  |
|
Get the most comprehensive stock market coverage daily at 12Stocks.com ➞ Best Stocks Today ➞ Best Stocks Weekly ➞ Best Stocks Year-to-Date ➞ Best Stocks Trends ➞  Best Stocks Today 12Stocks.com Best Nasdaq Stocks ➞ Best S&P 500 Stocks ➞ Best Tech Stocks ➞ Best Biotech Stocks ➞ |
| Detailed Overview of Emerging Markets Stocks |
| Emerging Markets Technical Overview, Leaders & Laggards, Top Emerging Markets ETF Funds & Detailed Emerging Markets Stocks List, Charts, Trends & More |
| Emerging Markets: Technical Analysis, Trends & YTD Performance | |
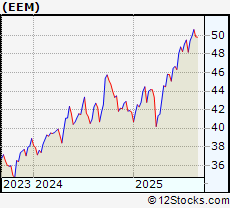
 EEM Weekly Chart |
|
| Long Term Trend: Very Good | |
| Medium Term Trend: Very Good | |
 EEM Daily Chart |
|
| Short Term Trend: Very Good | |
| Overall Trend Score: 100 | |
| YTD Performance: 4.68% | |
| **Trend Scores & Views Are Only For Educational Purposes And Not For Investing | |
| 12Stocks.com: Investing in Emerging Markets Index using Exchange Traded Funds | |
|
The following table shows list of key exchange traded funds (ETF) that
help investors play Emerging Markets stock market. For detailed view, check out our ETF Funds section of our website. Quick View: Move mouse or cursor over ETF symbol (ticker) to view short-term technical chart and over ETF name to view long term chart. Click on ticker or stock name for detailed view. Click on to add stock symbol to your watchlist and to view watchlist. |
12Stocks.com List of ETFs that track Emerging Markets Index
| Ticker | ETF Name | Watchlist | Recent Price | Smart Investing & Trading Score | Change % | Week % | Year-to-date % |
| EEM | Emerging Markets | | 42.09 | 100 | 2.58 | 2.23 | 4.68% |
| VWO | Emerging Markets | | 43.25 | 100 | 2.44 | 2.2 | 5.23% |
| SCHE | Emerging Markets Equity | | 26.16 | 100 | 2.59 | 2.31 | 5.53% |
| EWX | Emerging Markets Small | | 57.90 | 100 | 1.74 | 2.24 | 2.55% |
| EET | Emerging Markets | | 53.45 | 100 | 5.05 | 4.32 | 5.09% |
| EDC | Emrg Mkts Bull | | 31.95 | 100 | 7.48 | 6.46 | 5% |
| EEV | Short Emerging | | 18.17 | 0 | -5.36 | -5.48 | -7.87% |
| EUM | Short Emerging | | 13.68 | 0 | -2.56 | -2.18 | -3.32% |
| EDIV | Emerging Markets Dividend | | 34.42 | 95 | 1.62 | 2.41 | 5.84% |
| EMIF | Emerging Markets Infrastructure | | 22.05 | 66 | 0.00 | -0.32 | 3.03% |
| CEW | Emerging Currency Strat | | 17.78 | 62 | 0.48 | 0.57 | -1.24% |
| EBND | Em Mkts Lcl | | 20.05 | 35 | 0.96 | 0.5 | -5.6% |
| EMCB | Emerging Markets Corp | | 63.96 | 55 | 0.47 | 0.38 | 0.09% |
| VWOB | Emerging Mkts Govt | | 62.56 | 45 | 0.76 | 0.26 | -1.87% |
| EEMA | Emerging Markets Asia | | 70.34 | 100 | 2.99 | 2.31 | 6.4% |
| EELV | Em Mkts Low | | 23.94 | 87 | 1.92 | 2.26 | -0.42% |
| DVYE | Emerging Markets Dividend | | 27.64 | 100 | 1.92 | 2.48 | 4.34% |
| SDEM | SuperDividend Em Mkts | | 25.99 | 70 | 1.39 | 1.84 | 4.81% |
| DBEM | Em Mkts Hdgd | | 24.36 | 100 | 1.68 | 1.68 | 5.6% |
| PCY | Emerging Markets Sov | | 19.89 | 27 | 0.91 | 0.76 | -3.54% |
| QEMM | Emerging Mkts StratcFacts | | 58.41 | 100 | 1.93 | 1.87 | 2.2% |
| 12Stocks.com: Charts, Trends, Fundamental Data and Performances of Emerging Markets Stocks | |
|
We now take in-depth look at all Emerging Markets stocks including charts, multi-period performances and overall trends (as measured by Smart Investing & Trading Score ). One can sort Emerging Markets stocks (click link to choose) by Daily, Weekly and by Year-to-Date performances. Also, one can sort by size of the company or by market capitalization. |
| Select Your Default Chart Type: | |||||
| |||||
| Click on stock symbol or name for detailed view. Click on to add stock symbol to your watchlist and to view watchlist. Quick View: Move mouse or cursor over "Daily" to quickly view daily technical stock chart and over "Weekly" to view weekly technical stock chart. | |||||

 | VNET 21Vianet Group, Inc. |
| Sector: Technology | |
| SubSector: Information Technology Services | |
| MarketCap: 1846.98 Millions | |
| Recent Price: 1.91 Smart Investing & Trading Score : 100 | |
| Day Percent Change: 9.77% Day Change: 0.17 | |
| Week Change: 20.89% Year-to-date Change: -33.5% | |
| VNET Links: Profile News Message Board | |
| Charts:- Daily , Weekly | |
| Add VNET to Watchlist: View: Get Complete VNET Trend Analysis ➞ | |
 | BQ Boqii Holding Limited |
| Sector: Services & Goods | |
| SubSector: Specialty Retail | |
| MarketCap: 33027 Millions | |
| Recent Price: 0.33 Smart Investing & Trading Score : 100 | |
| Day Percent Change: 9.43% Day Change: 0.03 | |
| Week Change: 7.26% Year-to-date Change: -28.3% | |
| BQ Links: Profile News Message Board | |
| Charts:- Daily , Weekly | |
| Add BQ to Watchlist: View: Get Complete BQ Trend Analysis ➞ | |
 | MNSO MINISO Group Holding Limited |
| Sector: Services & Goods | |
| SubSector: Specialty Retail | |
| MarketCap: 69427 Millions | |
| Recent Price: 24.20 Smart Investing & Trading Score : 100 | |
| Day Percent Change: 9.01% Day Change: 2.00 | |
| Week Change: 2.41% Year-to-date Change: 18.6% | |
| MNSO Links: Profile News Message Board | |
| Charts:- Daily , Weekly | |
| Add MNSO to Watchlist: View: Get Complete MNSO Trend Analysis ➞ | |
 | EM Smart Share Global Limited |
| Sector: Services & Goods | |
| SubSector: Personal Services | |
| MarketCap: 238 Millions | |
| Recent Price: 0.87 Smart Investing & Trading Score : 100 | |
| Day Percent Change: 8.63% Day Change: 0.07 | |
| Week Change: 39.89% Year-to-date Change: 68.7% | |
| EM Links: Profile News Message Board | |
| Charts:- Daily , Weekly | |
| Add EM to Watchlist: View: Get Complete EM Trend Analysis ➞ | |
 | WB Weibo Corporation |
| Sector: Technology | |
| SubSector: Internet Information Providers | |
| MarketCap: 8164.6 Millions | |
| Recent Price: 9.29 Smart Investing & Trading Score : 100 | |
| Day Percent Change: 8.28% Day Change: 0.71 | |
| Week Change: 5.57% Year-to-date Change: -15.2% | |
| WB Links: Profile News Message Board | |
| Charts:- Daily , Weekly | |
| Add WB to Watchlist: View: Get Complete WB Trend Analysis ➞ | |
 | NOAH Noah Holdings Limited |
| Sector: Financials | |
| SubSector: Asset Management | |
| MarketCap: 1495.33 Millions | |
| Recent Price: 13.09 Smart Investing & Trading Score : 100 | |
| Day Percent Change: 7.83% Day Change: 0.95 | |
| Week Change: 2.91% Year-to-date Change: -5.2% | |
| NOAH Links: Profile News Message Board | |
| Charts:- Daily , Weekly | |
| Add NOAH to Watchlist: View: Get Complete NOAH Trend Analysis ➞ | |
 | BIDU Baidu, Inc. |
| Sector: Technology | |
| SubSector: Internet Information Providers | |
| MarketCap: 33525.9 Millions | |
| Recent Price: 111.75 Smart Investing & Trading Score : 100 | |
| Day Percent Change: 7.12% Day Change: 7.43 | |
| Week Change: 11.17% Year-to-date Change: -6.2% | |
| BIDU Links: Profile News Message Board | |
| Charts:- Daily , Weekly | |
| Add BIDU to Watchlist: View: Get Complete BIDU Trend Analysis ➞ | |
 | QFIN 360 Finance, Inc. |
| Sector: Financials | |
| SubSector: Credit Services | |
| MarketCap: 956.208 Millions | |
| Recent Price: 19.88 Smart Investing & Trading Score : 100 | |
| Day Percent Change: 7.05% Day Change: 1.31 | |
| Week Change: 7.34% Year-to-date Change: 25.7% | |
| QFIN Links: Profile News Message Board | |
| Charts:- Daily , Weekly | |
| Add QFIN to Watchlist: View: Get Complete QFIN Trend Analysis ➞ | |
 | DADA Dada Nexus Limited |
| Sector: Services & Goods | |
| SubSector: Internet Retail | |
| MarketCap: 98527 Millions | |
| Recent Price: 2.16 Smart Investing & Trading Score : 100 | |
| Day Percent Change: 6.93% Day Change: 0.14 | |
| Week Change: 7.46% Year-to-date Change: -34.9% | |
| DADA Links: Profile News Message Board | |
| Charts:- Daily , Weekly | |
| Add DADA to Watchlist: View: Get Complete DADA Trend Analysis ➞ | |
 | CIG Companhia Energetica de Minas Gerais |
| Sector: Utilities | |
| SubSector: Electric Utilities | |
| MarketCap: 3203.54 Millions | |
| Recent Price: 2.59 Smart Investing & Trading Score : 100 | |
| Day Percent Change: 6.58% Day Change: 0.16 | |
| Week Change: 6.58% Year-to-date Change: 11.6% | |
| CIG Links: Profile News Message Board | |
| Charts:- Daily , Weekly | |
| Add CIG to Watchlist: View: Get Complete CIG Trend Analysis ➞ | |
 | BABA Alibaba Group Holding Limited |
| Sector: Services & Goods | |
| SubSector: Specialty Retail, Other | |
| MarketCap: 522666 Millions | |
| Recent Price: 80.33 Smart Investing & Trading Score : 100 | |
| Day Percent Change: 6.38% Day Change: 4.82 | |
| Week Change: 6.33% Year-to-date Change: 3.6% | |
| BABA Links: Profile News Message Board | |
| Charts:- Daily , Weekly | |
| Add BABA to Watchlist: View: Get Complete BABA Trend Analysis ➞ | |
 | TME Tencent Music Entertainment Group |
| Sector: Technology | |
| SubSector: Internet Information Providers | |
| MarketCap: 16195 Millions | |
| Recent Price: 13.05 Smart Investing & Trading Score : 100 | |
| Day Percent Change: 5.33% Day Change: 0.66 | |
| Week Change: 1.32% Year-to-date Change: 44.8% | |
| TME Links: Profile News Message Board | |
| Charts:- Daily , Weekly | |
| Add TME to Watchlist: View: Get Complete TME Trend Analysis ➞ | |
 | GDS GDS Holdings Limited |
| Sector: Technology | |
| SubSector: Data Storage Devices | |
| MarketCap: 8597.99 Millions | |
| Recent Price: 8.85 Smart Investing & Trading Score : 100 | |
| Day Percent Change: 5.11% Day Change: 0.43 | |
| Week Change: 14.05% Year-to-date Change: -3.0% | |
| GDS Links: Profile News Message Board | |
| Charts:- Daily , Weekly | |
| Add GDS to Watchlist: View: Get Complete GDS Trend Analysis ➞ | |
 | HSAI Hesai Group |
| Sector: Services & Goods | |
| SubSector: Auto Parts | |
| MarketCap: 1330 Millions | |
| Recent Price: 4.90 Smart Investing & Trading Score : 100 | |
| Day Percent Change: 4.93% Day Change: 0.23 | |
| Week Change: 11.36% Year-to-date Change: -46.0% | |
| HSAI Links: Profile News Message Board | |
| Charts:- Daily , Weekly | |
| Add HSAI to Watchlist: View: Get Complete HSAI Trend Analysis ➞ | |
 | NIU Niu Technologies |
| Sector: Consumer Staples | |
| SubSector: Auto Manufacturers - Major | |
| MarketCap: 543.271 Millions | |
| Recent Price: 2.38 Smart Investing & Trading Score : 100 | |
| Day Percent Change: 4.39% Day Change: 0.10 | |
| Week Change: 5.31% Year-to-date Change: 8.7% | |
| NIU Links: Profile News Message Board | |
| Charts:- Daily , Weekly | |
| Add NIU to Watchlist: View: Get Complete NIU Trend Analysis ➞ | |
 | HCM Hutchison China MediTech Limited |
| Sector: Health Care | |
| SubSector: Drug Manufacturers - Major | |
| MarketCap: 2324.43 Millions | |
| Recent Price: 19.56 Smart Investing & Trading Score : 100 | |
| Day Percent Change: 4.26% Day Change: 0.80 | |
| Week Change: 7.71% Year-to-date Change: 8.0% | |
| HCM Links: Profile News Message Board | |
| Charts:- Daily , Weekly | |
| Add HCM to Watchlist: View: Get Complete HCM Trend Analysis ➞ | |
 | YMM Full Truck Alliance Co. Ltd. |
| Sector: Technology | |
| SubSector: Software - Application | |
| MarketCap: 6960 Millions | |
| Recent Price: 8.88 Smart Investing & Trading Score : 100 | |
| Day Percent Change: 4.16% Day Change: 0.36 | |
| Week Change: 1.31% Year-to-date Change: 27.0% | |
| YMM Links: Profile News Message Board | |
| Charts:- Daily , Weekly | |
| Add YMM to Watchlist: View: Get Complete YMM Trend Analysis ➞ | |
 | ZTO ZTO Express (Cayman) Inc. |
| Sector: Transports | |
| SubSector: Air Delivery & Freight Services | |
| MarketCap: 20507 Millions | |
| Recent Price: 21.62 Smart Investing & Trading Score : 100 | |
| Day Percent Change: 2.61% Day Change: 0.55 | |
| Week Change: 0.05% Year-to-date Change: 1.6% | |
| ZTO Links: Profile News Message Board | |
| Charts:- Daily , Weekly | |
| Add ZTO to Watchlist: View: Get Complete ZTO Trend Analysis ➞ | |
 | RERE ATRenew Inc. |
| Sector: Services & Goods | |
| SubSector: Internet Retail | |
| MarketCap: 672 Millions | |
| Recent Price: 2.12 Smart Investing & Trading Score : 100 | |
| Day Percent Change: 2.17% Day Change: 0.05 | |
| Week Change: 6.82% Year-to-date Change: 11.9% | |
| RERE Links: Profile News Message Board | |
| Charts:- Daily , Weekly | |
| Add RERE to Watchlist: View: Get Complete RERE Trend Analysis ➞ | |
 | BILI Bilibili Inc. |
| Sector: Technology | |
| SubSector: Internet Information Providers | |
| MarketCap: 7043.1 Millions | |
| Recent Price: 14.72 Smart Investing & Trading Score : 100 | |
| Day Percent Change: 15.63% Day Change: 1.99 | |
| Week Change: 12.2% Year-to-date Change: 21.0% | |
| BILI Links: Profile News Message Board | |
| Charts:- Daily , Weekly | |
| Add BILI to Watchlist: View: Get Complete BILI Trend Analysis ➞ | |
 | BEKE KE Holdings Inc. |
| Sector: Financials | |
| SubSector: Real Estate Services | |
| MarketCap: 80167 Millions | |
| Recent Price: 16.84 Smart Investing & Trading Score : 100 | |
| Day Percent Change: 12.64% Day Change: 1.89 | |
| Week Change: 13.55% Year-to-date Change: 3.9% | |
| BEKE Links: Profile News Message Board | |
| Charts:- Daily , Weekly | |
| Add BEKE to Watchlist: View: Get Complete BEKE Trend Analysis ➞ | |
 | JD JD.com, Inc. |
| Sector: Technology | |
| SubSector: Internet Information Providers | |
| MarketCap: 59907.3 Millions | |
| Recent Price: 32.64 Smart Investing & Trading Score : 100 | |
| Day Percent Change: 11.51% Day Change: 3.37 | |
| Week Change: 7.58% Year-to-date Change: 13.0% | |
| JD Links: Profile News Message Board | |
| Charts:- Daily , Weekly | |
| Add JD to Watchlist: View: Get Complete JD Trend Analysis ➞ | |
 | HDB HDFC Bank Limited |
| Sector: Financials | |
| SubSector: Foreign Regional Banks | |
| MarketCap: 29894.1 Millions | |
| Recent Price: 58.87 Smart Investing & Trading Score : 100 | |
| Day Percent Change: 1.26% Day Change: 0.73 | |
| Week Change: 0.91% Year-to-date Change: -12.3% | |
| HDB Links: Profile News Message Board | |
| Charts:- Daily , Weekly | |
| Add HDB to Watchlist: View: Get Complete HDB Trend Analysis ➞ | |
 | BZUN Baozun Inc. |
| Sector: Services & Goods | |
| SubSector: Catalog & Mail Order Houses | |
| MarketCap: 1668.92 Millions | |
| Recent Price: 2.86 Smart Investing & Trading Score : 95 | |
| Day Percent Change: 5.93% Day Change: 0.16 | |
| Week Change: 4% Year-to-date Change: 4.4% | |
| BZUN Links: Profile News Message Board | |
| Charts:- Daily , Weekly | |
| Add BZUN to Watchlist: View: Get Complete BZUN Trend Analysis ➞ | |
 | DOYU DouYu International Holdings Limited |
| Sector: Technology | |
| SubSector: Internet Information Providers | |
| MarketCap: 2483 Millions | |
| Recent Price: 9.09 Smart Investing & Trading Score : 95 | |
| Day Percent Change: 5.70% Day Change: 0.49 | |
| Week Change: 5.94% Year-to-date Change: 856.8% | |
| DOYU Links: Profile News Message Board | |
| Charts:- Daily , Weekly | |
| Add DOYU to Watchlist: View: Get Complete DOYU Trend Analysis ➞ | |
| For tabular summary view of above stock list: Summary View ➞ 0 - 25 , 25 - 50 , 50 - 75 , 75 - 100 , 100 - 125 , 125 - 150 , 150 - 175 , 175 - 200 | ||
| Click To Change The Sort Order: By Market Cap or Company Size Performance: Year-to-date, Week and Day | |
| Select Chart Type: | ||
|
Best Stocks Today 12Stocks.com |
© 2024 12Stocks.com Terms & Conditions Privacy Contact Us
All Information Provided Only For Education And Not To Be Used For Investing or Trading. See Terms & Conditions


One More Thing ... Get Best Stocks Delivered Daily!
Never Ever Miss A Move With Our Top Ten Stocks Lists
Find Best Stocks In Any Market - Bull or Bear Market
Take A Peek At Our Top Ten Stocks Lists: Daily, Weekly, Year-to-Date & Top Trends
Find Best Stocks In Any Market - Bull or Bear Market
Take A Peek At Our Top Ten Stocks Lists: Daily, Weekly, Year-to-Date & Top Trends
Emerging Markets Stocks With Best Up Trends [0-bearish to 100-bullish]: Bilibili [100], KE [100], JD.com [100], 21Vianet [100], Boqii Holding[100], MINISO [100], Smart Share[100], Weibo [100], Noah [100], Baidu [100], 360 Finance[100]
Best Emerging Markets Stocks Year-to-Date:
U Power[2974.78%], DouYu [856.84%], MicroCloud Hologram[635.25%], China Liberal[487.25%], Yatsen Holding[475.45%], Zhongchao [380.69%], Uxin [176.75%], QuantaSing [101.23%], GigaCloud [89.46%], Yiren Digital[74.68%], Cheetah Mobile[74.56%] Best Emerging Markets Stocks This Week:
Smart Share[39.89%], NIO [24.5%], Huize Holding[22.7%], Regencell Bioscience[21.31%], 21Vianet [20.89%], XPeng [19.9%], Dingdong (Cayman)[17.86%], Li Auto[15.73%], Golden Heaven[15.1%], Viomi [14.43%], GDS [14.05%] Best Emerging Markets Stocks Daily:
Regencell Bioscience[23.15%], XPeng [15.76%], Bilibili [15.63%], Huize Holding[13.70%], KE [12.64%], Kingsoft Cloud[11.86%], JD.com [11.51%], Pinduoduo [10.48%], Li Auto[9.98%], 21Vianet [9.77%], Boqii Holding[9.43%]