
 Login Sign Up


| |||||
 |  | ||||

| 12Stocks.com Market Intelligence |
Best Emerging Markets Stocks
| In a hurry? Emerging Markets Stocks Lists: Trends Table, Stock Charts
Sort Emerging Markets stocks: Daily, Weekly, Year-to-Date, Market Cap & Trends. Filter Emerging Markets stocks list by sector: Show all, Tech, Finance, Energy, Staples, Retail, Industrial, Materials, Utilities and HealthCare Filter Emerging Markets stocks list by size:All Large Medium Small |
| 12Stocks.com Emerging Markets Stocks Performances & Trends Daily | |||||||||
|
|  The overall Smart Investing & Trading Score is 73 (0-bearish to 100-bullish) which puts Emerging Markets index in short term neutral to bullish trend. The Smart Investing & Trading Score from previous trading session is 78 and hence a deterioration of trend.
| ||||||||
| Here are the Smart Investing & Trading Scores of the most requested Emerging Markets stocks at 12Stocks.com (click stock name for detailed review): |
| 12Stocks.com: Top Performing Emerging Markets Index Stocks | ||||||||||||||||||||||||||||||||
 The top performing Emerging Markets Index stocks year to date are
Now, more recently, over last week, the top performing Emerging Markets Index stocks on the move are


|
||||||||||||||||||||||||||||||||
| 12Stocks.com: Investing in Emerging Markets Index with Stocks | |
|
The following table helps investors and traders sort through current performance and trends (as measured by Smart Investing & Trading Score ) of various
stocks in the Emerging Markets Index. Quick View: Move mouse or cursor over stock symbol (ticker) to view short-term technical chart and over stock name to view long term chart. Click on  to add stock symbol to your watchlist and to add stock symbol to your watchlist and  to view watchlist. Click on any ticker or stock name for detailed market intelligence report for that stock. to view watchlist. Click on any ticker or stock name for detailed market intelligence report for that stock. |
12Stocks.com Performance of Stocks in Emerging Markets Index
| Ticker | Stock Name | Watchlist | Category | Recent Price | Smart Investing & Trading Score | Change % | YTD Change% |
| STNE | StoneCo |   | Technology | 15.47 | 58 | -3.43% | 94.10% |
| WNS | WNS () | | Services & Goods | 74.70 | 76 | -0.19% | 57.63% |
| XP | XP | | Financials | 18.26 | 36 | -1.88% | 54.09% |
| PAGS | PagSeguro Digital | | Financials | 8.69 | 5 | -3.98% | 38.82% |
| NU | Nu | | Financials | 12.83 | 41 | -1.53% | 23.84% |
| GCT | GigaCloud | | Technology | 20.76 | 85 | -2.21% | 12.10% |
| PDD | Pinduoduo | | Services & Goods | 104.91 | 62 | -0.06% | 8.17% |
| RC | Ready Capital | | Financials | 4.44 | 22 | -3.27% | -33.22% |
| For chart view version of above stock list: Chart View ➞ 0 - 25 | ||
 | Click To Change The Sort Order: By Market Cap or Company Size Performance: Year-to-date, Week and Day |  |
|
Get the most comprehensive stock market coverage daily at 12Stocks.com ➞ Best Stocks Today ➞ Best Stocks Weekly ➞ Best Stocks Year-to-Date ➞ Best Stocks Trends ➞  Best Stocks Today 12Stocks.com Best Nasdaq Stocks ➞ Best S&P 500 Stocks ➞ Best Tech Stocks ➞ Best Biotech Stocks ➞ |
| Detailed Overview of Emerging Markets Stocks |
| Emerging Markets Technical Overview, Leaders & Laggards, Top Emerging Markets ETF Funds & Detailed Emerging Markets Stocks List, Charts, Trends & More |
| Emerging Markets: Technical Analysis, Trends & YTD Performance | |
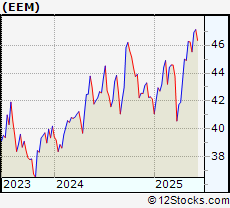
 EEM Weekly Chart |
|
| Long Term Trend: Very Good | |
| Medium Term Trend: Good | |
 EEM Daily Chart |
|
| Short Term Trend: Not Good | |
| Overall Trend Score: 73 | |
| YTD Performance: 15.4% | |
| **Trend Scores & Views Are Only For Educational Purposes And Not For Investing | |
| 12Stocks.com: Investing in Emerging Markets Index using Exchange Traded Funds | |
|
The following table shows list of key exchange traded funds (ETF) that
help investors play Emerging Markets stock market. For detailed view, check out our ETF Funds section of our website. Quick View: Move mouse or cursor over ETF symbol (ticker) to view short-term technical chart and over ETF name to view long term chart. Click on ticker or stock name for detailed view. Click on to add stock symbol to your watchlist and to view watchlist. |
12Stocks.com List of ETFs that track Emerging Markets Index
| Ticker | ETF Name | Watchlist | Recent Price | Smart Investing & Trading Score | Change % | Week % | Year-to-date % |
| EEM | Emerging Markets | | 48.26 | 73 | -0.33 | -1.03 | 15.4% |
| VWO | Emerging Markets | | 49.59 | 73 | -0.14 | -0.86 | 12.72% |
| EET | Emerging Markets | | 63.91 | 66 | -0.77 | -2.17 | 27.27% |
| EDC | Emrg Mkts Bull | | 39.06 | 63 | -0.96 | -3.22 | 37.55% |
| EUM | Short Emerging | | 23.10 | 42 | 0.65 | 1.32 | -13.57% |
| 12Stocks.com: Charts, Trends, Fundamental Data and Performances of Emerging Markets Stocks | |
|
We now take in-depth look at all Emerging Markets stocks including charts, multi-period performances and overall trends (as measured by Smart Investing & Trading Score ). One can sort Emerging Markets stocks (click link to choose) by Daily, Weekly and by Year-to-Date performances. Also, one can sort by size of the company or by market capitalization. |
| Select Your Default Chart Type: | |||||
| |||||
| Click on stock symbol or name for detailed view. Click on to add stock symbol to your watchlist and to view watchlist. Quick View: Move mouse or cursor over "Daily" to quickly view daily technical stock chart and over "Weekly" to view weekly technical stock chart. | |||||

 | STNE StoneCo Ltd. |
| Sector: Technology | |
| SubSector: Application Software | |
| MarketCap: 7347.82 Millions | |
| Recent Price: 15.47 Smart Investing & Trading Score : 58 | |
| Day Percent Change: -3.43% Day Change: -0.55 | |
| Week Change: -4.39% Year-to-date Change: 94.1% | |
| STNE Links: Profile News Message Board | |
| Charts:- Daily , Weekly | |
| Add STNE to Watchlist: View: Get Complete STNE Trend Analysis ➞ | |
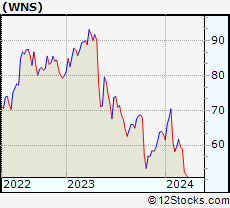 | WNS WNS (Holdings) Limited |
| Sector: Services & Goods | |
| SubSector: Business Services | |
| MarketCap: 2410.72 Millions | |
| Recent Price: 74.70 Smart Investing & Trading Score : 76 | |
| Day Percent Change: -0.19% Day Change: -0.14 | |
| Week Change: 14.26% Year-to-date Change: 57.6% | |
| WNS Links: Profile News Message Board | |
| Charts:- Daily , Weekly | |
| Add WNS to Watchlist: View: Get Complete WNS Trend Analysis ➞ | |
 | XP XP Inc. |
| Sector: Financials | |
| SubSector: Asset Management | |
| MarketCap: 12990.3 Millions | |
| Recent Price: 18.26 Smart Investing & Trading Score : 36 | |
| Day Percent Change: -1.88% Day Change: -0.35 | |
| Week Change: -7.78% Year-to-date Change: 54.1% | |
| XP Links: Profile News Message Board | |
| Charts:- Daily , Weekly | |
| Add XP to Watchlist: View: Get Complete XP Trend Analysis ➞ | |
 | PAGS PagSeguro Digital Ltd. |
| Sector: Financials | |
| SubSector: Credit Services | |
| MarketCap: 6500.78 Millions | |
| Recent Price: 8.69 Smart Investing & Trading Score : 5 | |
| Day Percent Change: -3.98% Day Change: -0.36 | |
| Week Change: -7.65% Year-to-date Change: 38.8% | |
| PAGS Links: Profile News Message Board | |
| Charts:- Daily , Weekly | |
| Add PAGS to Watchlist: View: Get Complete PAGS Trend Analysis ➞ | |
 | NU Nu Holdings Ltd. |
| Sector: Financials | |
| SubSector: Banks - Diversified | |
| MarketCap: 37240 Millions | |
| Recent Price: 12.83 Smart Investing & Trading Score : 41 | |
| Day Percent Change: -1.53% Day Change: -0.2 | |
| Week Change: -5.66% Year-to-date Change: 23.8% | |
| NU Links: Profile News Message Board | |
| Charts:- Daily , Weekly | |
| Add NU to Watchlist: View: Get Complete NU Trend Analysis ➞ | |
 | GCT GigaCloud Technology Inc. |
| Sector: Technology | |
| SubSector: Software - Infrastructure | |
| MarketCap: 240 Millions | |
| Recent Price: 20.76 Smart Investing & Trading Score : 85 | |
| Day Percent Change: -2.21% Day Change: -0.47 | |
| Week Change: 0.97% Year-to-date Change: 12.1% | |
| GCT Links: Profile News Message Board | |
| Charts:- Daily , Weekly | |
| Add GCT to Watchlist: View: Get Complete GCT Trend Analysis ➞ | |
 | PDD Pinduoduo Inc. |
| Sector: Services & Goods | |
| SubSector: Specialty Retail, Other | |
| MarketCap: 41696.2 Millions | |
| Recent Price: 104.91 Smart Investing & Trading Score : 62 | |
| Day Percent Change: -0.06% Day Change: -0.06 | |
| Week Change: 1.27% Year-to-date Change: 8.2% | |
| PDD Links: Profile News Message Board | |
| Charts:- Daily , Weekly | |
| Add PDD to Watchlist: View: Get Complete PDD Trend Analysis ➞ | |
 | RC Ready Capital Corporation |
| Sector: Financials | |
| SubSector: Mortgage Investment | |
| MarketCap: 358.039 Millions | |
| Recent Price: 4.44 Smart Investing & Trading Score : 22 | |
| Day Percent Change: -3.27% Day Change: -0.15 | |
| Week Change: -4.72% Year-to-date Change: -33.2% | |
| RC Links: Profile News Message Board | |
| Charts:- Daily , Weekly | |
| Add RC to Watchlist: View: Get Complete RC Trend Analysis ➞ | |
| For tabular summary view of above stock list: Summary View ➞ 0 - 25 | ||
| Click To Change The Sort Order: By Market Cap or Company Size Performance: Year-to-date, Week and Day | |
| Select Chart Type: | ||
|
Best Stocks Today 12Stocks.com |
© 2025 12Stocks.com Terms & Conditions Privacy Contact Us
All Information Provided Only For Education And Not To Be Used For Investing or Trading. See Terms & Conditions


One More Thing ... Get Best Stocks Delivered Daily!
Never Ever Miss A Move With Our Top Ten Stocks Lists
Find Best Stocks In Any Market - Bull or Bear Market
Take A Peek At Our Top Ten Stocks Lists: Daily, Weekly, Year-to-Date & Top Trends
Find Best Stocks In Any Market - Bull or Bear Market
Take A Peek At Our Top Ten Stocks Lists: Daily, Weekly, Year-to-Date & Top Trends
Emerging Markets Stocks With Best Up Trends [0-bearish to 100-bullish]: GigaCloud [85], WNS ()[76], Pinduoduo [62], StoneCo [58], Nu [41], XP [36], Ready Capital[22], PagSeguro Digital[5],
Best Emerging Markets Stocks Year-to-Date:
StoneCo [94.1%], WNS ()[57.63%], XP [54.09%], PagSeguro Digital[38.82%], Nu [23.84%], GigaCloud [12.1%], Pinduoduo [8.17%], Ready Capital[-33.22%], Best Emerging Markets Stocks This Week:
WNS ()[14.26%], Pinduoduo [1.27%], GigaCloud [0.97%], StoneCo [-4.39%], Ready Capital[-4.72%], Nu [-5.66%], PagSeguro Digital[-7.65%], XP [-7.78%], Best Emerging Markets Stocks Daily:
Pinduoduo [-0.06%], WNS ()[-0.19%], Nu [-1.53%], XP [-1.88%], GigaCloud [-2.21%], Ready Capital[-3.27%], StoneCo [-3.43%], PagSeguro Digital[-3.98%],