
 Login Sign Up


| |||||
 |  | ||||

| 12Stocks.com Market Intelligence |
Best Emerging Markets Stocks
| In a hurry? Emerging Markets Stocks Lists: Trends Table, Stock Charts
Sort Emerging Markets stocks: Daily, Weekly, Year-to-Date, Market Cap & Trends. Filter Emerging Markets stocks list by sector: Show all, Tech, Finance, Energy, Staples, Retail, Industrial, Materials, Utilities and HealthCare Filter Emerging Markets stocks list by size:All Large Medium Small |
| 12Stocks.com Emerging Markets Stocks Performances & Trends Daily | |||||||||
|
|  The overall Smart Investing & Trading Score is 100 (0-bearish to 100-bullish) which puts Emerging Markets index in short term bullish trend. The Smart Investing & Trading Score from previous trading session is 100 and an improvement of trend continues.
| ||||||||
Here are the Smart Investing & Trading Scores of the most requested Emerging Markets stocks at 12Stocks.com (click stock name for detailed review):
|


| 12Stocks.com: Top Performing Emerging Markets Index Stocks | |||||||||||||||||||||||||||||||||||||||||||||||
 The top performing Emerging Markets Index stocks year to date are
Now, more recently, over last week, the top performing Emerging Markets Index stocks on the move are


|
|||||||||||||||||||||||||||||||||||||||||||||||
| 12Stocks.com: Investing in Emerging Markets Index with Stocks | |
|
The following table helps investors and traders sort through current performance and trends (as measured by Smart Investing & Trading Score ) of various
stocks in the Emerging Markets Index. Quick View: Move mouse or cursor over stock symbol (ticker) to view short-term technical chart and over stock name to view long term chart. Click on  to add stock symbol to your watchlist and to add stock symbol to your watchlist and  to view watchlist. Click on any ticker or stock name for detailed market intelligence report for that stock. to view watchlist. Click on any ticker or stock name for detailed market intelligence report for that stock. |
12Stocks.com Performance of Stocks in Emerging Markets Index
| Ticker | Stock Name | Watchlist | Category | Recent Price | Smart Investing & Trading Score | Change % | YTD Change% |
| PAGS | PagSeguro Digital |   | Technology | 10.74 | 100 | 10.72% | 72.65% |
| UEPS | Net 1 | | Services & Goods | 5.90 | 100 | 9.46% | 0.00% |
| NIO | NIO | | Services & Goods | 7.02 | 100 | 8.17% | 54.29% |
| BIDU | Baidu | | Technology | 123.79 | 100 | 7.81% | 49.69% |
| VSTA | Vasta Platform | | Consumer Staples | 4.85 | 100 | 7.06% | 115.56% |
| BRFS | BRF S.A. | | Consumer Staples | 4.16 | 100 | 5.58% | 2.21% |
| JD | JD.com | | Services & Goods | 34.71 | 100 | 3.46% | 4.33% |
| WB | Weibo Corp | | Technology | 12.59 | 100 | 2.78% | 51.49% |
| BABA | Alibaba | | Services & Goods | 162.21 | 100 | 2.64% | 92.47% |
| IMOS | Chipmos | | Technology | 18.66 | 100 | 1.86% | 3.51% |
| NTES | NetEase | | Technology | 157.07 | 100 | 1.45% | 82.11% |
| SNP | China | | Energy | 510.10 | 100 | 1.35% | 0.00% |
| SID | Companhia Siderurgica | | Materials | 1.52 | 100 | 1.33% | 7.04% |
| PDD | PDD | | Services & Goods | 129.06 | 100 | 1.31% | 33.20% |
| IBA | Industrias Bachoco | | Consumer Staples | 84.44 | 100 | 1.22% | 0.00% |
| CTRP | Ctrip.com | | Services & Goods | 27.62 | 100 | 1.21% | 0.00% |
| BILI | Bilibili | | Technology | 27.39 | 100 | 1.14% | 59.89% |
| SINA | SINA | | Technology | 79.70 | 100 | 1.07% | 0.00% |
| ATHM | Autohome | | Technology | 29.71 | 100 | 1.02% | 15.29% |
| GGB | Gerdau S.A. | | Materials | 3.14 | 100 | 0.96% | 10.57% |
| ELP | Cia Paranaense | | Utilities | 9.63 | 100 | 0.84% | 66.17% |
| VALE | Vale S.A. | | Materials | 10.91 | 100 | 0.74% | 27.67% |
| HOLI | Hollysys Automation | | Industrials | 31.23 | 100 | 0.71% | 0.00% |
| CPL | CPFL Energia | | Utilities | 157.44 | 100 | 0.70% | 0.00% |
| EBR | Centrais Eletricas | | Utilities | 9.06 | 100 | 0.44% | 61.43% |
| For chart view version of above stock list: Chart View ➞ 0 - 25 , 25 - 50 , 50 - 75 , 75 - 100 , 100 - 125 , 125 - 150 , 150 - 175 , 175 - 200 , 200 - 225 , 225 - 250 , 250 - 275 | ||
 | Click To Change The Sort Order: By Market Cap or Company Size Performance: Year-to-date, Week and Day |  |
|
Get the most comprehensive stock market coverage daily at 12Stocks.com ➞ Best Stocks Today ➞ Best Stocks Weekly ➞ Best Stocks Year-to-Date ➞ Best Stocks Trends ➞  Best Stocks Today 12Stocks.com Best Nasdaq Stocks ➞ Best S&P 500 Stocks ➞ Best Tech Stocks ➞ Best Biotech Stocks ➞ |
| Detailed Overview of Emerging Markets Stocks |
| Emerging Markets Technical Overview, Leaders & Laggards, Top Emerging Markets ETF Funds & Detailed Emerging Markets Stocks List, Charts, Trends & More |
| Emerging Markets: Technical Analysis, Trends & YTD Performance | |
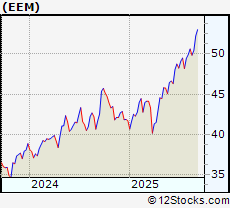
 EEM Weekly Chart |
|
| Long Term Trend: Very Good | |
| Medium Term Trend: Good | |
 EEM Daily Chart |
|
| Short Term Trend: Very Good | |
| Overall Trend Score: 100 | |
| YTD Performance: 28.2178% | |
| **Trend Scores & Views Are Only For Educational Purposes And Not For Investing | |
| 12Stocks.com: Investing in Emerging Markets Index using Exchange Traded Funds | |
|
The following table shows list of key exchange traded funds (ETF) that
help investors play Emerging Markets stock market. For detailed view, check out our ETF Funds section of our website. Quick View: Move mouse or cursor over ETF symbol (ticker) to view short-term technical chart and over ETF name to view long term chart. Click on ticker or stock name for detailed view. Click on to add stock symbol to your watchlist and to view watchlist. |
12Stocks.com List of ETFs that track Emerging Markets Index
| Ticker | ETF Name | Watchlist | Recent Price | Smart Investing & Trading Score | Change % | Week % | Year-to-date % |
| EWEM | Em Mkts Eql | | 95.84 | 70 | -0.457 | 5.08772 | 0% |
| 12Stocks.com: Charts, Trends, Fundamental Data and Performances of Emerging Markets Stocks | |
|
We now take in-depth look at all Emerging Markets stocks including charts, multi-period performances and overall trends (as measured by Smart Investing & Trading Score ). One can sort Emerging Markets stocks (click link to choose) by Daily, Weekly and by Year-to-Date performances. Also, one can sort by size of the company or by market capitalization. |
| Select Your Default Chart Type: | |||||
| |||||
| Click on stock symbol or name for detailed view. Click on to add stock symbol to your watchlist and to view watchlist. Quick View: Move mouse or cursor over "Daily" to quickly view daily technical stock chart and over "Weekly" to view weekly technical stock chart. | |||||

 | PAGS PagSeguro Digital Ltd |
| Sector: Technology | |
| SubSector: Software - Infrastructure | |
| MarketCap: 3164.24 Millions | |
| Recent Price: 10.74 Smart Investing & Trading Score : 100 | |
| Day Percent Change: 10.7216% Day Change: -0.01 | |
| Week Change: 12.8151% Year-to-date Change: 72.7% | |
| PAGS Links: Profile News Message Board | |
| Charts:- Daily , Weekly | |
| Add PAGS to Watchlist: View: Get Complete PAGS Trend Analysis ➞ | |
 | UEPS Net 1 UEPS Technologies, Inc. |
| Sector: Services & Goods | |
| SubSector: Business Services | |
| MarketCap: 176.882 Millions | |
| Recent Price: 5.90 Smart Investing & Trading Score : 100 | |
| Day Percent Change: 9.46197% Day Change: -9999 | |
| Week Change: 11.3208% Year-to-date Change: 0.0% | |
| UEPS Links: Profile News Message Board | |
| Charts:- Daily , Weekly | |
| Add UEPS to Watchlist: View: Get Complete UEPS Trend Analysis ➞ | |
 | NIO NIO Inc ADR |
| Sector: Services & Goods | |
| SubSector: Auto Manufacturers | |
| MarketCap: 11560.9 Millions | |
| Recent Price: 7.02 Smart Investing & Trading Score : 100 | |
| Day Percent Change: 8.16641% Day Change: 0.47 | |
| Week Change: 13.7763% Year-to-date Change: 54.3% | |
| NIO Links: Profile News Message Board | |
| Charts:- Daily , Weekly | |
| Add NIO to Watchlist: View: Get Complete NIO Trend Analysis ➞ | |
 | BIDU Baidu Inc ADR |
| Sector: Technology | |
| SubSector: Internet Content & Information | |
| MarketCap: 28539.6 Millions | |
| Recent Price: 123.79 Smart Investing & Trading Score : 100 | |
| Day Percent Change: 7.81223% Day Change: 9.52 | |
| Week Change: 13.9347% Year-to-date Change: 49.7% | |
| BIDU Links: Profile News Message Board | |
| Charts:- Daily , Weekly | |
| Add BIDU to Watchlist: View: Get Complete BIDU Trend Analysis ➞ | |
 | VSTA Vasta Platform Ltd |
| Sector: Consumer Staples | |
| SubSector: Education & Training Services | |
| MarketCap: 364.12 Millions | |
| Recent Price: 4.85 Smart Investing & Trading Score : 100 | |
| Day Percent Change: 7.06402% Day Change: -0.05 | |
| Week Change: 6.82819% Year-to-date Change: 115.6% | |
| VSTA Links: Profile News Message Board | |
| Charts:- Daily , Weekly | |
| Add VSTA to Watchlist: View: Get Complete VSTA Trend Analysis ➞ | |
 | BRFS BRF S.A. ADR |
| Sector: Consumer Staples | |
| SubSector: Packaged Foods | |
| MarketCap: 5862.22 Millions | |
| Recent Price: 4.16 Smart Investing & Trading Score : 100 | |
| Day Percent Change: 5.58376% Day Change: 0.02 | |
| Week Change: 17.5141% Year-to-date Change: 2.2% | |
| BRFS Links: Profile News Message Board | |
| Charts:- Daily , Weekly | |
| Add BRFS to Watchlist: View: Get Complete BRFS Trend Analysis ➞ | |
 | JD JD.com Inc ADR |
| Sector: Services & Goods | |
| SubSector: Internet Retail | |
| MarketCap: 42508.1 Millions | |
| Recent Price: 34.71 Smart Investing & Trading Score : 100 | |
| Day Percent Change: 3.45753% Day Change: 1.24 | |
| Week Change: 5.6621% Year-to-date Change: 4.3% | |
| JD Links: Profile News Message Board | |
| Charts:- Daily , Weekly | |
| Add JD to Watchlist: View: Get Complete JD Trend Analysis ➞ | |
 | WB Weibo Corp ADR |
| Sector: Technology | |
| SubSector: Internet Content & Information | |
| MarketCap: 1832.03 Millions | |
| Recent Price: 12.59 Smart Investing & Trading Score : 100 | |
| Day Percent Change: 2.77551% Day Change: 0.12 | |
| Week Change: 7.51494% Year-to-date Change: 51.5% | |
| WB Links: Profile News Message Board | |
| Charts:- Daily , Weekly | |
| Add WB to Watchlist: View: Get Complete WB Trend Analysis ➞ | |
 | BABA Alibaba Group Holding Ltd ADR |
| Sector: Services & Goods | |
| SubSector: Internet Retail | |
| MarketCap: 302968 Millions | |
| Recent Price: 162.21 Smart Investing & Trading Score : 100 | |
| Day Percent Change: 2.63857% Day Change: 3.89 | |
| Week Change: 14.8796% Year-to-date Change: 92.5% | |
| BABA Links: Profile News Message Board | |
| Charts:- Daily , Weekly | |
| Add BABA to Watchlist: View: Get Complete BABA Trend Analysis ➞ | |
 | IMOS Chipmos Technologies Inc ADR |
| Sector: Technology | |
| SubSector: Semiconductors | |
| MarketCap: 620.9 Millions | |
| Recent Price: 18.66 Smart Investing & Trading Score : 100 | |
| Day Percent Change: 1.8559% Day Change: 0.09 | |
| Week Change: 4.24581% Year-to-date Change: 3.5% | |
| IMOS Links: Profile News Message Board | |
| Charts:- Daily , Weekly | |
| Add IMOS to Watchlist: View: Get Complete IMOS Trend Analysis ➞ | |
 | NTES NetEase Inc ADR |
| Sector: Technology | |
| SubSector: Electronic Gaming & Multimedia | |
| MarketCap: 85372.9 Millions | |
| Recent Price: 157.07 Smart Investing & Trading Score : 100 | |
| Day Percent Change: 1.44998% Day Change: 2.3 | |
| Week Change: 9.07986% Year-to-date Change: 82.1% | |
| NTES Links: Profile News Message Board | |
| Charts:- Daily , Weekly | |
| Add NTES to Watchlist: View: Get Complete NTES Trend Analysis ➞ | |
 | SNP China Petroleum & Chemical Corporation |
| Sector: Energy | |
| SubSector: Major Integrated Oil & Gas | |
| MarketCap: 74664.2 Millions | |
| Recent Price: 510.10 Smart Investing & Trading Score : 100 | |
| Day Percent Change: 1.34504% Day Change: -9999 | |
| Week Change: 1104.2% Year-to-date Change: 0.0% | |
| SNP Links: Profile News Message Board | |
| Charts:- Daily , Weekly | |
| Add SNP to Watchlist: View: Get Complete SNP Trend Analysis ➞ | |
 | SID Companhia Siderurgica Nacional ADR |
| Sector: Materials | |
| SubSector: Steel | |
| MarketCap: 1936.09 Millions | |
| Recent Price: 1.52 Smart Investing & Trading Score : 100 | |
| Day Percent Change: 1.33333% Day Change: 0.02 | |
| Week Change: 4.10959% Year-to-date Change: 7.0% | |
| SID Links: Profile News Message Board | |
| Charts:- Daily , Weekly | |
| Add SID to Watchlist: View: Get Complete SID Trend Analysis ➞ | |
 | PDD PDD Holdings Inc ADR |
| Sector: Services & Goods | |
| SubSector: Internet Retail | |
| MarketCap: 173152 Millions | |
| Recent Price: 129.06 Smart Investing & Trading Score : 100 | |
| Day Percent Change: 1.31093% Day Change: 2.46 | |
| Week Change: 3.22323% Year-to-date Change: 33.2% | |
| PDD Links: Profile News Message Board | |
| Charts:- Daily , Weekly | |
| Add PDD to Watchlist: View: Get Complete PDD Trend Analysis ➞ | |
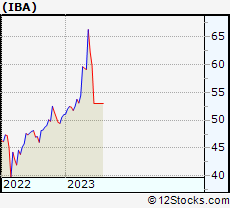 | IBA Industrias Bachoco, S.A.B. de C.V. |
| Sector: Consumer Staples | |
| SubSector: Farm Products | |
| MarketCap: 1547.87 Millions | |
| Recent Price: 84.44 Smart Investing & Trading Score : 100 | |
| Day Percent Change: 1.22273% Day Change: -9999 | |
| Week Change: 59.3208% Year-to-date Change: 0.0% | |
| IBA Links: Profile News Message Board | |
| Charts:- Daily , Weekly | |
| Add IBA to Watchlist: View: Get Complete IBA Trend Analysis ➞ | |
 | CTRP Ctrip.com International, Ltd. |
| Sector: Services & Goods | |
| SubSector: Lodging | |
| MarketCap: 23662.9 Millions | |
| Recent Price: 27.62 Smart Investing & Trading Score : 100 | |
| Day Percent Change: 1.20923% Day Change: -9999 | |
| Week Change: 18.1352% Year-to-date Change: 0.0% | |
| CTRP Links: Profile News Message Board | |
| Charts:- Daily , Weekly | |
| Add CTRP to Watchlist: View: Get Complete CTRP Trend Analysis ➞ | |
 | BILI Bilibili Inc ADR |
| Sector: Technology | |
| SubSector: Internet Content & Information | |
| MarketCap: 7252.55 Millions | |
| Recent Price: 27.39 Smart Investing & Trading Score : 100 | |
| Day Percent Change: 1.14476% Day Change: -1.54 | |
| Week Change: 21.4096% Year-to-date Change: 59.9% | |
| BILI Links: Profile News Message Board | |
| Charts:- Daily , Weekly | |
| Add BILI to Watchlist: View: Get Complete BILI Trend Analysis ➞ | |
 | SINA SINA Corporation |
| Sector: Technology | |
| SubSector: Internet Software & Services | |
| MarketCap: 2168.61 Millions | |
| Recent Price: 79.70 Smart Investing & Trading Score : 100 | |
| Day Percent Change: 1.06518% Day Change: -9999 | |
| Week Change: 64.9762% Year-to-date Change: 0.0% | |
| SINA Links: Profile News Message Board | |
| Charts:- Daily , Weekly | |
| Add SINA to Watchlist: View: Get Complete SINA Trend Analysis ➞ | |
 | ATHM Autohome Inc ADR |
| Sector: Technology | |
| SubSector: Internet Content & Information | |
| MarketCap: 3388.57 Millions | |
| Recent Price: 29.71 Smart Investing & Trading Score : 100 | |
| Day Percent Change: 1.02006% Day Change: 0.28 | |
| Week Change: 3.9902% Year-to-date Change: 15.3% | |
| ATHM Links: Profile News Message Board | |
| Charts:- Daily , Weekly | |
| Add ATHM to Watchlist: View: Get Complete ATHM Trend Analysis ➞ | |
 | GGB Gerdau S.A. ADR |
| Sector: Materials | |
| SubSector: Steel | |
| MarketCap: 4049.82 Millions | |
| Recent Price: 3.14 Smart Investing & Trading Score : 100 | |
| Day Percent Change: 0.96463% Day Change: 0.01 | |
| Week Change: -0.632911% Year-to-date Change: 10.6% | |
| GGB Links: Profile News Message Board | |
| Charts:- Daily , Weekly | |
| Add GGB to Watchlist: View: Get Complete GGB Trend Analysis ➞ | |
 | ELP Cia Paranaense De Energia Copel ADR |
| Sector: Utilities | |
| SubSector: Utilities - Regulated Electric | |
| MarketCap: 3812.16 Millions | |
| Recent Price: 9.63 Smart Investing & Trading Score : 100 | |
| Day Percent Change: 0.837696% Day Change: -0.04 | |
| Week Change: 6.88124% Year-to-date Change: 66.2% | |
| ELP Links: Profile News Message Board | |
| Charts:- Daily , Weekly | |
| Add ELP to Watchlist: View: Get Complete ELP Trend Analysis ➞ | |
 | VALE Vale S.A. ADR |
| Sector: Materials | |
| SubSector: Other Industrial Metals & Mining | |
| MarketCap: 44395.3 Millions | |
| Recent Price: 10.91 Smart Investing & Trading Score : 100 | |
| Day Percent Change: 0.738689% Day Change: 0.09 | |
| Week Change: 4.40191% Year-to-date Change: 27.7% | |
| VALE Links: Profile News Message Board | |
| Charts:- Daily , Weekly | |
| Add VALE to Watchlist: View: Get Complete VALE Trend Analysis ➞ | |
 | HOLI Hollysys Automation Technologies Ltd. |
| Sector: Industrials | |
| SubSector: Industrial Electrical Equipment | |
| MarketCap: 668.379 Millions | |
| Recent Price: 31.23 Smart Investing & Trading Score : 100 | |
| Day Percent Change: 0.709449% Day Change: -9999 | |
| Week Change: 18.3403% Year-to-date Change: 0.0% | |
| HOLI Links: Profile News Message Board | |
| Charts:- Daily , Weekly | |
| Add HOLI to Watchlist: View: Get Complete HOLI Trend Analysis ➞ | |
 | CPL CPFL Energia S.A. |
| Sector: Utilities | |
| SubSector: Foreign Utilities | |
| MarketCap: 8241.06 Millions | |
| Recent Price: 157.44 Smart Investing & Trading Score : 100 | |
| Day Percent Change: 0.697154% Day Change: -9999 | |
| Week Change: 52.5581% Year-to-date Change: 0.0% | |
| CPL Links: Profile News Message Board | |
| Charts:- Daily , Weekly | |
| Add CPL to Watchlist: View: Get Complete CPL Trend Analysis ➞ | |
 | EBR Centrais Eletricas Brasileiras S.A. ADR |
| Sector: Utilities | |
| SubSector: Utilities - Renewable | |
| MarketCap: 16657.1 Millions | |
| Recent Price: 9.06 Smart Investing & Trading Score : 100 | |
| Day Percent Change: 0.443459% Day Change: 0.08 | |
| Week Change: 8.63309% Year-to-date Change: 61.4% | |
| EBR Links: Profile News Message Board | |
| Charts:- Daily , Weekly | |
| Add EBR to Watchlist: View: Get Complete EBR Trend Analysis ➞ | |
| For tabular summary view of above stock list: Summary View ➞ 0 - 25 , 25 - 50 , 50 - 75 , 75 - 100 , 100 - 125 , 125 - 150 , 150 - 175 , 175 - 200 , 200 - 225 , 225 - 250 , 250 - 275 | ||
| Click To Change The Sort Order: By Market Cap or Company Size Performance: Year-to-date, Week and Day | |
| Select Chart Type: | ||
|
Best Stocks Today 12Stocks.com |
© 2025 12Stocks.com Terms & Conditions Privacy Contact Us
All Information Provided Only For Education And Not To Be Used For Investing or Trading. See Terms & Conditions


One More Thing ... Get Best Stocks Delivered Daily!
Never Ever Miss A Move With Our Top Ten Stocks Lists
Find Best Stocks In Any Market - Bull or Bear Market
Take A Peek At Our Top Ten Stocks Lists: Daily, Weekly, Year-to-Date & Top Trends
Find Best Stocks In Any Market - Bull or Bear Market
Take A Peek At Our Top Ten Stocks Lists: Daily, Weekly, Year-to-Date & Top Trends
Emerging Markets Stocks With Best Up Trends [0-bearish to 100-bullish]: PagSeguro Digital[100], Net 1[100], NIO [100], Baidu [100], Vasta Platform[100], BRF S.A.[100], JD.com [100], Weibo Corp[100], Alibaba [100], Chipmos [100], NetEase [100]
Best Emerging Markets Stocks Year-to-Date:
Regencell Bioscience[11185.5%], So-Young [402.018%], Sify [293.464%], QuantaSing [269.91%], Xunlei [248.095%], Oneconnect Financial[196.296%], Gold Fields[177.925%], DRDGold .[162.113%], Yatsen Holding[152.083%], Sibanye Stillwater[148.415%], Masterbeef [139.024%] Best Emerging Markets Stocks This Week:
CNOOC [137266%], Companhia Brasileira[18587.4%], Cosan [16415.2%], Nam Tai[5033.33%], Fang [4150%], Sinopec Shanghai[1992.58%], Grupo Financiero[1283.52%], PetroChina [1137.09%], China [1104.2%], China Life[690.958%], Leju [539.091%] Best Emerging Markets Stocks Daily:
Grupo Simec[12.2572%], PagSeguro Digital[10.7216%], Net 1[9.46197%], NIO [8.16641%], Baidu [7.81223%], Jianpu [7.78054%], Vasta Platform[7.06402%], BRF S.A.[5.58376%], So-Young [5.57029%], Sibanye Gold[5.06135%], Chagee [4.35045%]