
 Login Sign Up


| |||||
 |  | ||||

| 12Stocks.com Market Intelligence |
Best Emerging Markets Stocks
| In a hurry? Emerging Markets Stocks Lists: Trends Table, Stock Charts
Sort Emerging Markets stocks: Daily, Weekly, Year-to-Date, Market Cap & Trends. Filter Emerging Markets stocks list by sector: Show all, Tech, Finance, Energy, Staples, Retail, Industrial, Materials, Utilities and HealthCare Filter Emerging Markets stocks list by size:All Large Medium Small |
| 12Stocks.com Emerging Markets Stocks Performances & Trends Daily | |||||||||
|
|  The overall Smart Investing & Trading Score is 48 (0-bearish to 100-bullish) which puts Emerging Markets index in short term neutral trend. The Smart Investing & Trading Score from previous trading session is 31 and hence an improvement of trend.
| ||||||||
Here are the Smart Investing & Trading Scores of the most requested Emerging Markets stocks at 12Stocks.com (click stock name for detailed review):
|


| 12Stocks.com: Top Performing Emerging Markets Index Stocks | ||||||||||||||||||||||||||||||||||||||||||||||||
 The top performing Emerging Markets Index stocks year to date are
Now, more recently, over last week, the top performing Emerging Markets Index stocks on the move are


|
||||||||||||||||||||||||||||||||||||||||||||||||
| 12Stocks.com: Investing in Emerging Markets Index with Stocks | |
|
The following table helps investors and traders sort through current performance and trends (as measured by Smart Investing & Trading Score ) of various
stocks in the Emerging Markets Index. Quick View: Move mouse or cursor over stock symbol (ticker) to view short-term technical chart and over stock name to view long term chart. Click on  to add stock symbol to your watchlist and to add stock symbol to your watchlist and  to view watchlist. Click on any ticker or stock name for detailed market intelligence report for that stock. to view watchlist. Click on any ticker or stock name for detailed market intelligence report for that stock. |
12Stocks.com Performance of Stocks in Emerging Markets Index
| Ticker | Stock Name | Watchlist | Category | Recent Price | Smart Investing & Trading Score | Change % | YTD Change% |
| EDU | New Oriental |   | Services & Goods | 73.40 | 27 | 4.37 | 0.16% |
| INFY | Infosys | | Technology | 22.79 | 100 | 3.54 | 23.99% |
| BRFS | BRF S.A | | Consumer Staples | 3.83 | 58 | 3.38 | 37.59% |
| TAL | TAL Education | | Services & Goods | 10.74 | 49 | 3.27 | -14.96% |
| WIT | Wipro | | Technology | 6.21 | 68 | 3.16 | 11.49% |
| EBR | Centrais Eletricas | | Utilities | 6.82 | 42 | 2.87 | -20.88% |
| ZTO | ZTO Express | | Transports | 19.17 | 0 | 2.73 | -9.92% |
| YUMC | Yum China | | Services & Goods | 30.01 | 17 | 2.63 | -29.27% |
| BAK | Braskem S.A | | Materials | 6.44 | 22 | 1.90 | -26.98% |
| UGP | Ultrapar Participacoes | | Energy | 4.06 | 17 | 1.75 | -25.09% |
| BSBR | Banco Santander | | Financials | 5.00 | 8 | 1.63 | -23.66% |
| IBN | ICICI Bank | | Financials | 28.76 | 53 | 1.63 | 20.64% |
| SSL | Sasol | | Energy | 7.79 | 60 | 1.56 | -21.63% |
| BABA | Alibaba | | Services & Goods | 76.53 | 86 | 1.50 | -1.26% |
| IMOS | ChipMOS | | Technology | 24.66 | 17 | 1.50 | -9.39% |
| VALE | Vale S.A | | Materials | 10.86 | 25 | 1.50 | -31.53% |
| BIDU | Baidu | | Technology | 88.98 | 18 | 1.36 | -25.28% |
| FMX | Fomento Economico | | Consumer Staples | 109.57 | 15 | 1.20 | -15.94% |
| CHT | Chunghwa Telecom | | Technology | 37.13 | 64 | 1.07 | -4.96% |
| TSM | Taiwan Semiconductor | | Technology | 161.94 | 48 | 1.04 | 55.71% |
| MOMO | Momo | | Technology | 6.80 | 63 | 0.89 | -2.16% |
| JD | JD.com | | Technology | 26.55 | 10 | 0.84 | -8.10% |
| CX | CEMEX S.A.B. | | Industrials | 6.42 | 42 | 0.78 | -17.16% |
| HDB | HDFC Bank | | Financials | 60.62 | 68 | 0.70 | -9.67% |
| VIPS | Vipshop | | Services & Goods | 13.46 | 25 | 0.67 | -24.21% |
| For chart view version of above stock list: Chart View ➞ 0 - 25 , 25 - 50 | ||
 | Click To Change The Sort Order: By Market Cap or Company Size Performance: Year-to-date, Week and Day |  |
|
Get the most comprehensive stock market coverage daily at 12Stocks.com ➞ Best Stocks Today ➞ Best Stocks Weekly ➞ Best Stocks Year-to-Date ➞ Best Stocks Trends ➞  Best Stocks Today 12Stocks.com Best Nasdaq Stocks ➞ Best S&P 500 Stocks ➞ Best Tech Stocks ➞ Best Biotech Stocks ➞ |
| Detailed Overview of Emerging Markets Stocks |
| Emerging Markets Technical Overview, Leaders & Laggards, Top Emerging Markets ETF Funds & Detailed Emerging Markets Stocks List, Charts, Trends & More |
| Emerging Markets: Technical Analysis, Trends & YTD Performance | |
 EEM Weekly Chart |
|
| Long Term Trend: Very Good | |
| Medium Term Trend: Not Good | |
 EEM Daily Chart |
|
| Short Term Trend: Deteriorating | |
| Overall Trend Score: 48 | |
| YTD Performance: 5.35% | |
| **Trend Scores & Views Are Only For Educational Purposes And Not For Investing | |
| 12Stocks.com: Investing in Emerging Markets Index using Exchange Traded Funds | |
|
The following table shows list of key exchange traded funds (ETF) that
help investors play Emerging Markets stock market. For detailed view, check out our ETF Funds section of our website. Quick View: Move mouse or cursor over ETF symbol (ticker) to view short-term technical chart and over ETF name to view long term chart. Click on ticker or stock name for detailed view. Click on to add stock symbol to your watchlist and to view watchlist. |
12Stocks.com List of ETFs that track Emerging Markets Index
| Ticker | ETF Name | Watchlist | Recent Price | Smart Investing & Trading Score | Change % | Week % | Year-to-date % |
| EEM | Emerging Markets | | 42.36 | 48 | 1.03 | -0.89 | 5.35% |
| VWO | Emerging Markets | | 43.73 | 56 | 1.13 | -0.46 | 6.4% |
| EET | Emerging Markets | | 53.31 | 48 | 2.09 | -2.02 | 4.82% |
| EDC | Emrg Mkts Bull | | 31.64 | 43 | 2.93 | -3.06 | 3.98% |
| EUM | Short Emerging | | 13.55 | 62 | -1.02 | 0.97 | -4.24% |
| 12Stocks.com: Charts, Trends, Fundamental Data and Performances of Emerging Markets Stocks | |
|
We now take in-depth look at all Emerging Markets stocks including charts, multi-period performances and overall trends (as measured by Smart Investing & Trading Score ). One can sort Emerging Markets stocks (click link to choose) by Daily, Weekly and by Year-to-Date performances. Also, one can sort by size of the company or by market capitalization. |
| Select Your Default Chart Type: | |||||
| |||||
| Click on stock symbol or name for detailed view. Click on to add stock symbol to your watchlist and to view watchlist. Quick View: Move mouse or cursor over "Daily" to quickly view daily technical stock chart and over "Weekly" to view weekly technical stock chart. | |||||

 | EDU New Oriental Education & Technology Group Inc. |
| Sector: Services & Goods | |
| SubSector: Education & Training Services | |
| MarketCap: 18673.7 Millions | |
| Recent Price: 73.40 Smart Investing & Trading Score : 27 | |
| Day Percent Change: 4.37% Day Change: 3.07 | |
| Week Change: -0.88% Year-to-date Change: 0.2% | |
| EDU Links: Profile News Message Board | |
| Charts:- Daily , Weekly | |
| Add EDU to Watchlist: View: Get Complete EDU Trend Analysis ➞ | |
 | INFY Infosys Limited |
| Sector: Technology | |
| SubSector: Information Technology Services | |
| MarketCap: 33819.1 Millions | |
| Recent Price: 22.79 Smart Investing & Trading Score : 100 | |
| Day Percent Change: 3.54% Day Change: 0.78 | |
| Week Change: 5.12% Year-to-date Change: 24.0% | |
| INFY Links: Profile News Message Board | |
| Charts:- Daily , Weekly | |
| Add INFY to Watchlist: View: Get Complete INFY Trend Analysis ➞ | |
 | BRFS BRF S.A. |
| Sector: Consumer Staples | |
| SubSector: Meat Products | |
| MarketCap: 2635.51 Millions | |
| Recent Price: 3.83 Smart Investing & Trading Score : 58 | |
| Day Percent Change: 3.38% Day Change: 0.13 | |
| Week Change: 2.27% Year-to-date Change: 37.6% | |
| BRFS Links: Profile News Message Board | |
| Charts:- Daily , Weekly | |
| Add BRFS to Watchlist: View: Get Complete BRFS Trend Analysis ➞ | |
 | TAL TAL Education Group |
| Sector: Services & Goods | |
| SubSector: Education & Training Services | |
| MarketCap: 30103.1 Millions | |
| Recent Price: 10.74 Smart Investing & Trading Score : 49 | |
| Day Percent Change: 3.27% Day Change: 0.34 | |
| Week Change: 6.44% Year-to-date Change: -15.0% | |
| TAL Links: Profile News Message Board | |
| Charts:- Daily , Weekly | |
| Add TAL to Watchlist: View: Get Complete TAL Trend Analysis ➞ | |
 | WIT Wipro Limited |
| Sector: Technology | |
| SubSector: Information Technology Services | |
| MarketCap: 15101.3 Millions | |
| Recent Price: 6.21 Smart Investing & Trading Score : 68 | |
| Day Percent Change: 3.16% Day Change: 0.19 | |
| Week Change: 1.97% Year-to-date Change: 11.5% | |
| WIT Links: Profile News Message Board | |
| Charts:- Daily , Weekly | |
| Add WIT to Watchlist: View: Get Complete WIT Trend Analysis ➞ | |
 | EBR Centrais Eletricas Brasileiras S.A. - Eletrobras |
| Sector: Utilities | |
| SubSector: Electric Utilities | |
| MarketCap: 5459.84 Millions | |
| Recent Price: 6.82 Smart Investing & Trading Score : 42 | |
| Day Percent Change: 2.87% Day Change: 0.19 | |
| Week Change: 2.56% Year-to-date Change: -20.9% | |
| EBR Links: Profile News Message Board | |
| Charts:- Daily , Weekly | |
| Add EBR to Watchlist: View: Get Complete EBR Trend Analysis ➞ | |
 | ZTO ZTO Express (Cayman) Inc. |
| Sector: Transports | |
| SubSector: Air Delivery & Freight Services | |
| MarketCap: 20507 Millions | |
| Recent Price: 19.17 Smart Investing & Trading Score : 0 | |
| Day Percent Change: 2.73% Day Change: 0.51 | |
| Week Change: -2.94% Year-to-date Change: -9.9% | |
| ZTO Links: Profile News Message Board | |
| Charts:- Daily , Weekly | |
| Add ZTO to Watchlist: View: Get Complete ZTO Trend Analysis ➞ | |
 | YUMC Yum China Holdings, Inc. |
| Sector: Services & Goods | |
| SubSector: Restaurants | |
| MarketCap: 16284.5 Millions | |
| Recent Price: 30.01 Smart Investing & Trading Score : 17 | |
| Day Percent Change: 2.63% Day Change: 0.77 | |
| Week Change: -1.02% Year-to-date Change: -29.3% | |
| YUMC Links: Profile News Message Board | |
| Charts:- Daily , Weekly | |
| Add YUMC to Watchlist: View: Get Complete YUMC Trend Analysis ➞ | |
 | BAK Braskem S.A. |
| Sector: Materials | |
| SubSector: Chemicals - Major Diversified | |
| MarketCap: 2715.86 Millions | |
| Recent Price: 6.44 Smart Investing & Trading Score : 22 | |
| Day Percent Change: 1.90% Day Change: 0.12 | |
| Week Change: -0.62% Year-to-date Change: -27.0% | |
| BAK Links: Profile News Message Board | |
| Charts:- Daily , Weekly | |
| Add BAK to Watchlist: View: Get Complete BAK Trend Analysis ➞ | |
 | UGP Ultrapar Participacoes S.A. |
| Sector: Energy | |
| SubSector: Oil & Gas Refining & Marketing | |
| MarketCap: 3473.54 Millions | |
| Recent Price: 4.06 Smart Investing & Trading Score : 17 | |
| Day Percent Change: 1.75% Day Change: 0.07 | |
| Week Change: -2.64% Year-to-date Change: -25.1% | |
| UGP Links: Profile News Message Board | |
| Charts:- Daily , Weekly | |
| Add UGP to Watchlist: View: Get Complete UGP Trend Analysis ➞ | |
 | BSBR Banco Santander (Brasil) S.A. |
| Sector: Financials | |
| SubSector: Foreign Regional Banks | |
| MarketCap: 21961.4 Millions | |
| Recent Price: 5.00 Smart Investing & Trading Score : 8 | |
| Day Percent Change: 1.63% Day Change: 0.08 | |
| Week Change: -4.03% Year-to-date Change: -23.7% | |
| BSBR Links: Profile News Message Board | |
| Charts:- Daily , Weekly | |
| Add BSBR to Watchlist: View: Get Complete BSBR Trend Analysis ➞ | |
 | IBN ICICI Bank Limited |
| Sector: Financials | |
| SubSector: Money Center Banks | |
| MarketCap: 31194.1 Millions | |
| Recent Price: 28.76 Smart Investing & Trading Score : 53 | |
| Day Percent Change: 1.63% Day Change: 0.46 | |
| Week Change: -2.01% Year-to-date Change: 20.6% | |
| IBN Links: Profile News Message Board | |
| Charts:- Daily , Weekly | |
| Add IBN to Watchlist: View: Get Complete IBN Trend Analysis ➞ | |
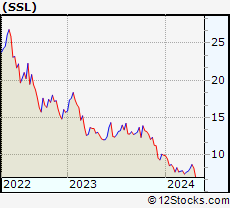 | SSL Sasol Limited |
| Sector: Energy | |
| SubSector: Major Integrated Oil & Gas | |
| MarketCap: 1233.85 Millions | |
| Recent Price: 7.79 Smart Investing & Trading Score : 60 | |
| Day Percent Change: 1.56% Day Change: 0.12 | |
| Week Change: 6.57% Year-to-date Change: -21.6% | |
| SSL Links: Profile News Message Board | |
| Charts:- Daily , Weekly | |
| Add SSL to Watchlist: View: Get Complete SSL Trend Analysis ➞ | |
 | BABA Alibaba Group Holding Limited |
| Sector: Services & Goods | |
| SubSector: Specialty Retail, Other | |
| MarketCap: 522666 Millions | |
| Recent Price: 76.53 Smart Investing & Trading Score : 86 | |
| Day Percent Change: 1.50% Day Change: 1.13 | |
| Week Change: 1.67% Year-to-date Change: -1.3% | |
| BABA Links: Profile News Message Board | |
| Charts:- Daily , Weekly | |
| Add BABA to Watchlist: View: Get Complete BABA Trend Analysis ➞ | |
 | IMOS ChipMOS TECHNOLOGIES INC. |
| Sector: Technology | |
| SubSector: Semiconductor Equipment & Materials | |
| MarketCap: 658.918 Millions | |
| Recent Price: 24.66 Smart Investing & Trading Score : 17 | |
| Day Percent Change: 1.50% Day Change: 0.37 | |
| Week Change: -1.97% Year-to-date Change: -9.4% | |
| IMOS Links: Profile News Message Board | |
| Charts:- Daily , Weekly | |
| Add IMOS to Watchlist: View: Get Complete IMOS Trend Analysis ➞ | |
 | VALE Vale S.A. |
| Sector: Materials | |
| SubSector: Industrial Metals & Minerals | |
| MarketCap: 43601 Millions | |
| Recent Price: 10.86 Smart Investing & Trading Score : 25 | |
| Day Percent Change: 1.50% Day Change: 0.16 | |
| Week Change: -0.64% Year-to-date Change: -31.5% | |
| VALE Links: Profile News Message Board | |
| Charts:- Daily , Weekly | |
| Add VALE to Watchlist: View: Get Complete VALE Trend Analysis ➞ | |
 | BIDU Baidu, Inc. |
| Sector: Technology | |
| SubSector: Internet Information Providers | |
| MarketCap: 33525.9 Millions | |
| Recent Price: 88.98 Smart Investing & Trading Score : 18 | |
| Day Percent Change: 1.36% Day Change: 1.19 | |
| Week Change: -1.54% Year-to-date Change: -25.3% | |
| BIDU Links: Profile News Message Board | |
| Charts:- Daily , Weekly | |
| Add BIDU to Watchlist: View: Get Complete BIDU Trend Analysis ➞ | |
 | FMX Fomento Economico Mexicano, S.A.B. de C.V. |
| Sector: Consumer Staples | |
| SubSector: Beverages - Brewers | |
| MarketCap: 22018.7 Millions | |
| Recent Price: 109.57 Smart Investing & Trading Score : 15 | |
| Day Percent Change: 1.20% Day Change: 1.30 | |
| Week Change: -5.79% Year-to-date Change: -15.9% | |
| FMX Links: Profile News Message Board | |
| Charts:- Daily , Weekly | |
| Add FMX to Watchlist: View: Get Complete FMX Trend Analysis ➞ | |
 | CHT Chunghwa Telecom Co., Ltd. |
| Sector: Technology | |
| SubSector: Telecom Services - Domestic | |
| MarketCap: 28101.3 Millions | |
| Recent Price: 37.13 Smart Investing & Trading Score : 64 | |
| Day Percent Change: 1.07% Day Change: 0.39 | |
| Week Change: 2.02% Year-to-date Change: -5.0% | |
| CHT Links: Profile News Message Board | |
| Charts:- Daily , Weekly | |
| Add CHT to Watchlist: View: Get Complete CHT Trend Analysis ➞ | |
 | TSM Taiwan Semiconductor Manufacturing Company Limited |
| Sector: Technology | |
| SubSector: Semiconductor - Integrated Circuits | |
| MarketCap: 239384 Millions | |
| Recent Price: 161.94 Smart Investing & Trading Score : 48 | |
| Day Percent Change: 1.04% Day Change: 1.66 | |
| Week Change: -2.31% Year-to-date Change: 55.7% | |
| TSM Links: Profile News Message Board | |
| Charts:- Daily , Weekly | |
| Add TSM to Watchlist: View: Get Complete TSM Trend Analysis ➞ | |
 | MOMO Momo Inc. |
| Sector: Technology | |
| SubSector: Internet Software & Services | |
| MarketCap: 4796.71 Millions | |
| Recent Price: 6.80 Smart Investing & Trading Score : 63 | |
| Day Percent Change: 0.89% Day Change: 0.06 | |
| Week Change: 3.5% Year-to-date Change: -2.2% | |
| MOMO Links: Profile News Message Board | |
| Charts:- Daily , Weekly | |
| Add MOMO to Watchlist: View: Get Complete MOMO Trend Analysis ➞ | |
 | JD JD.com, Inc. |
| Sector: Technology | |
| SubSector: Internet Information Providers | |
| MarketCap: 59907.3 Millions | |
| Recent Price: 26.55 Smart Investing & Trading Score : 10 | |
| Day Percent Change: 0.84% Day Change: 0.22 | |
| Week Change: 1.1% Year-to-date Change: -8.1% | |
| JD Links: Profile News Message Board | |
| Charts:- Daily , Weekly | |
| Add JD to Watchlist: View: Get Complete JD Trend Analysis ➞ | |
 | CX CEMEX, S.A.B. de C.V. |
| Sector: Industrials | |
| SubSector: Cement | |
| MarketCap: 2948.23 Millions | |
| Recent Price: 6.42 Smart Investing & Trading Score : 42 | |
| Day Percent Change: 0.78% Day Change: 0.05 | |
| Week Change: 4.39% Year-to-date Change: -17.2% | |
| CX Links: Profile News Message Board | |
| Charts:- Daily , Weekly | |
| Add CX to Watchlist: View: Get Complete CX Trend Analysis ➞ | |
 | HDB HDFC Bank Limited |
| Sector: Financials | |
| SubSector: Foreign Regional Banks | |
| MarketCap: 29894.1 Millions | |
| Recent Price: 60.62 Smart Investing & Trading Score : 68 | |
| Day Percent Change: 0.70% Day Change: 0.42 | |
| Week Change: 1.9% Year-to-date Change: -9.7% | |
| HDB Links: Profile News Message Board | |
| Charts:- Daily , Weekly | |
| Add HDB to Watchlist: View: Get Complete HDB Trend Analysis ➞ | |
 | VIPS Vipshop Holdings Limited |
| Sector: Services & Goods | |
| SubSector: Catalog & Mail Order Houses | |
| MarketCap: 10496.2 Millions | |
| Recent Price: 13.46 Smart Investing & Trading Score : 25 | |
| Day Percent Change: 0.67% Day Change: 0.09 | |
| Week Change: -1.32% Year-to-date Change: -24.2% | |
| VIPS Links: Profile News Message Board | |
| Charts:- Daily , Weekly | |
| Add VIPS to Watchlist: View: Get Complete VIPS Trend Analysis ➞ | |
| For tabular summary view of above stock list: Summary View ➞ 0 - 25 , 25 - 50 | ||
| Click To Change The Sort Order: By Market Cap or Company Size Performance: Year-to-date, Week and Day | |
| Select Chart Type: | ||
|
Best Stocks Today 12Stocks.com |
© 2024 12Stocks.com Terms & Conditions Privacy Contact Us
All Information Provided Only For Education And Not To Be Used For Investing or Trading. See Terms & Conditions


One More Thing ... Get Best Stocks Delivered Daily!
Never Ever Miss A Move With Our Top Ten Stocks Lists
Find Best Stocks In Any Market - Bull or Bear Market
Take A Peek At Our Top Ten Stocks Lists: Daily, Weekly, Year-to-Date & Top Trends
Find Best Stocks In Any Market - Bull or Bear Market
Take A Peek At Our Top Ten Stocks Lists: Daily, Weekly, Year-to-Date & Top Trends
Emerging Markets Stocks With Best Up Trends [0-bearish to 100-bullish]: Infosys [100], Dr. Reddy[100], Alibaba [86], Wipro [68], HDFC Bank[68], Chunghwa Telecom[64], Momo [63], Sasol [60], BRF S.A[58], ICICI Bank[53], TAL Education[49]
Best Emerging Markets Stocks Year-to-Date:
Taiwan Semiconductor[55.71%], BRF S.A[37.59%], Infosys [23.99%], ICICI Bank[20.64%], Dr. Reddy[16.79%], Wipro [11.49%], ASE [9.88%], Companhia de[1.12%], New Oriental[0.16%], Semiconductor [-0.23%], NetEase [-0.58%] Best Emerging Markets Stocks This Week:
Sasol [6.57%], TAL Education[6.44%], Infosys [5.12%], CEMEX S.A.B.[4.39%], Dr. Reddy[4.02%], Momo [3.5%], Centrais Eletricas[2.56%], BRF S.A[2.27%], Chunghwa Telecom[2.02%], Wipro [1.97%], HDFC Bank[1.9%] Best Emerging Markets Stocks Daily:
New Oriental[4.37%], Infosys [3.54%], BRF S.A[3.38%], TAL Education[3.27%], Wipro [3.16%], Centrais Eletricas[2.87%], ZTO Express[2.73%], Yum China[2.63%], Braskem S.A[1.90%], Ultrapar Participacoes[1.75%], Banco Santander[1.63%]