
 Login Sign Up


| |||||
 |  | ||||

| 12Stocks.com Market Intelligence |
Best Emerging Markets Stocks
| In a hurry? Emerging Markets Stocks Lists: Trends Table, Stock Charts
Sort Emerging Markets stocks: Daily, Weekly, Year-to-Date, Market Cap & Trends. Filter Emerging Markets stocks list by sector: Show all, Tech, Finance, Energy, Staples, Retail, Industrial, Materials, Utilities and HealthCare Filter Emerging Markets stocks list by size:All Large Medium Small |
| 12Stocks.com Emerging Markets Stocks Performances & Trends Daily | |||||||||
|
|  The overall Smart Investing & Trading Score is 68 (0-bearish to 100-bullish) which puts Emerging Markets index in short term neutral to bullish trend. The Smart Investing & Trading Score from previous trading session is 63 and hence an improvement of trend.
| ||||||||
Here are the Smart Investing & Trading Scores of the most requested Emerging Markets stocks at 12Stocks.com (click stock name for detailed review):
|


| 12Stocks.com: Top Performing Emerging Markets Index Stocks | ||||||||||||||||||||||||||||||||||||||||||||||||
 The top performing Emerging Markets Index stocks year to date are
Now, more recently, over last week, the top performing Emerging Markets Index stocks on the move are


|
||||||||||||||||||||||||||||||||||||||||||||||||
| 12Stocks.com: Investing in Emerging Markets Index with Stocks | |
|
The following table helps investors and traders sort through current performance and trends (as measured by Smart Investing & Trading Score ) of various
stocks in the Emerging Markets Index. Quick View: Move mouse or cursor over stock symbol (ticker) to view short-term technical chart and over stock name to view long term chart. Click on  to add stock symbol to your watchlist and to add stock symbol to your watchlist and  to view watchlist. Click on any ticker or stock name for detailed market intelligence report for that stock. to view watchlist. Click on any ticker or stock name for detailed market intelligence report for that stock. |
12Stocks.com Performance of Stocks in Emerging Markets Index
| Ticker | Stock Name | Watchlist | Category | Recent Price | Smart Investing & Trading Score | Change % | YTD Change% |
| JKS | JinkoSolar Holding |   | Technology | 22.88 | 60 | 4.86 | -38.06% |
| AGMH | AGM | | Technology | 1.08 | 32 | 4.85 | -40.33% |
| HSAI | Hesai | | Services & Goods | 4.24 | 30 | 4.83 | -53.36% |
| TME | Tencent Music | | Technology | 12.32 | 75 | 4.76 | 36.74% |
| WIMI | WiMi Hologram | | Technology | 0.72 | 43 | 4.62 | -9.94% |
| FANH | Fanhua | | Financials | 3.66 | 42 | 4.57 | -44.96% |
| BEKE | KE | | Financials | 13.61 | 42 | 4.13 | -16.04% |
| MNSO | MINISO | | Services & Goods | 22.04 | 100 | 3.91 | 8.04% |
| TOP | TOP Financial | | Financials | 2.48 | 52 | 3.77 | -33.33% |
| TUYA | Tuya | | Technology | 1.73 | 42 | 3.59 | -24.62% |
| TV | Grupo Televisa | | Services & Goods | 3.00 | 42 | 3.45 | -10.18% |
| YSG | Yatsen Holding | | Services & Goods | 3.93 | 100 | 3.42 | 437.18% |
| KC | Kingsoft Cloud | | Technology | 2.83 | 80 | 3.28 | -25.23% |
| STNE | StoneCo | | Technology | 15.77 | 17 | 3.27 | -12.53% |
| DQ | Daqo New | | Technology | 23.01 | 68 | 3.23 | -13.50% |
| PDD | Pinduoduo | | Services & Goods | 128.06 | 44 | 3.16 | -12.47% |
| PERF | Perfect | | Technology | 2.33 | 46 | 3.10 | -24.84% |
| YUMC | Yum China | | Services & Goods | 38.36 | 85 | 3.04 | -9.59% |
| YMM | Full Truck | | Technology | 8.16 | 100 | 3.03 | 16.65% |
| NU | Nu | | Financials | 10.92 | 48 | 2.92 | 30.94% |
| XPEV | XPeng | | Services & Goods | 7.18 | 35 | 2.87 | -50.79% |
| TSM | Taiwan Semiconductor | | Technology | 133.43 | 68 | 2.84 | 28.30% |
| BZ | Kanzhun | | Industrials | 18.79 | 68 | 2.82 | 13.68% |
| YGMZ | MingZhu Logistics | | Industrials | 0.43 | 25 | 2.76 | -9.27% |
| GGR | Gogoro | | Services & Goods | 1.50 | 37 | 2.74 | -42.31% |
| For chart view version of above stock list: Chart View ➞ 0 - 25 , 25 - 50 , 50 - 75 , 75 - 100 , 100 - 125 , 125 - 150 , 150 - 175 , 175 - 200 | ||
 | Click To Change The Sort Order: By Market Cap or Company Size Performance: Year-to-date, Week and Day |  |
|
Get the most comprehensive stock market coverage daily at 12Stocks.com ➞ Best Stocks Today ➞ Best Stocks Weekly ➞ Best Stocks Year-to-Date ➞ Best Stocks Trends ➞  Best Stocks Today 12Stocks.com Best Nasdaq Stocks ➞ Best S&P 500 Stocks ➞ Best Tech Stocks ➞ Best Biotech Stocks ➞ |
| Detailed Overview of Emerging Markets Stocks |
| Emerging Markets Technical Overview, Leaders & Laggards, Top Emerging Markets ETF Funds & Detailed Emerging Markets Stocks List, Charts, Trends & More |
| Emerging Markets: Technical Analysis, Trends & YTD Performance | |
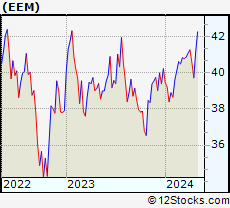
 EEM Weekly Chart |
|
| Long Term Trend: Very Good | |
| Medium Term Trend: Not Good | |
 EEM Daily Chart |
|
| Short Term Trend: Very Good | |
| Overall Trend Score: 68 | |
| YTD Performance: 0.65% | |
| **Trend Scores & Views Are Only For Educational Purposes And Not For Investing | |
| 12Stocks.com: Investing in Emerging Markets Index using Exchange Traded Funds | |
|
The following table shows list of key exchange traded funds (ETF) that
help investors play Emerging Markets stock market. For detailed view, check out our ETF Funds section of our website. Quick View: Move mouse or cursor over ETF symbol (ticker) to view short-term technical chart and over ETF name to view long term chart. Click on ticker or stock name for detailed view. Click on to add stock symbol to your watchlist and to view watchlist. |
12Stocks.com List of ETFs that track Emerging Markets Index
| Ticker | ETF Name | Watchlist | Recent Price | Smart Investing & Trading Score | Change % | Week % | Year-to-date % |
| EEM | Emerging Markets | | 40.47 | 68 | 0.82 | 1.91 | 0.65% |
| VWO | Emerging Markets | | 41.58 | 68 | 0.82 | 1.69 | 1.17% |
| SCHE | Emerging Markets Equity | | 25.05 | 68 | 0.54 | 1.44 | 1.03% |
| EWX | Emerging Markets Small | | 55.66 | 51 | 0.59 | 0.88 | -1.43% |
| EET | Emerging Markets | | 49.32 | 68 | 0.84 | 3.36 | -3.03% |
| EDC | Emrg Mkts Bull | | 28.67 | 63 | 2.47 | 5.91 | -5.78% |
| EEV | Short Emerging | | 20.01 | 32 | -0.45 | -2.47 | 1.45% |
| EUM | Short Emerging | | 14.25 | 32 | -0.63 | -1.67 | 0.71% |
| EDIV | Emerging Markets Dividend | | 33.07 | 51 | 0.30 | 0.18 | 1.69% |
| EMIF | Emerging Markets Infrastructure | | 21.62 | 53 | 0.23 | 1.12 | 1.03% |
| CEW | Emerging Currency Strat | | 17.61 | 38 | 0.03 | 0.06 | -2.17% |
| EBND | Em Mkts Lcl | | 20.03 | 35 | 0.45 | 0.5 | -5.7% |
| EMCB | Emerging Markets Corp | | 63.76 | 31 | -0.06 | 0.27 | -0.22% |
| VWOB | Emerging Mkts Govt | | 62.72 | 57 | 0.10 | 0.63 | -1.62% |
| EEMA | Emerging Markets Asia | | 67.45 | 68 | 1.04 | 2.06 | 2.03% |
| EELV | Em Mkts Low | | 23.48 | 45 | 0.56 | 1.36 | -2.35% |
| DVYE | Emerging Markets Dividend | | 26.57 | 81 | 0.19 | 0.34 | 0.3% |
| SDEM | SuperDividend Em Mkts | | 25.30 | 26 | -0.98 | -2.17 | 2.03% |
| DBEM | Em Mkts Hdgd | | 23.54 | 68 | 0.73 | 1.9 | 2.04% |
| PCY | Emerging Markets Sov | | 19.90 | 39 | 0.20 | 0.45 | -3.49% |
| QEMM | Emerging Mkts StratcFacts | | 56.73 | 56 | 0.56 | 1.02 | -0.74% |
| 12Stocks.com: Charts, Trends, Fundamental Data and Performances of Emerging Markets Stocks | |
|
We now take in-depth look at all Emerging Markets stocks including charts, multi-period performances and overall trends (as measured by Smart Investing & Trading Score ). One can sort Emerging Markets stocks (click link to choose) by Daily, Weekly and by Year-to-Date performances. Also, one can sort by size of the company or by market capitalization. |
| Select Your Default Chart Type: | |||||
| |||||
| Click on stock symbol or name for detailed view. Click on to add stock symbol to your watchlist and to view watchlist. Quick View: Move mouse or cursor over "Daily" to quickly view daily technical stock chart and over "Weekly" to view weekly technical stock chart. | |||||

 | JKS JinkoSolar Holding Co., Ltd. |
| Sector: Technology | |
| SubSector: Semiconductor - Specialized | |
| MarketCap: 629.36 Millions | |
| Recent Price: 22.88 Smart Investing & Trading Score : 60 | |
| Day Percent Change: 4.86% Day Change: 1.06 | |
| Week Change: 6.12% Year-to-date Change: -38.1% | |
| JKS Links: Profile News Message Board | |
| Charts:- Daily , Weekly | |
| Add JKS to Watchlist: View: Get Complete JKS Trend Analysis ➞ | |
 | AGMH AGM Group Holdings Inc. |
| Sector: Technology | |
| SubSector: Application Software | |
| MarketCap: 320.362 Millions | |
| Recent Price: 1.08 Smart Investing & Trading Score : 32 | |
| Day Percent Change: 4.85% Day Change: 0.05 | |
| Week Change: -2.7% Year-to-date Change: -40.3% | |
| AGMH Links: Profile News Message Board | |
| Charts:- Daily , Weekly | |
| Add AGMH to Watchlist: View: Get Complete AGMH Trend Analysis ➞ | |
 | HSAI Hesai Group |
| Sector: Services & Goods | |
| SubSector: Auto Parts | |
| MarketCap: 1330 Millions | |
| Recent Price: 4.24 Smart Investing & Trading Score : 30 | |
| Day Percent Change: 4.83% Day Change: 0.20 | |
| Week Change: 6.68% Year-to-date Change: -53.4% | |
| HSAI Links: Profile News Message Board | |
| Charts:- Daily , Weekly | |
| Add HSAI to Watchlist: View: Get Complete HSAI Trend Analysis ➞ | |
 | TME Tencent Music Entertainment Group |
| Sector: Technology | |
| SubSector: Internet Information Providers | |
| MarketCap: 16195 Millions | |
| Recent Price: 12.32 Smart Investing & Trading Score : 75 | |
| Day Percent Change: 4.76% Day Change: 0.56 | |
| Week Change: 8.45% Year-to-date Change: 36.7% | |
| TME Links: Profile News Message Board | |
| Charts:- Daily , Weekly | |
| Add TME to Watchlist: View: Get Complete TME Trend Analysis ➞ | |
 | WIMI WiMi Hologram Cloud Inc. |
| Sector: Technology | |
| SubSector: Advertising Agencies | |
| MarketCap: 41837 Millions | |
| Recent Price: 0.72 Smart Investing & Trading Score : 43 | |
| Day Percent Change: 4.62% Day Change: 0.03 | |
| Week Change: 3.93% Year-to-date Change: -9.9% | |
| WIMI Links: Profile News Message Board | |
| Charts:- Daily , Weekly | |
| Add WIMI to Watchlist: View: Get Complete WIMI Trend Analysis ➞ | |
 | FANH Fanhua Inc. |
| Sector: Financials | |
| SubSector: Insurance Brokers | |
| MarketCap: 1436.67 Millions | |
| Recent Price: 3.66 Smart Investing & Trading Score : 42 | |
| Day Percent Change: 4.57% Day Change: 0.16 | |
| Week Change: 4.57% Year-to-date Change: -45.0% | |
| FANH Links: Profile News Message Board | |
| Charts:- Daily , Weekly | |
| Add FANH to Watchlist: View: Get Complete FANH Trend Analysis ➞ | |
 | BEKE KE Holdings Inc. |
| Sector: Financials | |
| SubSector: Real Estate Services | |
| MarketCap: 80167 Millions | |
| Recent Price: 13.61 Smart Investing & Trading Score : 42 | |
| Day Percent Change: 4.13% Day Change: 0.54 | |
| Week Change: 7.59% Year-to-date Change: -16.0% | |
| BEKE Links: Profile News Message Board | |
| Charts:- Daily , Weekly | |
| Add BEKE to Watchlist: View: Get Complete BEKE Trend Analysis ➞ | |
 | MNSO MINISO Group Holding Limited |
| Sector: Services & Goods | |
| SubSector: Specialty Retail | |
| MarketCap: 69427 Millions | |
| Recent Price: 22.04 Smart Investing & Trading Score : 100 | |
| Day Percent Change: 3.91% Day Change: 0.83 | |
| Week Change: 7.49% Year-to-date Change: 8.0% | |
| MNSO Links: Profile News Message Board | |
| Charts:- Daily , Weekly | |
| Add MNSO to Watchlist: View: Get Complete MNSO Trend Analysis ➞ | |
 | TOP TOP Financial Group Limited |
| Sector: Financials | |
| SubSector: Capital Markets | |
| MarketCap: 329 Millions | |
| Recent Price: 2.48 Smart Investing & Trading Score : 52 | |
| Day Percent Change: 3.77% Day Change: 0.09 | |
| Week Change: 5.53% Year-to-date Change: -33.3% | |
| TOP Links: Profile News Message Board | |
| Charts:- Daily , Weekly | |
| Add TOP to Watchlist: View: Get Complete TOP Trend Analysis ➞ | |
 | TUYA Tuya Inc. |
| Sector: Technology | |
| SubSector: Software - Infrastructure | |
| MarketCap: 1050 Millions | |
| Recent Price: 1.73 Smart Investing & Trading Score : 42 | |
| Day Percent Change: 3.59% Day Change: 0.06 | |
| Week Change: 10.19% Year-to-date Change: -24.6% | |
| TUYA Links: Profile News Message Board | |
| Charts:- Daily , Weekly | |
| Add TUYA to Watchlist: View: Get Complete TUYA Trend Analysis ➞ | |
 | TV Grupo Televisa, S.A.B. |
| Sector: Services & Goods | |
| SubSector: Broadcasting - TV | |
| MarketCap: 3740.43 Millions | |
| Recent Price: 3.00 Smart Investing & Trading Score : 42 | |
| Day Percent Change: 3.45% Day Change: 0.10 | |
| Week Change: 6.76% Year-to-date Change: -10.2% | |
| TV Links: Profile News Message Board | |
| Charts:- Daily , Weekly | |
| Add TV to Watchlist: View: Get Complete TV Trend Analysis ➞ | |
 | YSG Yatsen Holding Limited |
| Sector: Services & Goods | |
| SubSector: Specialty Retail | |
| MarketCap: 11827 Millions | |
| Recent Price: 3.93 Smart Investing & Trading Score : 100 | |
| Day Percent Change: 3.42% Day Change: 0.13 | |
| Week Change: 8.71% Year-to-date Change: 437.2% | |
| YSG Links: Profile News Message Board | |
| Charts:- Daily , Weekly | |
| Add YSG to Watchlist: View: Get Complete YSG Trend Analysis ➞ | |
 | KC Kingsoft Cloud Holdings Limited |
| Sector: Technology | |
| SubSector: Software Application | |
| MarketCap: 98487 Millions | |
| Recent Price: 2.83 Smart Investing & Trading Score : 80 | |
| Day Percent Change: 3.28% Day Change: 0.09 | |
| Week Change: 6.19% Year-to-date Change: -25.2% | |
| KC Links: Profile News Message Board | |
| Charts:- Daily , Weekly | |
| Add KC to Watchlist: View: Get Complete KC Trend Analysis ➞ | |
 | STNE StoneCo Ltd. |
| Sector: Technology | |
| SubSector: Application Software | |
| MarketCap: 7347.82 Millions | |
| Recent Price: 15.77 Smart Investing & Trading Score : 17 | |
| Day Percent Change: 3.27% Day Change: 0.50 | |
| Week Change: 3.07% Year-to-date Change: -12.5% | |
| STNE Links: Profile News Message Board | |
| Charts:- Daily , Weekly | |
| Add STNE to Watchlist: View: Get Complete STNE Trend Analysis ➞ | |
 | DQ Daqo New Energy Corp. |
| Sector: Technology | |
| SubSector: Semiconductor Equipment & Materials | |
| MarketCap: 660.918 Millions | |
| Recent Price: 23.01 Smart Investing & Trading Score : 68 | |
| Day Percent Change: 3.23% Day Change: 0.72 | |
| Week Change: 4.07% Year-to-date Change: -13.5% | |
| DQ Links: Profile News Message Board | |
| Charts:- Daily , Weekly | |
| Add DQ to Watchlist: View: Get Complete DQ Trend Analysis ➞ | |
 | PDD Pinduoduo Inc. |
| Sector: Services & Goods | |
| SubSector: Specialty Retail, Other | |
| MarketCap: 41696.2 Millions | |
| Recent Price: 128.06 Smart Investing & Trading Score : 44 | |
| Day Percent Change: 3.16% Day Change: 3.92 | |
| Week Change: 12.84% Year-to-date Change: -12.5% | |
| PDD Links: Profile News Message Board | |
| Charts:- Daily , Weekly | |
| Add PDD to Watchlist: View: Get Complete PDD Trend Analysis ➞ | |
 | PERF Perfect Corp. |
| Sector: Technology | |
| SubSector: Software - Application | |
| MarketCap: 582 Millions | |
| Recent Price: 2.33 Smart Investing & Trading Score : 46 | |
| Day Percent Change: 3.10% Day Change: 0.07 | |
| Week Change: 1.3% Year-to-date Change: -24.8% | |
| PERF Links: Profile News Message Board | |
| Charts:- Daily , Weekly | |
| Add PERF to Watchlist: View: Get Complete PERF Trend Analysis ➞ | |
 | YUMC Yum China Holdings, Inc. |
| Sector: Services & Goods | |
| SubSector: Restaurants | |
| MarketCap: 16284.5 Millions | |
| Recent Price: 38.36 Smart Investing & Trading Score : 85 | |
| Day Percent Change: 3.04% Day Change: 1.13 | |
| Week Change: 3.4% Year-to-date Change: -9.6% | |
| YUMC Links: Profile News Message Board | |
| Charts:- Daily , Weekly | |
| Add YUMC to Watchlist: View: Get Complete YUMC Trend Analysis ➞ | |
 | YMM Full Truck Alliance Co. Ltd. |
| Sector: Technology | |
| SubSector: Software - Application | |
| MarketCap: 6960 Millions | |
| Recent Price: 8.16 Smart Investing & Trading Score : 100 | |
| Day Percent Change: 3.03% Day Change: 0.24 | |
| Week Change: 5.02% Year-to-date Change: 16.7% | |
| YMM Links: Profile News Message Board | |
| Charts:- Daily , Weekly | |
| Add YMM to Watchlist: View: Get Complete YMM Trend Analysis ➞ | |
 | NU Nu Holdings Ltd. |
| Sector: Financials | |
| SubSector: Banks - Diversified | |
| MarketCap: 37240 Millions | |
| Recent Price: 10.92 Smart Investing & Trading Score : 48 | |
| Day Percent Change: 2.92% Day Change: 0.31 | |
| Week Change: 4.2% Year-to-date Change: 30.9% | |
| NU Links: Profile News Message Board | |
| Charts:- Daily , Weekly | |
| Add NU to Watchlist: View: Get Complete NU Trend Analysis ➞ | |
 | XPEV XPeng Inc. |
| Sector: Services & Goods | |
| SubSector: Auto Manufacturers | |
| MarketCap: 32917 Millions | |
| Recent Price: 7.18 Smart Investing & Trading Score : 35 | |
| Day Percent Change: 2.87% Day Change: 0.20 | |
| Week Change: 1.92% Year-to-date Change: -50.8% | |
| XPEV Links: Profile News Message Board | |
| Charts:- Daily , Weekly | |
| Add XPEV to Watchlist: View: Get Complete XPEV Trend Analysis ➞ | |
 | TSM Taiwan Semiconductor Manufacturing Company Limited |
| Sector: Technology | |
| SubSector: Semiconductor - Integrated Circuits | |
| MarketCap: 239384 Millions | |
| Recent Price: 133.43 Smart Investing & Trading Score : 68 | |
| Day Percent Change: 2.84% Day Change: 3.68 | |
| Week Change: 4.49% Year-to-date Change: 28.3% | |
| TSM Links: Profile News Message Board | |
| Charts:- Daily , Weekly | |
| Add TSM to Watchlist: View: Get Complete TSM Trend Analysis ➞ | |
 | BZ Kanzhun Limited |
| Sector: Industrials | |
| SubSector: Staffing & Employment Services | |
| MarketCap: 6680 Millions | |
| Recent Price: 18.79 Smart Investing & Trading Score : 68 | |
| Day Percent Change: 2.82% Day Change: 0.52 | |
| Week Change: 5.3% Year-to-date Change: 13.7% | |
| BZ Links: Profile News Message Board | |
| Charts:- Daily , Weekly | |
| Add BZ to Watchlist: View: Get Complete BZ Trend Analysis ➞ | |
 | YGMZ MingZhu Logistics Holdings Limited |
| Sector: Industrials | |
| SubSector: Trucking | |
| MarketCap: 41627 Millions | |
| Recent Price: 0.43 Smart Investing & Trading Score : 25 | |
| Day Percent Change: 2.76% Day Change: 0.01 | |
| Week Change: -8.77% Year-to-date Change: -9.3% | |
| YGMZ Links: Profile News Message Board | |
| Charts:- Daily , Weekly | |
| Add YGMZ to Watchlist: View: Get Complete YGMZ Trend Analysis ➞ | |
 | GGR Gogoro Inc. |
| Sector: Services & Goods | |
| SubSector: Auto Parts | |
| MarketCap: 856 Millions | |
| Recent Price: 1.50 Smart Investing & Trading Score : 37 | |
| Day Percent Change: 2.74% Day Change: 0.04 | |
| Week Change: 6.38% Year-to-date Change: -42.3% | |
| GGR Links: Profile News Message Board | |
| Charts:- Daily , Weekly | |
| Add GGR to Watchlist: View: Get Complete GGR Trend Analysis ➞ | |
| For tabular summary view of above stock list: Summary View ➞ 0 - 25 , 25 - 50 , 50 - 75 , 75 - 100 , 100 - 125 , 125 - 150 , 150 - 175 , 175 - 200 | ||
| Click To Change The Sort Order: By Market Cap or Company Size Performance: Year-to-date, Week and Day | |
| Select Chart Type: | ||
|
Best Stocks Today 12Stocks.com |
© 2024 12Stocks.com Terms & Conditions Privacy Contact Us
All Information Provided Only For Education And Not To Be Used For Investing or Trading. See Terms & Conditions


One More Thing ... Get Best Stocks Delivered Daily!
Never Ever Miss A Move With Our Top Ten Stocks Lists
Find Best Stocks In Any Market - Bull or Bear Market
Take A Peek At Our Top Ten Stocks Lists: Daily, Weekly, Year-to-Date & Top Trends
Find Best Stocks In Any Market - Bull or Bear Market
Take A Peek At Our Top Ten Stocks Lists: Daily, Weekly, Year-to-Date & Top Trends
Emerging Markets Stocks With Best Up Trends [0-bearish to 100-bullish]: Grupo Aeroportuario[100], Grupo Aeroportuario[100], Controladora Vuela[100], MINISO [100], Yatsen Holding[100], Full Truck[100], BRF S.A[100], JD.com [100], Baozun [95], America Movil[93], TAL Education[90]
Best Emerging Markets Stocks Year-to-Date:
U Power[2801.79%], DouYu [783.16%], MicroCloud Hologram[642.45%], China Liberal[498.43%], Yatsen Holding[437.18%], Zhongchao [369.73%], Uxin [131.81%], QuantaSing [105.86%], GigaCloud [102.02%], Cheetah Mobile[78.07%], Bright Scholar[64.8%] Best Emerging Markets Stocks This Week:
Cheetah Mobile[14.69%], Grupo Aeroportuario[14.29%], So-Young [13.3%], Pinduoduo [12.84%], iQIYI [12.12%], China Online[11.28%], Hutchison China[10.37%], Baozun [10.34%], Tuya [10.19%], Grupo Aeroportuario[9.79%], Grupo Aeroportuario[9.03%] Best Emerging Markets Stocks Daily:
Golden Heaven[11.75%], Grupo Aeroportuario[11.24%], 17 Education[10.07%], Aesthetic Medical[9.05%], Cheetah Mobile[8.85%], China Online[8.76%], Zhongchao [7.86%], Grupo Aeroportuario[7.57%], Hutchison China[7.44%], Grupo Aeroportuario[7.33%], U Power[7.00%]