
 Login Sign Up


| |||||
 |  | ||||

| 12Stocks.com Market Intelligence |
Best Consumer Services Stocks
| In a hurry? Services & Goods Stocks: Performance Trends Table, Stock Charts
Sort Consumer Services: Daily, Weekly, Year-to-Date, Market Cap & Trends. Filter Services & Goods stocks list by size: All Large Mid-Range Small |
| 12Stocks.com Consumer Services Stocks Performances & Trends Daily | |||||||||
|
|  The overall Smart Investing & Trading Score is 100 (0-bearish to 100-bullish) which puts Consumer Services sector in short term bullish trend. The Smart Investing & Trading Score from previous trading session is 50 and an improvement of trend continues.
| ||||||||
Here are the Smart Investing & Trading Scores of the most requested Consumer Services stocks at 12Stocks.com (click stock name for detailed review):
|


| Consider signing up for our daily 12Stocks.com "Best Stocks Newsletter". You will never ever miss a big stock move again! |
| 12Stocks.com: Investing in Consumer Services sector with Stocks | |
|
The following table helps investors and traders sort through current performance and trends (as measured by Smart Investing & Trading Score) of various
stocks in the Consumer Services sector. Quick View: Move mouse or cursor over stock symbol (ticker) to view short-term Technical chart and over stock name to view long term chart. Click on  to add stock symbol to your watchlist and to add stock symbol to your watchlist and  to view watchlist. Click on any ticker or stock name for detailed market intelligence report for that stock. to view watchlist. Click on any ticker or stock name for detailed market intelligence report for that stock. |
12Stocks.com Performance of Stocks in Consumer Services Sector
| Ticker | Stock Name | Watchlist | Category | Recent Price | Smart Investing & Trading Score | Change % | YTD Change% |
| JMEI | Jumei |   | Retail | 17.90 | 80 | -0.33% | 0.00% |
| GSOL | Global Sources | | Services | 16.92 | 40 | 13.10% | -28.15% |
| REIS | Reis | | Services | 395.17 | 70 | 0.80% | 0.00% |
| HBB | Hamilton Beach | | Furnishings, Fixtures & Appliances | 14.57 | 20 | -0.41% | -9.17% |
| RUSHB | Rush Enterprises | | Automobile | 58.50 | 80 | 1.18% | 9.73% |
| TEDU | Tarena | | Education | 1.76 | 60 | 3.53% | 0.00% |
| MB | Masterbeef | | Restaurants | 10.50 | 60 | 12.30% | 156.10% |
| COOK | Traeger | | Furnishings, Fixtures & Appliances | 1.33 | 40 | 2.31% | -44.12% |
| JAKK | Jakks Pacific | | Leisure | 18.07 | 80 | 1.06% | -34.23% |
| CSSEP | Chicken Soup | | Broadcasting | 0.40 | 10 | 6.67% | 0.00% |
| SGC | Superior of | | Apparel Manufacturing | 11.19 | 30 | -5.09% | -29.30% |
| ELA | Envela Corp | | Luxury Goods | 7.43 | 70 | 5.39% | 5.24% |
| OSTK | Overstock.com | | Retail | 46.50 | 70 | 0.30% | 0.00% |
| ASCMA | Ascent Capital | | Security | 6.33 | 70 | 7.29% | 0.00% |
| BZUN | Baozun | | Internet Retail | 4.60 | 90 | -3.56% | 66.07% |
| CURV | Torrid | | Apparel Retail | 1.84 | 30 | -3.66% | -65.15% |
| ASPU | Aspen | | Education | 0.06 | 60 | 6.17% | -54.50% |
| HIBB | Hibbett Sports | | Retail | 66.01 | 0 | 0.64% | 0.00% |
| FNKO | Funko | | Leisure | 3.34 | 50 | 0.30% | -75.45% |
| WBAI | 500.com | | Gaming | 81.70 | 20 | -13.73% | 0.00% |
| BRLT | Brilliant Earth | | Luxury Goods | 2.36 | 53 | 0.00% | 7.62% |
| ESCA | Escalade | | Leisure | 12.55 | 30 | 1.21% | -12.31% |
| UEPS | Net 1 | | Services | 5.90 | 100 | 9.46% | 0.00% |
| FUEL | Rocket Fuel | | Advertising | 14.23 | 80 | 3.87% | 0.00% |
| JCP | J. C. | | Department | 59.28 | 20 | 1.51% | 0.00% |
| For chart view version of above stock list: Chart View ➞ 0 - 25 , 25 - 50 , 50 - 75 , 75 - 100 , 100 - 125 , 125 - 150 , 150 - 175 , 175 - 200 , 200 - 225 , 225 - 250 , 250 - 275 , 275 - 300 , 300 - 325 , 325 - 350 , 350 - 375 , 375 - 400 , 400 - 425 , 425 - 450 , 450 - 475 , 475 - 500 , 500 - 525 , 525 - 550 , 550 - 575 , 575 - 600 , 600 - 625 | ||
 | Click To Change The Sort Order: By Market Cap or Company Size Performance: Year-to-date, Week and Day |  |
|
Get the most comprehensive stock market coverage daily at 12Stocks.com ➞ Best Stocks Today ➞ Best Stocks Weekly ➞ Best Stocks Year-to-Date ➞ Best Stocks Trends ➞  Best Stocks Today 12Stocks.com Best Nasdaq Stocks ➞ Best S&P 500 Stocks ➞ Best Tech Stocks ➞ Best Biotech Stocks ➞ |
| Detailed Overview of Consumer Services Stocks |
| Consumer Services Technical Overview, Leaders & Laggards, Top Consumer Services ETF Funds & Detailed Consumer Services Stocks List, Charts, Trends & More |
| Consumer Services Sector: Technical Analysis, Trends & YTD Performance | |
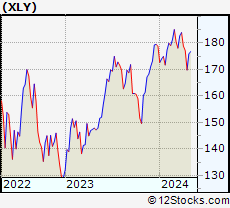
| Consumer Services sector is composed of stocks
from retail, entertainment, media/publishing, consumer goods
and services subsectors. Consumer Services sector, as represented by XLY, an exchange-traded fund [ETF] that holds basket of Consumer Services stocks (e.g, Walmart, Alibaba) is up by 9.2482% and is currently underperforming the overall market by -4.1526% year-to-date. Below is a quick view of Technical charts and trends: |
|
 XLY Weekly Chart |
|
| Long Term Trend: Very Good | |
| Medium Term Trend: Good | |
 XLY Daily Chart |
|
| Short Term Trend: Very Good | |
| Overall Trend Score: 100 | |
| YTD Performance: 9.2482% | |
| **Trend Scores & Views Are Only For Educational Purposes And Not For Investing | |
| 12Stocks.com: Top Performing Consumer Services Sector Stocks | ||||||||||||||||||||||||||||||||||||||||||||||||
 The top performing Consumer Services sector stocks year to date are
Now, more recently, over last week, the top performing Consumer Services sector stocks on the move are


|
||||||||||||||||||||||||||||||||||||||||||||||||
| 12Stocks.com: Investing in Consumer Services Sector using Exchange Traded Funds | |
|
The following table shows list of key exchange traded funds (ETF) that
help investors track Consumer Services Index. For detailed view, check out our ETF Funds section of our website. Quick View: Move mouse or cursor over ETF symbol (ticker) to view short-term Technical chart and over ETF name to view long term chart. Click on ticker or stock name for detailed view. Click on to add stock symbol to your watchlist and to view watchlist. |
12Stocks.com List of ETFs that track Consumer Services Index
| Ticker | ETF Name | Watchlist | Recent Price | Smart Investing & Trading Score | Change % | Week % | Year-to-date % |
| PMR | Retail | | 40.96 | 70 | -0.0244081 | 2.86288 | 0% |
| 12Stocks.com: Charts, Trends, Fundamental Data and Performances of Consumer Services Stocks | |
|
We now take in-depth look at all Consumer Services stocks including charts, multi-period performances and overall trends (as measured by Smart Investing & Trading Score). One can sort Consumer Services stocks (click link to choose) by Daily, Weekly and by Year-to-Date performances. Also, one can sort by size of the company or by market capitalization. |
| Select Your Default Chart Type: | |||||
| |||||
| Click on stock symbol or name for detailed view. Click on to add stock symbol to your watchlist and to view watchlist. Quick View: Move mouse or cursor over "Daily" to quickly view daily Technical stock chart and over "Weekly" to view weekly Technical stock chart. | |||||

 | JMEI Jumei International Holding Limited |
| Sector: Services & Goods | |
| SubSector: Specialty Retail, Other | |
| MarketCap: 207.144 Millions | |
| Recent Price: 17.90 Smart Investing & Trading Score: 80 | |
| Day Percent Change: -0.334076% Day Change: -9999 | |
| Week Change: 2.6965% Year-to-date Change: 0.0% | |
| JMEI Links: Profile News Message Board | |
| Charts:- Daily , Weekly | |
| Add JMEI to Watchlist: View: Get Complete JMEI Trend Analysis ➞ | |
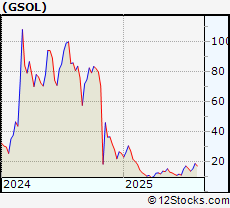 | GSOL Global Sources Ltd. |
| Sector: Services & Goods | |
| SubSector: Business Services | |
| MarketCap: 204.21 Millions | |
| Recent Price: 16.92 Smart Investing & Trading Score: 40 | |
| Day Percent Change: 13.1016% Day Change: -9999 | |
| Week Change: 17.9094% Year-to-date Change: -28.2% | |
| GSOL Links: Profile News Message Board | |
| Charts:- Daily , Weekly | |
| Add GSOL to Watchlist: View: Get Complete GSOL Trend Analysis ➞ | |
 | REIS Reis, Inc. |
| Sector: Services & Goods | |
| SubSector: Business Services | |
| MarketCap: 203.96 Millions | |
| Recent Price: 395.17 Smart Investing & Trading Score: 70 | |
| Day Percent Change: 0.795817% Day Change: -9999 | |
| Week Change: 1734.59% Year-to-date Change: 0.0% | |
| REIS Links: Profile News Message Board | |
| Charts:- Daily , Weekly | |
| Add REIS to Watchlist: View: Get Complete REIS Trend Analysis ➞ | |
 | HBB Hamilton Beach Brands Holding Co |
| Sector: Services & Goods | |
| SubSector: Furnishings, Fixtures & Appliances | |
| MarketCap: 203.64 Millions | |
| Recent Price: 14.57 Smart Investing & Trading Score: 20 | |
| Day Percent Change: -0.410116% Day Change: 0.98 | |
| Week Change: -3.70126% Year-to-date Change: -9.2% | |
| HBB Links: Profile News Message Board | |
| Charts:- Daily , Weekly | |
| Add HBB to Watchlist: View: Get Complete HBB Trend Analysis ➞ | |
 | RUSHB Rush Enterprises, Inc. |
| Sector: Services & Goods | |
| SubSector: Auto Dealerships | |
| MarketCap: 203.221 Millions | |
| Recent Price: 58.50 Smart Investing & Trading Score: 80 | |
| Day Percent Change: 1.17606% Day Change: 0.21 | |
| Week Change: -1.11562% Year-to-date Change: 9.7% | |
| RUSHB Links: Profile News Message Board | |
| Charts:- Daily , Weekly | |
| Add RUSHB to Watchlist: View: Get Complete RUSHB Trend Analysis ➞ | |
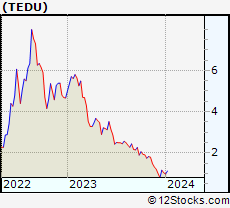 | TEDU Tarena International, Inc. |
| Sector: Services & Goods | |
| SubSector: Education & Training Services | |
| MarketCap: 203.206 Millions | |
| Recent Price: 1.76 Smart Investing & Trading Score: 60 | |
| Day Percent Change: 3.52941% Day Change: -9999 | |
| Week Change: 10.6918% Year-to-date Change: 0.0% | |
| TEDU Links: Profile News Message Board | |
| Charts:- Daily , Weekly | |
| Add TEDU to Watchlist: View: Get Complete TEDU Trend Analysis ➞ | |
 | MB Masterbeef Group |
| Sector: Services & Goods | |
| SubSector: Restaurants | |
| MarketCap: 199.91 Millions | |
| Recent Price: 10.50 Smart Investing & Trading Score: 60 | |
| Day Percent Change: 12.2995% Day Change: -0.19 | |
| Week Change: -9.87124% Year-to-date Change: 156.1% | |
| MB Links: Profile News Message Board | |
| Charts:- Daily , Weekly | |
| Add MB to Watchlist: View: Get Complete MB Trend Analysis ➞ | |
 | COOK Traeger Inc |
| Sector: Services & Goods | |
| SubSector: Furnishings, Fixtures & Appliances | |
| MarketCap: 199.75 Millions | |
| Recent Price: 1.33 Smart Investing & Trading Score: 40 | |
| Day Percent Change: 2.30769% Day Change: -0.01 | |
| Week Change: -9.52381% Year-to-date Change: -44.1% | |
| COOK Links: Profile News Message Board | |
| Charts:- Daily , Weekly | |
| Add COOK to Watchlist: View: Get Complete COOK Trend Analysis ➞ | |
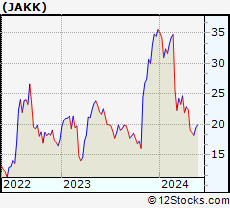 | JAKK Jakks Pacific Inc |
| Sector: Services & Goods | |
| SubSector: Leisure | |
| MarketCap: 196.18 Millions | |
| Recent Price: 18.07 Smart Investing & Trading Score: 80 | |
| Day Percent Change: 1.06264% Day Change: 0.08 | |
| Week Change: 2.67045% Year-to-date Change: -34.2% | |
| JAKK Links: Profile News Message Board | |
| Charts:- Daily , Weekly | |
| Add JAKK to Watchlist: View: Get Complete JAKK Trend Analysis ➞ | |
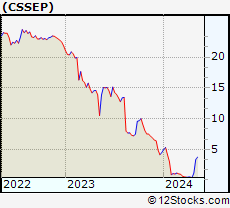 | CSSEP Chicken Soup for the Soul Entertainment, Inc. |
| Sector: Services & Goods | |
| SubSector: Broadcasting - TV | |
| MarketCap: 195.763 Millions | |
| Recent Price: 0.40 Smart Investing & Trading Score: 10 | |
| Day Percent Change: 6.66667% Day Change: -9999 | |
| Week Change: -67.4797% Year-to-date Change: 0.0% | |
| CSSEP Links: Profile News Message Board | |
| Charts:- Daily , Weekly | |
| Add CSSEP to Watchlist: View: Get Complete CSSEP Trend Analysis ➞ | |
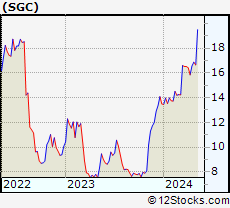 | SGC SuperiorGroup of Companies Inc |
| Sector: Services & Goods | |
| SubSector: Apparel Manufacturing | |
| MarketCap: 194.97 Millions | |
| Recent Price: 11.19 Smart Investing & Trading Score: 30 | |
| Day Percent Change: -5.08906% Day Change: -0.12 | |
| Week Change: -8.35381% Year-to-date Change: -29.3% | |
| SGC Links: Profile News Message Board | |
| Charts:- Daily , Weekly | |
| Add SGC to Watchlist: View: Get Complete SGC Trend Analysis ➞ | |
 | ELA Envela Corp |
| Sector: Services & Goods | |
| SubSector: Luxury Goods | |
| MarketCap: 194.48 Millions | |
| Recent Price: 7.43 Smart Investing & Trading Score: 70 | |
| Day Percent Change: 5.39007% Day Change: -0.02 | |
| Week Change: 1.22616% Year-to-date Change: 5.2% | |
| ELA Links: Profile News Message Board | |
| Charts:- Daily , Weekly | |
| Add ELA to Watchlist: View: Get Complete ELA Trend Analysis ➞ | |
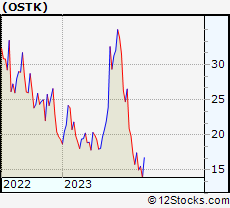 | OSTK Overstock.com, Inc. |
| Sector: Services & Goods | |
| SubSector: Catalog & Mail Order Houses | |
| MarketCap: 194.092 Millions | |
| Recent Price: 46.50 Smart Investing & Trading Score: 70 | |
| Day Percent Change: 0.301984% Day Change: -9999 | |
| Week Change: 36.5639% Year-to-date Change: 0.0% | |
| OSTK Links: Profile News Message Board | |
| Charts:- Daily , Weekly | |
| Add OSTK to Watchlist: View: Get Complete OSTK Trend Analysis ➞ | |
 | ASCMA Ascent Capital Group, Inc. |
| Sector: Services & Goods | |
| SubSector: Security & Protection Services | |
| MarketCap: 191.49 Millions | |
| Recent Price: 6.33 Smart Investing & Trading Score: 70 | |
| Day Percent Change: 7.28814% Day Change: -9999 | |
| Week Change: 56.6832% Year-to-date Change: 0.0% | |
| ASCMA Links: Profile News Message Board | |
| Charts:- Daily , Weekly | |
| Add ASCMA to Watchlist: View: Get Complete ASCMA Trend Analysis ➞ | |
 | BZUN Baozun Inc ADR |
| Sector: Services & Goods | |
| SubSector: Internet Retail | |
| MarketCap: 190.99 Millions | |
| Recent Price: 4.60 Smart Investing & Trading Score: 90 | |
| Day Percent Change: -3.56394% Day Change: 0.07 | |
| Week Change: 28.4916% Year-to-date Change: 66.1% | |
| BZUN Links: Profile News Message Board | |
| Charts:- Daily , Weekly | |
| Add BZUN to Watchlist: View: Get Complete BZUN Trend Analysis ➞ | |
 | CURV Torrid Holdings Inc |
| Sector: Services & Goods | |
| SubSector: Apparel Retail | |
| MarketCap: 187.03 Millions | |
| Recent Price: 1.84 Smart Investing & Trading Score: 30 | |
| Day Percent Change: -3.66492% Day Change: 0.03 | |
| Week Change: 3.37079% Year-to-date Change: -65.2% | |
| CURV Links: Profile News Message Board | |
| Charts:- Daily , Weekly | |
| Add CURV to Watchlist: View: Get Complete CURV Trend Analysis ➞ | |
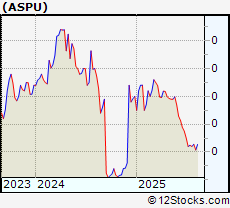 | ASPU Aspen Group, Inc. |
| Sector: Services & Goods | |
| SubSector: Education & Training Services | |
| MarketCap: 183.506 Millions | |
| Recent Price: 0.06 Smart Investing & Trading Score: 60 | |
| Day Percent Change: 6.16667% Day Change: -9999 | |
| Week Change: 3.91517% Year-to-date Change: -54.5% | |
| ASPU Links: Profile News Message Board | |
| Charts:- Daily , Weekly | |
| Add ASPU to Watchlist: View: Get Complete ASPU Trend Analysis ➞ | |
 | HIBB Hibbett Sports, Inc. |
| Sector: Services & Goods | |
| SubSector: Sporting Goods Stores | |
| MarketCap: 183 Millions | |
| Recent Price: 66.01 Smart Investing & Trading Score: 0 | |
| Day Percent Change: 0.640342% Day Change: -9999 | |
| Week Change: -24.5428% Year-to-date Change: 0.0% | |
| HIBB Links: Profile News Message Board | |
| Charts:- Daily , Weekly | |
| Add HIBB to Watchlist: View: Get Complete HIBB Trend Analysis ➞ | |
 | FNKO Funko Inc |
| Sector: Services & Goods | |
| SubSector: Leisure | |
| MarketCap: 181.04 Millions | |
| Recent Price: 3.34 Smart Investing & Trading Score: 50 | |
| Day Percent Change: 0.3003% Day Change: 0.25 | |
| Week Change: 2.14067% Year-to-date Change: -75.5% | |
| FNKO Links: Profile News Message Board | |
| Charts:- Daily , Weekly | |
| Add FNKO to Watchlist: View: Get Complete FNKO Trend Analysis ➞ | |
 | WBAI 500.com Limited |
| Sector: Services & Goods | |
| SubSector: Gaming Activities | |
| MarketCap: 179.289 Millions | |
| Recent Price: 81.70 Smart Investing & Trading Score: 20 | |
| Day Percent Change: -13.7276% Day Change: -9999 | |
| Week Change: 3.28698% Year-to-date Change: 0.0% | |
| WBAI Links: Profile News Message Board | |
| Charts:- Daily , Weekly | |
| Add WBAI to Watchlist: View: Get Complete WBAI Trend Analysis ➞ | |
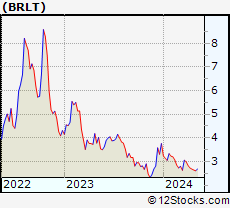 | BRLT Brilliant Earth Group Inc |
| Sector: Services & Goods | |
| SubSector: Luxury Goods | |
| MarketCap: 178.05 Millions | |
| Recent Price: 2.36 Smart Investing & Trading Score: 53 | |
| Day Percent Change: 0% Day Change: 0 | |
| Week Change: 5.61% Year-to-date Change: 7.6% | |
| BRLT Links: Profile News Message Board | |
| Charts:- Daily , Weekly | |
| Add BRLT to Watchlist: View: Get Complete BRLT Trend Analysis ➞ | |
 | ESCA Escalade, Inc |
| Sector: Services & Goods | |
| SubSector: Leisure | |
| MarketCap: 177.52 Millions | |
| Recent Price: 12.55 Smart Investing & Trading Score: 30 | |
| Day Percent Change: 1.20968% Day Change: -0.01 | |
| Week Change: -2.41058% Year-to-date Change: -12.3% | |
| ESCA Links: Profile News Message Board | |
| Charts:- Daily , Weekly | |
| Add ESCA to Watchlist: View: Get Complete ESCA Trend Analysis ➞ | |
 | UEPS Net 1 UEPS Technologies, Inc. |
| Sector: Services & Goods | |
| SubSector: Business Services | |
| MarketCap: 176.882 Millions | |
| Recent Price: 5.90 Smart Investing & Trading Score: 100 | |
| Day Percent Change: 9.46197% Day Change: -9999 | |
| Week Change: 11.3208% Year-to-date Change: 0.0% | |
| UEPS Links: Profile News Message Board | |
| Charts:- Daily , Weekly | |
| Add UEPS to Watchlist: View: Get Complete UEPS Trend Analysis ➞ | |
 | FUEL Rocket Fuel Inc. |
| Sector: Services & Goods | |
| SubSector: Advertising Agencies | |
| MarketCap: 175.5 Millions | |
| Recent Price: 14.23 Smart Investing & Trading Score: 80 | |
| Day Percent Change: 3.86861% Day Change: -9999 | |
| Week Change: 508.12% Year-to-date Change: 0.0% | |
| FUEL Links: Profile News Message Board | |
| Charts:- Daily , Weekly | |
| Add FUEL to Watchlist: View: Get Complete FUEL Trend Analysis ➞ | |
 | JCP J. C. Penney Company, Inc. |
| Sector: Services & Goods | |
| SubSector: Department Stores | |
| MarketCap: 175 Millions | |
| Recent Price: 59.28 Smart Investing & Trading Score: 20 | |
| Day Percent Change: 1.50685% Day Change: -9999 | |
| Week Change: -41.3824% Year-to-date Change: 0.0% | |
| JCP Links: Profile News Message Board | |
| Charts:- Daily , Weekly | |
| Add JCP to Watchlist: View: Get Complete JCP Trend Analysis ➞ | |
| For tabular summary view of above stock list: Summary View ➞ 0 - 25 , 25 - 50 , 50 - 75 , 75 - 100 , 100 - 125 , 125 - 150 , 150 - 175 , 175 - 200 , 200 - 225 , 225 - 250 , 250 - 275 , 275 - 300 , 300 - 325 , 325 - 350 , 350 - 375 , 375 - 400 , 400 - 425 , 425 - 450 , 450 - 475 , 475 - 500 , 500 - 525 , 525 - 550 , 550 - 575 , 575 - 600 , 600 - 625 | ||
| Click To Change The Sort Order: By Market Cap or Company Size Performance: Year-to-date, Week and Day | |
| Select Chart Type: | ||
|
Best Stocks Today 12Stocks.com |
© 2025 12Stocks.com Terms & Conditions Privacy Contact Us
All Information Provided Only For Education And Not To Be Used For Investing or Trading. See Terms & Conditions


One More Thing ... Get Best Stocks Delivered Daily!
Never Ever Miss A Move With Our Top Ten Stocks Lists
Find Best Stocks In Any Market - Bull or Bear Market
Take A Peek At Our Top Ten Stocks Lists: Daily, Weekly, Year-to-Date & Top Trends
Find Best Stocks In Any Market - Bull or Bear Market
Take A Peek At Our Top Ten Stocks Lists: Daily, Weekly, Year-to-Date & Top Trends
Consumer Services Stocks With Best Up Trends [0-bearish to 100-bullish]: Whole Foods[100], Net 1[100], LiveWire [100], Denny's Corp[100], Ermenegildo Zegna[100], Revolve [100], Therealreal [100], Carters [100], Resources Connection[100], Sally Beauty[100], Advance Auto[100]
Best Consumer Services Stocks Year-to-Date:
WW [1871.33%], Nova Lifestyle[690.41%], ThredUp [665.957%], Lucid [554.785%], Vroom [455.146%], China Yuchai[297.742%], Luxottica [210.802%], Cooper-Standard [190.99%], Masterbeef [156.098%], Jumia Technologies[151.026%], Niu Technologies[136.782%] Best Consumer Services Stocks This Week:
Party City[37593.9%], Companhia Brasileira[18587.4%], Conn s[16420.1%], Rite Aid[10214.6%], Arctic Cat[2387.5%], Chico s[2120.53%], Multi-Color [2063.68%], Reis [1734.59%], Quotient Technology[954.386%], Express [946.725%], Volt Information[705.085%] Best Consumer Services Stocks Daily:
Container Store[22.6852%], SUPERVALU [20.4138%], Irobot Corp[15.4971%], World Wrestling[14.734%], Global Sources[13.1016%], Masterbeef [12.2995%], Whole Foods[11.8363%], iClick Interactive[10%], Net 1[9.46197%], LiveWire [9.09091%], Peloton Interactive[8.17942%]