
 Login Sign Up


| |||||
 |  | ||||

| 12Stocks.com Market Intelligence |
Best Consumer Services Stocks
| In a hurry? Services & Goods Stocks: Performance Trends Table, Stock Charts
Sort Consumer Services: Daily, Weekly, Year-to-Date, Market Cap & Trends. Filter Services & Goods stocks list by size: All Large Mid-Range Small |
| 12Stocks.com Consumer Services Stocks Performances & Trends Daily | |||||||||
|
|  The overall Smart Investing & Trading Score is 100 (0-bearish to 100-bullish) which puts Consumer Services sector in short term bullish trend. The Smart Investing & Trading Score from previous trading session is 50 and an improvement of trend continues.
| ||||||||
Here are the Smart Investing & Trading Scores of the most requested Consumer Services stocks at 12Stocks.com (click stock name for detailed review):
|


| Consider signing up for our daily 12Stocks.com "Best Stocks Newsletter". You will never ever miss a big stock move again! |
| 12Stocks.com: Investing in Consumer Services sector with Stocks | |
|
The following table helps investors and traders sort through current performance and trends (as measured by Smart Investing & Trading Score) of various
stocks in the Consumer Services sector. Quick View: Move mouse or cursor over stock symbol (ticker) to view short-term Technical chart and over stock name to view long term chart. Click on  to add stock symbol to your watchlist and to add stock symbol to your watchlist and  to view watchlist. Click on any ticker or stock name for detailed market intelligence report for that stock. to view watchlist. Click on any ticker or stock name for detailed market intelligence report for that stock. |
12Stocks.com Performance of Stocks in Consumer Services Sector
| Ticker | Stock Name | Watchlist | Category | Recent Price | Smart Investing & Trading Score | Change % | YTD Change% |
| CMLS | Cumulus Media |   | Broadcasting | 0.16 | 40 | -2.81 | -78.70% |
| WHR | Whirlpool Corp | | Furnishings, Fixtures & Appliances | 89.50 | 20 | -2.82 | -19.17% |
| MNRO | Monro | | Auto Parts | 17.31 | 80 | -2.86 | -27.07% |
| MMYT | MakeMyTrip | | Travel Services | 97.81 | 20 | -2.87 | -15.85% |
| VC | Visteon Corp | | Auto Parts | 124.59 | 40 | -2.88 | 43.52% |
| HZO | Marinemax | | Specialty Retail | 25.92 | 50 | -2.88 | -7.46% |
| CAKE | Cheesecake Factory | | Restaurants | 56.53 | 0 | -2.89 | 18.30% |
| MPX | Marine Products | | Recreational | 9.02 | 70 | -2.91 | 4.78% |
| LEN | Lennar Corp | | Residential Construction | 133.25 | 40 | -2.93 | 12.58% |
| NWY | New York | | Apparel | 24.83 | 80 | -2.93 | 0.00% |
| OSW | OneSpaWorld | | Leisure | 21.82 | 10 | -2.94 | 13.15% |
| LOCO | El Pollo | | Restaurants | 10.12 | 0 | -2.97 | -11.31% |
| AXL | American Axle | | Auto Parts | 5.87 | 40 | -2.98 | 1.91% |
| TPH | Tri Pointe | | Residential Construction | 35.27 | 40 | -3.00 | -1.73% |
| PENN | PENN Entertainment | | Casinos | 19.02 | 30 | -3.01 | -1.14% |
| FIGS | Figs | | Apparel Manufacturing | 7.08 | 80 | -3.01 | 20.20% |
| LVWR | LiveWire | | Auto Manufacturers | 4.84 | 100 | -3.01 | 1.47% |
| PATK | Patrick Industries | | Furnishings, Fixtures & Appliances | 110.37 | 40 | -3.02 | 35.57% |
| CHA | Chagee | | Restaurants | 16.64 | 10 | -3.03 | -40.57% |
| VIRC | Virco | | Furnishings, Fixtures & Appliances | 7.97 | 20 | -3.04 | -21.26% |
| UXIN | Uxin | | Auto & Truck Dealerships | 3.50 | 50 | -3.05 | -25.37% |
| SHAK | Shake Shack | | Restaurants | 100.77 | 40 | -3.08 | -24.39% |
| ACVA | ACV Auctions | | Auto & Truck Dealerships | 10.01 | 0 | -3.10 | -52.20% |
| CPS | Cooper-Standard | | Auto Parts | 37.85 | 60 | -3.12 | 181.83% |
| LCID | Lucid | | Auto Manufacturers | 19.27 | 60 | -3.14 | 536.14% |
| For chart view version of above stock list: Chart View ➞ 0 - 25 , 25 - 50 , 50 - 75 , 75 - 100 , 100 - 125 , 125 - 150 , 150 - 175 , 175 - 200 , 200 - 225 , 225 - 250 , 250 - 275 , 275 - 300 , 300 - 325 , 325 - 350 , 350 - 375 , 375 - 400 , 400 - 425 , 425 - 450 , 450 - 475 , 475 - 500 , 500 - 525 , 525 - 550 , 550 - 575 , 575 - 600 , 600 - 625 | ||
 | Click To Change The Sort Order: By Market Cap or Company Size Performance: Year-to-date, Week and Day |  |
|
Get the most comprehensive stock market coverage daily at 12Stocks.com ➞ Best Stocks Today ➞ Best Stocks Weekly ➞ Best Stocks Year-to-Date ➞ Best Stocks Trends ➞  Best Stocks Today 12Stocks.com Best Nasdaq Stocks ➞ Best S&P 500 Stocks ➞ Best Tech Stocks ➞ Best Biotech Stocks ➞ |
| Detailed Overview of Consumer Services Stocks |
| Consumer Services Technical Overview, Leaders & Laggards, Top Consumer Services ETF Funds & Detailed Consumer Services Stocks List, Charts, Trends & More |
| Consumer Services Sector: Technical Analysis, Trends & YTD Performance | |
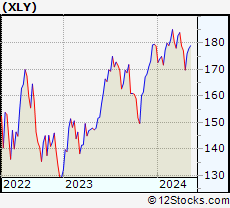
| Consumer Services sector is composed of stocks
from retail, entertainment, media/publishing, consumer goods
and services subsectors. Consumer Services sector, as represented by XLY, an exchange-traded fund [ETF] that holds basket of Consumer Services stocks (e.g, Walmart, Alibaba) is up by 9.20735% and is currently underperforming the overall market by -4.07855% year-to-date. Below is a quick view of Technical charts and trends: |
|
 XLY Weekly Chart |
|
| Long Term Trend: Very Good | |
| Medium Term Trend: Good | |
 XLY Daily Chart |
|
| Short Term Trend: Very Good | |
| Overall Trend Score: 100 | |
| YTD Performance: 9.20735% | |
| **Trend Scores & Views Are Only For Educational Purposes And Not For Investing | |
| 12Stocks.com: Top Performing Consumer Services Sector Stocks | ||||||||||||||||||||||||||||||||||||||||||||||||
 The top performing Consumer Services sector stocks year to date are
Now, more recently, over last week, the top performing Consumer Services sector stocks on the move are


|
||||||||||||||||||||||||||||||||||||||||||||||||
| 12Stocks.com: Investing in Consumer Services Sector using Exchange Traded Funds | |
|
The following table shows list of key exchange traded funds (ETF) that
help investors track Consumer Services Index. For detailed view, check out our ETF Funds section of our website. Quick View: Move mouse or cursor over ETF symbol (ticker) to view short-term Technical chart and over ETF name to view long term chart. Click on ticker or stock name for detailed view. Click on to add stock symbol to your watchlist and to view watchlist. |
12Stocks.com List of ETFs that track Consumer Services Index
| Ticker | ETF Name | Watchlist | Recent Price | Smart Investing & Trading Score | Change % | Week % | Year-to-date % |
| PMR | Retail | | 40.96 | 70 | -0.0244081 | 2.86288 | 0% |
| 12Stocks.com: Charts, Trends, Fundamental Data and Performances of Consumer Services Stocks | |
|
We now take in-depth look at all Consumer Services stocks including charts, multi-period performances and overall trends (as measured by Smart Investing & Trading Score). One can sort Consumer Services stocks (click link to choose) by Daily, Weekly and by Year-to-Date performances. Also, one can sort by size of the company or by market capitalization. |
| Select Your Default Chart Type: | |||||
| |||||
| Click on stock symbol or name for detailed view. Click on to add stock symbol to your watchlist and to view watchlist. Quick View: Move mouse or cursor over "Daily" to quickly view daily Technical stock chart and over "Weekly" to view weekly Technical stock chart. | |||||

 | CMLS Cumulus Media Inc. |
| Sector: Services & Goods | |
| SubSector: Broadcasting - Radio | |
| MarketCap: 128.695 Millions | |
| Recent Price: 0.16 Smart Investing & Trading Score: 40 | |
| Day Percent Change: -2.8125% Day Change: -9999 | |
| Week Change: -8.52941% Year-to-date Change: -78.7% | |
| CMLS Links: Profile News Message Board | |
| Charts:- Daily , Weekly | |
| Add CMLS to Watchlist: View: Get Complete CMLS Trend Analysis ➞ | |
 | WHR Whirlpool Corp |
| Sector: Services & Goods | |
| SubSector: Furnishings, Fixtures & Appliances | |
| MarketCap: 5278.67 Millions | |
| Recent Price: 89.50 Smart Investing & Trading Score: 20 | |
| Day Percent Change: -2.82302% Day Change: -2.6 | |
| Week Change: -5.23083% Year-to-date Change: -19.2% | |
| WHR Links: Profile News Message Board | |
| Charts:- Daily , Weekly | |
| Add WHR to Watchlist: View: Get Complete WHR Trend Analysis ➞ | |
 | MNRO Monro Inc |
| Sector: Services & Goods | |
| SubSector: Auto Parts | |
| MarketCap: 530.03 Millions | |
| Recent Price: 17.31 Smart Investing & Trading Score: 80 | |
| Day Percent Change: -2.86195% Day Change: -0.35 | |
| Week Change: 0.815376% Year-to-date Change: -27.1% | |
| MNRO Links: Profile News Message Board | |
| Charts:- Daily , Weekly | |
| Add MNRO to Watchlist: View: Get Complete MNRO Trend Analysis ➞ | |
 | MMYT MakeMyTrip Ltd |
| Sector: Services & Goods | |
| SubSector: Travel Services | |
| MarketCap: 9557.55 Millions | |
| Recent Price: 97.81 Smart Investing & Trading Score: 20 | |
| Day Percent Change: -2.86991% Day Change: -1.42 | |
| Week Change: -2.27795% Year-to-date Change: -15.8% | |
| MMYT Links: Profile News Message Board | |
| Charts:- Daily , Weekly | |
| Add MMYT to Watchlist: View: Get Complete MMYT Trend Analysis ➞ | |
 | VC Visteon Corp |
| Sector: Services & Goods | |
| SubSector: Auto Parts | |
| MarketCap: 3413.09 Millions | |
| Recent Price: 124.59 Smart Investing & Trading Score: 40 | |
| Day Percent Change: -2.87652% Day Change: -0.17 | |
| Week Change: -0.645933% Year-to-date Change: 43.5% | |
| VC Links: Profile News Message Board | |
| Charts:- Daily , Weekly | |
| Add VC to Watchlist: View: Get Complete VC Trend Analysis ➞ | |
 | HZO Marinemax, Inc |
| Sector: Services & Goods | |
| SubSector: Specialty Retail | |
| MarketCap: 567.93 Millions | |
| Recent Price: 25.92 Smart Investing & Trading Score: 50 | |
| Day Percent Change: -2.88498% Day Change: -0.35 | |
| Week Change: -0.727691% Year-to-date Change: -7.5% | |
| HZO Links: Profile News Message Board | |
| Charts:- Daily , Weekly | |
| Add HZO to Watchlist: View: Get Complete HZO Trend Analysis ➞ | |
 | CAKE Cheesecake Factory Inc |
| Sector: Services & Goods | |
| SubSector: Restaurants | |
| MarketCap: 3020.01 Millions | |
| Recent Price: 56.53 Smart Investing & Trading Score: 0 | |
| Day Percent Change: -2.8861% Day Change: 0.21 | |
| Week Change: -7.44925% Year-to-date Change: 18.3% | |
| CAKE Links: Profile News Message Board | |
| Charts:- Daily , Weekly | |
| Add CAKE to Watchlist: View: Get Complete CAKE Trend Analysis ➞ | |
 | MPX Marine Products Corp |
| Sector: Services & Goods | |
| SubSector: Recreational Vehicles | |
| MarketCap: 318.11 Millions | |
| Recent Price: 9.02 Smart Investing & Trading Score: 70 | |
| Day Percent Change: -2.90635% Day Change: -0.09 | |
| Week Change: -2.38095% Year-to-date Change: 4.8% | |
| MPX Links: Profile News Message Board | |
| Charts:- Daily , Weekly | |
| Add MPX to Watchlist: View: Get Complete MPX Trend Analysis ➞ | |
 | LEN Lennar Corp |
| Sector: Services & Goods | |
| SubSector: Residential Construction | |
| MarketCap: 36567.6 Millions | |
| Recent Price: 133.25 Smart Investing & Trading Score: 40 | |
| Day Percent Change: -2.92853% Day Change: -4.02 | |
| Week Change: -6.0826% Year-to-date Change: 12.6% | |
| LEN Links: Profile News Message Board | |
| Charts:- Daily , Weekly | |
| Add LEN to Watchlist: View: Get Complete LEN Trend Analysis ➞ | |
 | NWY New York & Company, Inc. |
| Sector: Services & Goods | |
| SubSector: Apparel Stores | |
| MarketCap: 144.35 Millions | |
| Recent Price: 24.83 Smart Investing & Trading Score: 80 | |
| Day Percent Change: -2.93198% Day Change: -9999 | |
| Week Change: 23.1647% Year-to-date Change: 0.0% | |
| NWY Links: Profile News Message Board | |
| Charts:- Daily , Weekly | |
| Add NWY to Watchlist: View: Get Complete NWY Trend Analysis ➞ | |
 | OSW OneSpaWorld Holdings Limited |
| Sector: Services & Goods | |
| SubSector: Leisure | |
| MarketCap: 2255.23 Millions | |
| Recent Price: 21.82 Smart Investing & Trading Score: 10 | |
| Day Percent Change: -2.93594% Day Change: 0.25 | |
| Week Change: -1.40081% Year-to-date Change: 13.1% | |
| OSW Links: Profile News Message Board | |
| Charts:- Daily , Weekly | |
| Add OSW to Watchlist: View: Get Complete OSW Trend Analysis ➞ | |
 | LOCO El Pollo Loco Holdings Inc |
| Sector: Services & Goods | |
| SubSector: Restaurants | |
| MarketCap: 313.75 Millions | |
| Recent Price: 10.12 Smart Investing & Trading Score: 0 | |
| Day Percent Change: -2.9722% Day Change: 0.01 | |
| Week Change: -2.59865% Year-to-date Change: -11.3% | |
| LOCO Links: Profile News Message Board | |
| Charts:- Daily , Weekly | |
| Add LOCO to Watchlist: View: Get Complete LOCO Trend Analysis ➞ | |
 | AXL American Axle & Manufacturing Holdings Inc |
| Sector: Services & Goods | |
| SubSector: Auto Parts | |
| MarketCap: 706.05 Millions | |
| Recent Price: 5.87 Smart Investing & Trading Score: 40 | |
| Day Percent Change: -2.97521% Day Change: 0.09 | |
| Week Change: -1.83946% Year-to-date Change: 1.9% | |
| AXL Links: Profile News Message Board | |
| Charts:- Daily , Weekly | |
| Add AXL to Watchlist: View: Get Complete AXL Trend Analysis ➞ | |
 | TPH Tri Pointe Homes Inc |
| Sector: Services & Goods | |
| SubSector: Residential Construction | |
| MarketCap: 3249.99 Millions | |
| Recent Price: 35.27 Smart Investing & Trading Score: 40 | |
| Day Percent Change: -2.9978% Day Change: -0.03 | |
| Week Change: -2.86422% Year-to-date Change: -1.7% | |
| TPH Links: Profile News Message Board | |
| Charts:- Daily , Weekly | |
| Add TPH to Watchlist: View: Get Complete TPH Trend Analysis ➞ | |
 | PENN PENN Entertainment Inc |
| Sector: Services & Goods | |
| SubSector: Resorts & Casinos | |
| MarketCap: 2988.72 Millions | |
| Recent Price: 19.02 Smart Investing & Trading Score: 30 | |
| Day Percent Change: -3.00867% Day Change: -0.59 | |
| Week Change: -7.08354% Year-to-date Change: -1.1% | |
| PENN Links: Profile News Message Board | |
| Charts:- Daily , Weekly | |
| Add PENN to Watchlist: View: Get Complete PENN Trend Analysis ➞ | |
 | FIGS Figs Inc |
| Sector: Services & Goods | |
| SubSector: Apparel Manufacturing | |
| MarketCap: 1124.95 Millions | |
| Recent Price: 7.08 Smart Investing & Trading Score: 80 | |
| Day Percent Change: -3.0137% Day Change: -0.21 | |
| Week Change: 3.66032% Year-to-date Change: 20.2% | |
| FIGS Links: Profile News Message Board | |
| Charts:- Daily , Weekly | |
| Add FIGS to Watchlist: View: Get Complete FIGS Trend Analysis ➞ | |
 | LVWR LiveWire Group Inc |
| Sector: Services & Goods | |
| SubSector: Auto Manufacturers | |
| MarketCap: 721.23 Millions | |
| Recent Price: 4.84 Smart Investing & Trading Score: 100 | |
| Day Percent Change: -3.00601% Day Change: 0.16 | |
| Week Change: 34.072% Year-to-date Change: 1.5% | |
| LVWR Links: Profile News Message Board | |
| Charts:- Daily , Weekly | |
| Add LVWR to Watchlist: View: Get Complete LVWR Trend Analysis ➞ | |
 | PATK Patrick Industries, Inc |
| Sector: Services & Goods | |
| SubSector: Furnishings, Fixtures & Appliances | |
| MarketCap: 3779.13 Millions | |
| Recent Price: 110.37 Smart Investing & Trading Score: 40 | |
| Day Percent Change: -3.02258% Day Change: -0.05 | |
| Week Change: -3.23514% Year-to-date Change: 35.6% | |
| PATK Links: Profile News Message Board | |
| Charts:- Daily , Weekly | |
| Add PATK to Watchlist: View: Get Complete PATK Trend Analysis ➞ | |
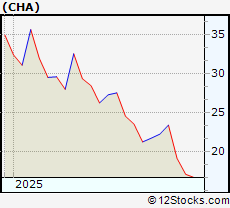 | CHA Chagee Holdings Ltd. ADR |
| Sector: Services & Goods | |
| SubSector: Restaurants | |
| MarketCap: 2019.04 Millions | |
| Recent Price: 16.64 Smart Investing & Trading Score: 10 | |
| Day Percent Change: -3.0303% Day Change: 0.24 | |
| Week Change: -6.72646% Year-to-date Change: -40.6% | |
| CHA Links: Profile News Message Board | |
| Charts:- Daily , Weekly | |
| Add CHA to Watchlist: View: Get Complete CHA Trend Analysis ➞ | |
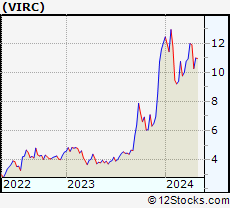 | VIRC Virco Manufacturing Corp |
| Sector: Services & Goods | |
| SubSector: Furnishings, Fixtures & Appliances | |
| MarketCap: 138.81 Millions | |
| Recent Price: 7.97 Smart Investing & Trading Score: 20 | |
| Day Percent Change: -3.04136% Day Change: 0 | |
| Week Change: -8.07382% Year-to-date Change: -21.3% | |
| VIRC Links: Profile News Message Board | |
| Charts:- Daily , Weekly | |
| Add VIRC to Watchlist: View: Get Complete VIRC Trend Analysis ➞ | |
 | UXIN Uxin Ltd ADR |
| Sector: Services & Goods | |
| SubSector: Auto & Truck Dealerships | |
| MarketCap: 721.11 Millions | |
| Recent Price: 3.50 Smart Investing & Trading Score: 50 | |
| Day Percent Change: -3.04709% Day Change: 0.1 | |
| Week Change: -1.12994% Year-to-date Change: -25.4% | |
| UXIN Links: Profile News Message Board | |
| Charts:- Daily , Weekly | |
| Add UXIN to Watchlist: View: Get Complete UXIN Trend Analysis ➞ | |
 | SHAK Shake Shack Inc |
| Sector: Services & Goods | |
| SubSector: Restaurants | |
| MarketCap: 4276.44 Millions | |
| Recent Price: 100.77 Smart Investing & Trading Score: 40 | |
| Day Percent Change: -3.07781% Day Change: -2.1 | |
| Week Change: -1.07981% Year-to-date Change: -24.4% | |
| SHAK Links: Profile News Message Board | |
| Charts:- Daily , Weekly | |
| Add SHAK to Watchlist: View: Get Complete SHAK Trend Analysis ➞ | |
 | ACVA ACV Auctions Inc |
| Sector: Services & Goods | |
| SubSector: Auto & Truck Dealerships | |
| MarketCap: 2032.59 Millions | |
| Recent Price: 10.01 Smart Investing & Trading Score: 0 | |
| Day Percent Change: -3.09777% Day Change: 0.09 | |
| Week Change: -14.1509% Year-to-date Change: -52.2% | |
| ACVA Links: Profile News Message Board | |
| Charts:- Daily , Weekly | |
| Add ACVA to Watchlist: View: Get Complete ACVA Trend Analysis ➞ | |
 | CPS Cooper-Standard Holdings Inc |
| Sector: Services & Goods | |
| SubSector: Auto Parts | |
| MarketCap: 677.12 Millions | |
| Recent Price: 37.85 Smart Investing & Trading Score: 60 | |
| Day Percent Change: -3.1226% Day Change: 4.83 | |
| Week Change: -3.07298% Year-to-date Change: 181.8% | |
| CPS Links: Profile News Message Board | |
| Charts:- Daily , Weekly | |
| Add CPS to Watchlist: View: Get Complete CPS Trend Analysis ➞ | |
 | LCID Lucid Group Inc |
| Sector: Services & Goods | |
| SubSector: Auto Manufacturers | |
| MarketCap: 5656.46 Millions | |
| Recent Price: 19.27 Smart Investing & Trading Score: 60 | |
| Day Percent Change: -3.1407% Day Change: 0 | |
| Week Change: 19.276% Year-to-date Change: 536.1% | |
| LCID Links: Profile News Message Board | |
| Charts:- Daily , Weekly | |
| Add LCID to Watchlist: View: Get Complete LCID Trend Analysis ➞ | |
| For tabular summary view of above stock list: Summary View ➞ 0 - 25 , 25 - 50 , 50 - 75 , 75 - 100 , 100 - 125 , 125 - 150 , 150 - 175 , 175 - 200 , 200 - 225 , 225 - 250 , 250 - 275 , 275 - 300 , 300 - 325 , 325 - 350 , 350 - 375 , 375 - 400 , 400 - 425 , 425 - 450 , 450 - 475 , 475 - 500 , 500 - 525 , 525 - 550 , 550 - 575 , 575 - 600 , 600 - 625 | ||
| Click To Change The Sort Order: By Market Cap or Company Size Performance: Year-to-date, Week and Day | |
| Select Chart Type: | ||
|
Best Stocks Today 12Stocks.com |
© 2025 12Stocks.com Terms & Conditions Privacy Contact Us
All Information Provided Only For Education And Not To Be Used For Investing or Trading. See Terms & Conditions


One More Thing ... Get Best Stocks Delivered Daily!
Never Ever Miss A Move With Our Top Ten Stocks Lists
Find Best Stocks In Any Market - Bull or Bear Market
Take A Peek At Our Top Ten Stocks Lists: Daily, Weekly, Year-to-Date & Top Trends
Find Best Stocks In Any Market - Bull or Bear Market
Take A Peek At Our Top Ten Stocks Lists: Daily, Weekly, Year-to-Date & Top Trends
Consumer Services Stocks With Best Up Trends [0-bearish to 100-bullish]: QuantumScape Corp[100], Whole Foods[100], Net 1[100], Baozun [100], Resources Connection[100], KapStone Paper[100], Tesla [100], China Yuchai[100], Gamestop [100], Expedia [100], Express [100]
Best Consumer Services Stocks Year-to-Date:
WW [2086.01%], Nova Lifestyle[681.129%], ThredUp [637.943%], Lucid [536.139%], Vroom [455.146%], China Yuchai[295.103%], Luxottica [210.802%], Cooper-Standard [181.832%], Jumia Technologies[154.103%], Viomi Technology[138.127%], Niu Technologies[132.759%] Best Consumer Services Stocks This Week:
Party City[37593.9%], Companhia Brasileira[18587.4%], Conn s[16420.1%], Rite Aid[10214.6%], Arctic Cat[2387.5%], Chico s[2120.53%], Multi-Color [2063.68%], Reis [1734.59%], Quotient Technology[954.386%], Express [946.725%], Volt Information[705.085%] Best Consumer Services Stocks Daily:
Container Store[22.6852%], SUPERVALU [20.4138%], World Wrestling[14.734%], Global Sources[13.1016%], QuantumScape Corp[12.4294%], Whole Foods[11.8363%], iClick Interactive[10%], Net 1[9.46197%], Six Flags[7.76654%], SES AI[7.75862%], GreenTree Hospitality[7.29665%]