
 Login Sign Up


| |||||
 |  | ||||

| 12Stocks.com Market Intelligence |
Best Consumer Services Stocks
| In a hurry? Services & Goods Stocks: Performance Trends Table, Stock Charts
Sort Consumer Services: Daily, Weekly, Year-to-Date, Market Cap & Trends. Filter Services & Goods stocks list by size: All Large Mid-Range Small |
| 12Stocks.com Consumer Services Stocks Performances & Trends Daily | |||||||||
|
|  The overall Smart Investing & Trading Score is 100 (0-bearish to 100-bullish) which puts Consumer Services sector in short term bullish trend. The Smart Investing & Trading Score from previous trading session is 100 and an improvement of trend continues.
| ||||||||
Here are the Smart Investing & Trading Scores of the most requested Consumer Services stocks at 12Stocks.com (click stock name for detailed review):
|


| Consider signing up for our daily 12Stocks.com "Best Stocks Newsletter". You will never ever miss a big stock move again! |
| 12Stocks.com: Investing in Consumer Services sector with Stocks | |
|
The following table helps investors and traders sort through current performance and trends (as measured by Smart Investing & Trading Score) of various
stocks in the Consumer Services sector. Quick View: Move mouse or cursor over stock symbol (ticker) to view short-term Technical chart and over stock name to view long term chart. Click on  to add stock symbol to your watchlist and to add stock symbol to your watchlist and  to view watchlist. Click on any ticker or stock name for detailed market intelligence report for that stock. to view watchlist. Click on any ticker or stock name for detailed market intelligence report for that stock. |
12Stocks.com Performance of Stocks in Consumer Services Sector
| Ticker | Stock Name | Watchlist | Category | Recent Price | Smart Investing & Trading Score | Change % | YTD Change% |
| LI | Li Auto |   | Auto Manufacturers | 23.35 | 0 | -0.17% | -2.21% |
| GPC | Genuine Parts | | Auto Parts | 138.6 | 90 | -1.88% | 21.20% |
| AMCR | Amcor | | Packaging | 8.27 | 10 | -0.96% | -12.64% |
| RL | Ralph Lauren | | Apparel Manufacturing | 312.15 | 70 | -2.68% | 25.89% |
| IHG | Intercontinental Hotels | | Lodging | 122.64 | 90 | -0.83% | -2.87% |
| CASY | Casey's General | | Specialty Retail | 494.52 | 40 | -0.63% | 29.19% |
| BURL | Burlington Stores | | Apparel Retail | 290.68 | 60 | -0.62% | -3.32% |
| DECK | Deckers Outdoor | | Footwear & Accessories | 119.63 | 60 | 0.62% | -48.45% |
| DKS | Dicks Sporting | | Specialty Retail | 212.80 | 70 | 0.23% | -1.16% |
| CHWY | Chewy | | Internet Retail | 40.96 | 80 | -1.93% | 19.86% |
| APTV | Aptiv | | Auto Parts | 80.17 | 90 | -0.35% | 28.44% |
| RIVN | Rivian Automotive | | Auto Manufacturers | 13.57 | 10 | 0.41% | -8.87% |
| YUMC | Yum China | | Restaurants | 44.72 | 60 | 1.08% | -5.42% |
| SN | SharkNinja | | Furnishings, Fixtures & Appliances | 116.96 | 40 | -3.15% | 18.96% |
| BBY | Best Buy | | Specialty Retail | 76.46 | 90 | -0.77% | -8.56% |
| DPZ | Dominos Pizza | | Restaurants | 460.36 | 40 | -0.48% | 3.32% |
| XPEV | XPeng | | Auto Manufacturers | 21.02 | 30 | 11.68% | 92.47% |
| ONON | On Holding | | Footwear & Accessories | 45.08 | 43 | -1.46% | -18.61% |
| TOL | Toll Brothers | | Residential Construction | 139.00 | 100 | 0.11% | 5.16% |
| H | Hyatt Hotels | | Lodging | 144.28 | 70 | -0.31% | -12.64% |
| AVY | Avery Dennison | | Packaging | 167.29 | 40 | 0.16% | -9.01% |
| MGA | Magna | | Auto Parts | 45.90 | 80 | -0.27% | 8.61% |
| WYNN | Wynn Resorts | | Casinos | 120.9 | 50 | -1.62% | 39.95% |
| PAG | Penske Automotive | | Auto & Truck Dealerships | 184.41 | 90 | -0.68% | 20.55% |
| MBLY | Mobileye Global | | Auto Parts | 14.01 | 90 | 0.22% | -30.27% |
| For chart view version of above stock list: Chart View ➞ 0 - 25 , 25 - 50 , 50 - 75 , 75 - 100 , 100 - 125 , 125 - 150 , 150 - 175 , 175 - 200 , 200 - 225 , 225 - 250 , 250 - 275 , 275 - 300 , 300 - 325 , 325 - 350 , 350 - 375 , 375 - 400 | ||
 | Click To Change The Sort Order: By Market Cap or Company Size Performance: Year-to-date, Week and Day |  |
|
Get the most comprehensive stock market coverage daily at 12Stocks.com ➞ Best Stocks Today ➞ Best Stocks Weekly ➞ Best Stocks Year-to-Date ➞ Best Stocks Trends ➞  Best Stocks Today 12Stocks.com Best Nasdaq Stocks ➞ Best S&P 500 Stocks ➞ Best Tech Stocks ➞ Best Biotech Stocks ➞ |
| Detailed Overview of Consumer Services Stocks |
| Consumer Services Technical Overview, Leaders & Laggards, Top Consumer Services ETF Funds & Detailed Consumer Services Stocks List, Charts, Trends & More |
| Consumer Services Sector: Technical Analysis, Trends & YTD Performance | |
| Consumer Services sector is composed of stocks
from retail, entertainment, media/publishing, consumer goods
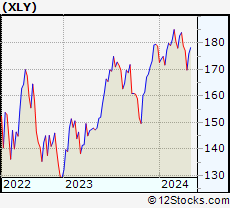
and services subsectors. Consumer Services sector, as represented by XLY, an exchange-traded fund [ETF] that holds basket of Consumer Services stocks (e.g, Walmart, Alibaba) is up by 0.83% and is currently underperforming the overall market by -6.89% year-to-date. Below is a quick view of Technical charts and trends: |
|
 XLY Weekly Chart |
|
| Long Term Trend: Very Good | |
| Medium Term Trend: Good | |
 XLY Daily Chart |
|
| Short Term Trend: Very Good | |
| Overall Trend Score: 100 | |
| YTD Performance: 0.83% | |
| **Trend Scores & Views Are Only For Educational Purposes And Not For Investing | |
| 12Stocks.com: Top Performing Consumer Services Sector Stocks | ||||||||||||||||||||||||||||||||||||||||||||||||
 The top performing Consumer Services sector stocks year to date are
Now, more recently, over last week, the top performing Consumer Services sector stocks on the move are


|
||||||||||||||||||||||||||||||||||||||||||||||||
| 12Stocks.com: Investing in Consumer Services Sector using Exchange Traded Funds | |
|
The following table shows list of key exchange traded funds (ETF) that
help investors track Consumer Services Index. For detailed view, check out our ETF Funds section of our website. Quick View: Move mouse or cursor over ETF symbol (ticker) to view short-term Technical chart and over ETF name to view long term chart. Click on ticker or stock name for detailed view. Click on to add stock symbol to your watchlist and to view watchlist. |
12Stocks.com List of ETFs that track Consumer Services Index
| Ticker | ETF Name | Watchlist | Recent Price | Smart Investing & Trading Score | Change % | Week % | Year-to-date % |
| 12Stocks.com: Charts, Trends, Fundamental Data and Performances of Consumer Services Stocks | |
|
We now take in-depth look at all Consumer Services stocks including charts, multi-period performances and overall trends (as measured by Smart Investing & Trading Score). One can sort Consumer Services stocks (click link to choose) by Daily, Weekly and by Year-to-Date performances. Also, one can sort by size of the company or by market capitalization. |
| Select Your Default Chart Type: | |||||
| |||||
| Click on stock symbol or name for detailed view. Click on to add stock symbol to your watchlist and to view watchlist. Quick View: Move mouse or cursor over "Daily" to quickly view daily Technical stock chart and over "Weekly" to view weekly Technical stock chart. | |||||

 | LI Li Auto Inc ADR |
| Sector: Services & Goods | |
| SubSector: Auto Manufacturers | |
| MarketCap: 19756.7 Millions | |
| Recent Price: 23.35 Smart Investing & Trading Score: 0 | |
| Day Percent Change: -0.17% Day Change: -0.04 | |
| Week Change: -1.22% Year-to-date Change: -2.2% | |
| LI Links: Profile News Message Board | |
| Charts:- Daily , Weekly | |
| Add LI to Watchlist: View: Get Complete LI Trend Analysis ➞ | |
 | GPC Genuine Parts Co |
| Sector: Services & Goods | |
| SubSector: Auto Parts | |
| MarketCap: 19403.4 Millions | |
| Recent Price: 138.6 Smart Investing & Trading Score: 90 | |
| Day Percent Change: -1.88% Day Change: -2.65 | |
| Week Change: -0.65% Year-to-date Change: 21.2% | |
| GPC Links: Profile News Message Board | |
| Charts:- Daily , Weekly | |
| Add GPC to Watchlist: View: Get Complete GPC Trend Analysis ➞ | |
 | AMCR Amcor Plc |
| Sector: Services & Goods | |
| SubSector: Packaging & Containers | |
| MarketCap: 19134.5 Millions | |
| Recent Price: 8.27 Smart Investing & Trading Score: 10 | |
| Day Percent Change: -0.96% Day Change: -0.08 | |
| Week Change: -5.05% Year-to-date Change: -12.6% | |
| AMCR Links: Profile News Message Board | |
| Charts:- Daily , Weekly | |
| Add AMCR to Watchlist: View: Get Complete AMCR Trend Analysis ➞ | |
 | RL Ralph Lauren Corp |
| Sector: Services & Goods | |
| SubSector: Apparel Manufacturing | |
| MarketCap: 18906.2 Millions | |
| Recent Price: 312.15 Smart Investing & Trading Score: 70 | |
| Day Percent Change: -2.68% Day Change: -8.6 | |
| Week Change: 9.22% Year-to-date Change: 25.9% | |
| RL Links: Profile News Message Board | |
| Charts:- Daily , Weekly | |
| Add RL to Watchlist: View: Get Complete RL Trend Analysis ➞ | |
 | IHG Intercontinental Hotels Group ADR |
| Sector: Services & Goods | |
| SubSector: Lodging | |
| MarketCap: 18841.6 Millions | |
| Recent Price: 122.64 Smart Investing & Trading Score: 90 | |
| Day Percent Change: -0.83% Day Change: -1 | |
| Week Change: -0.14% Year-to-date Change: -2.9% | |
| IHG Links: Profile News Message Board | |
| Charts:- Daily , Weekly | |
| Add IHG to Watchlist: View: Get Complete IHG Trend Analysis ➞ | |
 | CASY Casey's General Stores, Inc |
| Sector: Services & Goods | |
| SubSector: Specialty Retail | |
| MarketCap: 18800.2 Millions | |
| Recent Price: 494.52 Smart Investing & Trading Score: 40 | |
| Day Percent Change: -0.63% Day Change: -3.21 | |
| Week Change: 0.39% Year-to-date Change: 29.2% | |
| CASY Links: Profile News Message Board | |
| Charts:- Daily , Weekly | |
| Add CASY to Watchlist: View: Get Complete CASY Trend Analysis ➞ | |
 | BURL Burlington Stores Inc |
| Sector: Services & Goods | |
| SubSector: Apparel Retail | |
| MarketCap: 18355.8 Millions | |
| Recent Price: 290.68 Smart Investing & Trading Score: 60 | |
| Day Percent Change: -0.62% Day Change: -1.72 | |
| Week Change: -2.04% Year-to-date Change: -3.3% | |
| BURL Links: Profile News Message Board | |
| Charts:- Daily , Weekly | |
| Add BURL to Watchlist: View: Get Complete BURL Trend Analysis ➞ | |
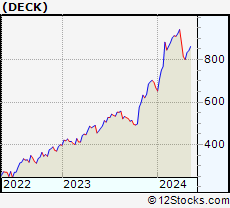 | DECK Deckers Outdoor Corp |
| Sector: Services & Goods | |
| SubSector: Footwear & Accessories | |
| MarketCap: 17860.5 Millions | |
| Recent Price: 119.63 Smart Investing & Trading Score: 60 | |
| Day Percent Change: 0.62% Day Change: 0.64 | |
| Week Change: 0.8% Year-to-date Change: -48.5% | |
| DECK Links: Profile News Message Board | |
| Charts:- Daily , Weekly | |
| Add DECK to Watchlist: View: Get Complete DECK Trend Analysis ➞ | |
 | DKS Dicks Sporting Goods, Inc |
| Sector: Services & Goods | |
| SubSector: Specialty Retail | |
| MarketCap: 17720.7 Millions | |
| Recent Price: 212.80 Smart Investing & Trading Score: 70 | |
| Day Percent Change: 0.23% Day Change: 0.52 | |
| Week Change: 0.27% Year-to-date Change: -1.2% | |
| DKS Links: Profile News Message Board | |
| Charts:- Daily , Weekly | |
| Add DKS to Watchlist: View: Get Complete DKS Trend Analysis ➞ | |
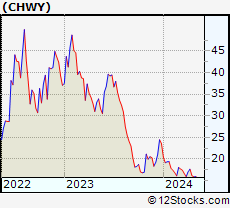 | CHWY Chewy Inc |
| Sector: Services & Goods | |
| SubSector: Internet Retail | |
| MarketCap: 17626.5 Millions | |
| Recent Price: 40.96 Smart Investing & Trading Score: 80 | |
| Day Percent Change: -1.93% Day Change: -0.79 | |
| Week Change: 3.08% Year-to-date Change: 19.9% | |
| CHWY Links: Profile News Message Board | |
| Charts:- Daily , Weekly | |
| Add CHWY to Watchlist: View: Get Complete CHWY Trend Analysis ➞ | |
 | APTV Aptiv PLC |
| Sector: Services & Goods | |
| SubSector: Auto Parts | |
| MarketCap: 17516.6 Millions | |
| Recent Price: 80.17 Smart Investing & Trading Score: 90 | |
| Day Percent Change: -0.35% Day Change: -0.28 | |
| Week Change: 2.22% Year-to-date Change: 28.4% | |
| APTV Links: Profile News Message Board | |
| Charts:- Daily , Weekly | |
| Add APTV to Watchlist: View: Get Complete APTV Trend Analysis ➞ | |
 | RIVN Rivian Automotive Inc |
| Sector: Services & Goods | |
| SubSector: Auto Manufacturers | |
| MarketCap: 17242.9 Millions | |
| Recent Price: 13.57 Smart Investing & Trading Score: 10 | |
| Day Percent Change: 0.41% Day Change: 0.05 | |
| Week Change: 0.5% Year-to-date Change: -8.9% | |
| RIVN Links: Profile News Message Board | |
| Charts:- Daily , Weekly | |
| Add RIVN to Watchlist: View: Get Complete RIVN Trend Analysis ➞ | |
 | YUMC Yum China Holdings Inc |
| Sector: Services & Goods | |
| SubSector: Restaurants | |
| MarketCap: 16566.5 Millions | |
| Recent Price: 44.72 Smart Investing & Trading Score: 60 | |
| Day Percent Change: 1.08% Day Change: 0.48 | |
| Week Change: 0.6% Year-to-date Change: -5.4% | |
| YUMC Links: Profile News Message Board | |
| Charts:- Daily , Weekly | |
| Add YUMC to Watchlist: View: Get Complete YUMC Trend Analysis ➞ | |
 | SN SharkNinja Inc |
| Sector: Services & Goods | |
| SubSector: Furnishings, Fixtures & Appliances | |
| MarketCap: 16538.5 Millions | |
| Recent Price: 116.96 Smart Investing & Trading Score: 40 | |
| Day Percent Change: -3.15% Day Change: -3.77 | |
| Week Change: -2.92% Year-to-date Change: 19.0% | |
| SN Links: Profile News Message Board | |
| Charts:- Daily , Weekly | |
| Add SN to Watchlist: View: Get Complete SN Trend Analysis ➞ | |
 | BBY Best Buy Co. Inc |
| Sector: Services & Goods | |
| SubSector: Specialty Retail | |
| MarketCap: 16098.3 Millions | |
| Recent Price: 76.46 Smart Investing & Trading Score: 90 | |
| Day Percent Change: -0.77% Day Change: -0.59 | |
| Week Change: 1.42% Year-to-date Change: -8.6% | |
| BBY Links: Profile News Message Board | |
| Charts:- Daily , Weekly | |
| Add BBY to Watchlist: View: Get Complete BBY Trend Analysis ➞ | |
 | DPZ Dominos Pizza Inc |
| Sector: Services & Goods | |
| SubSector: Restaurants | |
| MarketCap: 15748 Millions | |
| Recent Price: 460.36 Smart Investing & Trading Score: 40 | |
| Day Percent Change: -0.48% Day Change: -2.24 | |
| Week Change: 2.08% Year-to-date Change: 3.3% | |
| DPZ Links: Profile News Message Board | |
| Charts:- Daily , Weekly | |
| Add DPZ to Watchlist: View: Get Complete DPZ Trend Analysis ➞ | |
 | XPEV XPeng Inc ADR |
| Sector: Services & Goods | |
| SubSector: Auto Manufacturers | |
| MarketCap: 15408.5 Millions | |
| Recent Price: 21.02 Smart Investing & Trading Score: 30 | |
| Day Percent Change: 11.68% Day Change: 2.38 | |
| Week Change: 17.39% Year-to-date Change: 92.5% | |
| XPEV Links: Profile News Message Board | |
| Charts:- Daily , Weekly | |
| Add XPEV to Watchlist: View: Get Complete XPEV Trend Analysis ➞ | |
 | ONON On Holding AG |
| Sector: Services & Goods | |
| SubSector: Footwear & Accessories | |
| MarketCap: 14864.1 Millions | |
| Recent Price: 45.08 Smart Investing & Trading Score: 43 | |
| Day Percent Change: -1.46% Day Change: -0.66 | |
| Week Change: 0.84% Year-to-date Change: -18.6% | |
| ONON Links: Profile News Message Board | |
| Charts:- Daily , Weekly | |
| Add ONON to Watchlist: View: Get Complete ONON Trend Analysis ➞ | |
 | TOL Toll Brothers Inc |
| Sector: Services & Goods | |
| SubSector: Residential Construction | |
| MarketCap: 14204 Millions | |
| Recent Price: 139.00 Smart Investing & Trading Score: 100 | |
| Day Percent Change: 0.11% Day Change: 0.15 | |
| Week Change: 0.44% Year-to-date Change: 5.2% | |
| TOL Links: Profile News Message Board | |
| Charts:- Daily , Weekly | |
| Add TOL to Watchlist: View: Get Complete TOL Trend Analysis ➞ | |
 | H Hyatt Hotels Corporation |
| Sector: Services & Goods | |
| SubSector: Lodging | |
| MarketCap: 13893.4 Millions | |
| Recent Price: 144.28 Smart Investing & Trading Score: 70 | |
| Day Percent Change: -0.31% Day Change: -0.42 | |
| Week Change: -4.26% Year-to-date Change: -12.6% | |
| H Links: Profile News Message Board | |
| Charts:- Daily , Weekly | |
| Add H to Watchlist: View: Get Complete H Trend Analysis ➞ | |
 | AVY Avery Dennison Corp |
| Sector: Services & Goods | |
| SubSector: Packaging & Containers | |
| MarketCap: 13105.6 Millions | |
| Recent Price: 167.29 Smart Investing & Trading Score: 40 | |
| Day Percent Change: 0.16% Day Change: 0.26 | |
| Week Change: -6.28% Year-to-date Change: -9.0% | |
| AVY Links: Profile News Message Board | |
| Charts:- Daily , Weekly | |
| Add AVY to Watchlist: View: Get Complete AVY Trend Analysis ➞ | |
 | MGA Magna International Inc |
| Sector: Services & Goods | |
| SubSector: Auto Parts | |
| MarketCap: 12928.1 Millions | |
| Recent Price: 45.90 Smart Investing & Trading Score: 80 | |
| Day Percent Change: -0.27% Day Change: -0.12 | |
| Week Change: -1.16% Year-to-date Change: 8.6% | |
| MGA Links: Profile News Message Board | |
| Charts:- Daily , Weekly | |
| Add MGA to Watchlist: View: Get Complete MGA Trend Analysis ➞ | |
 | WYNN Wynn Resorts Ltd |
| Sector: Services & Goods | |
| SubSector: Resorts & Casinos | |
| MarketCap: 12570.8 Millions | |
| Recent Price: 120.9 Smart Investing & Trading Score: 50 | |
| Day Percent Change: -1.62% Day Change: -1.99 | |
| Week Change: 5.77% Year-to-date Change: 40.0% | |
| WYNN Links: Profile News Message Board | |
| Charts:- Daily , Weekly | |
| Add WYNN to Watchlist: View: Get Complete WYNN Trend Analysis ➞ | |
 | PAG Penske Automotive Group Inc |
| Sector: Services & Goods | |
| SubSector: Auto & Truck Dealerships | |
| MarketCap: 12391.9 Millions | |
| Recent Price: 184.41 Smart Investing & Trading Score: 90 | |
| Day Percent Change: -0.68% Day Change: -1.23 | |
| Week Change: -1.13% Year-to-date Change: 20.6% | |
| PAG Links: Profile News Message Board | |
| Charts:- Daily , Weekly | |
| Add PAG to Watchlist: View: Get Complete PAG Trend Analysis ➞ | |
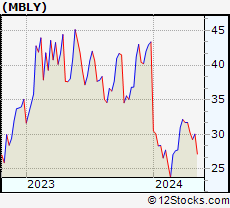 | MBLY Mobileye Global Inc |
| Sector: Services & Goods | |
| SubSector: Auto Parts | |
| MarketCap: 12072.7 Millions | |
| Recent Price: 14.01 Smart Investing & Trading Score: 90 | |
| Day Percent Change: 0.22% Day Change: 0.03 | |
| Week Change: -0.5% Year-to-date Change: -30.3% | |
| MBLY Links: Profile News Message Board | |
| Charts:- Daily , Weekly | |
| Add MBLY to Watchlist: View: Get Complete MBLY Trend Analysis ➞ | |
| For tabular summary view of above stock list: Summary View ➞ 0 - 25 , 25 - 50 , 50 - 75 , 75 - 100 , 100 - 125 , 125 - 150 , 150 - 175 , 175 - 200 , 200 - 225 , 225 - 250 , 250 - 275 , 275 - 300 , 300 - 325 , 325 - 350 , 350 - 375 , 375 - 400 | ||
| Click To Change The Sort Order: By Market Cap or Company Size Performance: Year-to-date, Week and Day | |
| Select Chart Type: | ||
|
Best Stocks Today 12Stocks.com |
© 2025 12Stocks.com Terms & Conditions Privacy Contact Us
All Information Provided Only For Education And Not To Be Used For Investing or Trading. See Terms & Conditions


One More Thing ... Get Best Stocks Delivered Daily!
Never Ever Miss A Move With Our Top Ten Stocks Lists
Find Best Stocks In Any Market - Bull or Bear Market
Take A Peek At Our Top Ten Stocks Lists: Daily, Weekly, Year-to-Date & Top Trends
Find Best Stocks In Any Market - Bull or Bear Market
Take A Peek At Our Top Ten Stocks Lists: Daily, Weekly, Year-to-Date & Top Trends
Consumer Services Stocks With Best Up Trends [0-bearish to 100-bullish]: Designer Brands[100], Childrens Place[100], PDD [100], Lennar Corp[100], D.R. Horton[100], Mohawk Industries[100], Signet Jewelers[100], Shoe Carnival[100], H World[100], Pulte [100], Lowe's Cos[100]
Best Consumer Services Stocks Year-to-Date:
WW [2341.73%], ThredUp [702.88%], China Yuchai[231.9%], Niu Technologies[159.78%], Viomi Technology[154.48%], Cooper-Standard [153.02%], Nova Lifestyle[146.73%], National Vision[130.71%], Solid Power[128.57%], XPeng [92.47%], Super [88.69%] Best Consumer Services Stocks This Week:
Macy's [27.61%], Guess [25.88%], NIO [24.49%], Kandi Technologies[24.41%], Fossil [20%], Kohl's Corp[19.29%], Cooper-Standard [18.47%], Flexsteel Industries[18.05%], XPeng [17.39%], Smart Share[14.53%], MINISO [13.58%] Best Consumer Services Stocks Daily:
Cooper-Standard [16.38%], XPeng [11.68%], Viomi Technology[9.39%], NIO [9.27%], Funko [9.16%], Designer Brands[9.15%], Hamilton Beach[7.24%], MINISO [6.38%], Genesco [5.5%], Flexsteel Industries[5.47%], Solid Power[4.85%]