
 Login Sign Up


| |||||
 |  | ||||

| 12Stocks.com Market Intelligence |
Best Consumer Services Stocks
| In a hurry? Services & Goods Stocks: Performance Trends Table, Stock Charts
Sort Consumer Services: Daily, Weekly, Year-to-Date, Market Cap & Trends. Filter Services & Goods stocks list by size: All Large Mid-Range Small |
| 12Stocks.com Consumer Services Stocks Performances & Trends Daily | |||||||||
|
|  The overall Smart Investing & Trading Score is 100 (0-bearish to 100-bullish) which puts Consumer Services sector in short term bullish trend. The Smart Investing & Trading Score from previous trading session is 100 and an improvement of trend continues.
| ||||||||
Here are the Smart Investing & Trading Scores of the most requested Consumer Services stocks at 12Stocks.com (click stock name for detailed review):
|


| Consider signing up for our daily 12Stocks.com "Best Stocks Newsletter". You will never ever miss a big stock move again! |
| 12Stocks.com: Investing in Consumer Services sector with Stocks | |
|
The following table helps investors and traders sort through current performance and trends (as measured by Smart Investing & Trading Score) of various
stocks in the Consumer Services sector. Quick View: Move mouse or cursor over stock symbol (ticker) to view short-term Technical chart and over stock name to view long term chart. Click on  to add stock symbol to your watchlist and to add stock symbol to your watchlist and  to view watchlist. Click on any ticker or stock name for detailed market intelligence report for that stock. to view watchlist. Click on any ticker or stock name for detailed market intelligence report for that stock. |
12Stocks.com Performance of Stocks in Consumer Services Sector
| Ticker | Stock Name | Watchlist | Category | Recent Price | Smart Investing & Trading Score | Change % | YTD Change% |
| DHI | D.R. Horton |   | Residential Construction | 181.8 | 100 | 2.89% | 29.24% |
| CPNG | Coupang | | Internet Retail | 28.58 | 50 | -2.15% | 28.39% |
| ROST | Ross Stores | | Apparel Retail | 151.04 | 60 | -1.16% | 0.93% |
| TCOM | Trip.com | | Travel Services | 73.75 | 90 | 0.70% | -6.89% |
| HMC | Honda Motor | | Auto Manufacturers | 33.40 | 80 | -1.74% | 21.75% |
| F | Ford Motor | | Auto Manufacturers | 11.74 | 70 | 0.51% | 23.67% |
| JD | JD.com | | Internet Retail | 31.45 | 40 | 1.68% | -20.54% |
| EBAY | EBay | | Internet Retail | 91.83 | 70 | -1.29% | 37.25% |
| CCL | Carnival Corp | | Travel Services | 31.5 | 80 | -0.82% | 13.84% |
| YUM | Yum Brands | | Restaurants | 144.42 | 10 | 0.52% | 11.74% |
| LVS | Las Vegas | | Casinos | 53.88 | 40 | -2.23% | 19.60% |
| LEN | Lennar Corp | | Residential Construction | 142.55 | 100 | 3.24% | 9.60% |
| TSCO | Tractor Supply | | Specialty Retail | 60.28 | 30 | -0.59% | 11.85% |
| QSR | Restaurant Brands | | Restaurants | 63.33 | 40 | 0.06% | -0.29% |
| PHM | Pulte | | Residential Construction | 140.48 | 100 | 2.09% | 23.99% |
| ROL | Rollins | | Services | 56.19 | 40 | -1.18% | 14.54% |
| EXPE | Expedia | | Travel Services | 214.95 | 80 | -0.73% | 26.30% |
| IP | Paper | | Packaging | 48.55 | 50 | 0.50% | -11.15% |
| WSM | Williams-Sonoma | | Specialty Retail | 188.19 | 70 | -1.03% | 7.73% |
| DRI | Darden Restaurants | | Restaurants | 209.37 | 70 | -0.39% | 8.76% |
| NVR | NVR | | Residential Construction | 8473.0 | 100 | 0.78% | 5.70% |
| ULTA | Ulta Beauty | | Specialty Retail | 515.33 | 30 | -2.68% | 25.03% |
| TPR | Tapestry | | Luxury Goods | 104.08 | 70 | -1.64% | 43.95% |
| LULU | Lululemon Athletica | | Apparel Retail | 168.46 | 0 | -18.26% | -59.33% |
| PKG | Packaging Corp | | Packaging | 218.75 | 100 | 0.94% | 4.21% |
| For chart view version of above stock list: Chart View ➞ 0 - 25 , 25 - 50 , 50 - 75 , 75 - 100 , 100 - 125 , 125 - 150 , 150 - 175 , 175 - 200 , 200 - 225 , 225 - 250 , 250 - 275 , 275 - 300 , 300 - 325 , 325 - 350 , 350 - 375 , 375 - 400 | ||
 | Click To Change The Sort Order: By Market Cap or Company Size Performance: Year-to-date, Week and Day |  |
|
Get the most comprehensive stock market coverage daily at 12Stocks.com ➞ Best Stocks Today ➞ Best Stocks Weekly ➞ Best Stocks Year-to-Date ➞ Best Stocks Trends ➞  Best Stocks Today 12Stocks.com Best Nasdaq Stocks ➞ Best S&P 500 Stocks ➞ Best Tech Stocks ➞ Best Biotech Stocks ➞ |
| Detailed Overview of Consumer Services Stocks |
| Consumer Services Technical Overview, Leaders & Laggards, Top Consumer Services ETF Funds & Detailed Consumer Services Stocks List, Charts, Trends & More |
| Consumer Services Sector: Technical Analysis, Trends & YTD Performance | |
| Consumer Services sector is composed of stocks
from retail, entertainment, media/publishing, consumer goods
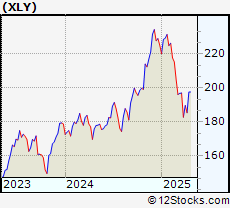
and services subsectors. Consumer Services sector, as represented by XLY, an exchange-traded fund [ETF] that holds basket of Consumer Services stocks (e.g, Walmart, Alibaba) is up by 0.83% and is currently underperforming the overall market by -6.89% year-to-date. Below is a quick view of Technical charts and trends: |
|
 XLY Weekly Chart |
|
| Long Term Trend: Very Good | |
| Medium Term Trend: Good | |
 XLY Daily Chart |
|
| Short Term Trend: Very Good | |
| Overall Trend Score: 100 | |
| YTD Performance: 0.83% | |
| **Trend Scores & Views Are Only For Educational Purposes And Not For Investing | |
| 12Stocks.com: Top Performing Consumer Services Sector Stocks | ||||||||||||||||||||||||||||||||||||||||||||||||
 The top performing Consumer Services sector stocks year to date are
Now, more recently, over last week, the top performing Consumer Services sector stocks on the move are


|
||||||||||||||||||||||||||||||||||||||||||||||||
| 12Stocks.com: Investing in Consumer Services Sector using Exchange Traded Funds | |
|
The following table shows list of key exchange traded funds (ETF) that
help investors track Consumer Services Index. For detailed view, check out our ETF Funds section of our website. Quick View: Move mouse or cursor over ETF symbol (ticker) to view short-term Technical chart and over ETF name to view long term chart. Click on ticker or stock name for detailed view. Click on to add stock symbol to your watchlist and to view watchlist. |
12Stocks.com List of ETFs that track Consumer Services Index
| Ticker | ETF Name | Watchlist | Recent Price | Smart Investing & Trading Score | Change % | Week % | Year-to-date % |
| 12Stocks.com: Charts, Trends, Fundamental Data and Performances of Consumer Services Stocks | |
|
We now take in-depth look at all Consumer Services stocks including charts, multi-period performances and overall trends (as measured by Smart Investing & Trading Score). One can sort Consumer Services stocks (click link to choose) by Daily, Weekly and by Year-to-Date performances. Also, one can sort by size of the company or by market capitalization. |
| Select Your Default Chart Type: | |||||
| |||||
| Click on stock symbol or name for detailed view. Click on to add stock symbol to your watchlist and to view watchlist. Quick View: Move mouse or cursor over "Daily" to quickly view daily Technical stock chart and over "Weekly" to view weekly Technical stock chart. | |||||

 | DHI D.R. Horton Inc |
| Sector: Services & Goods | |
| SubSector: Residential Construction | |
| MarketCap: 54198.9 Millions | |
| Recent Price: 181.8 Smart Investing & Trading Score: 100 | |
| Day Percent Change: 2.89% Day Change: 5.11 | |
| Week Change: 6.52% Year-to-date Change: 29.2% | |
| DHI Links: Profile News Message Board | |
| Charts:- Daily , Weekly | |
| Add DHI to Watchlist: View: Get Complete DHI Trend Analysis ➞ | |
 | CPNG Coupang Inc |
| Sector: Services & Goods | |
| SubSector: Internet Retail | |
| MarketCap: 52704.8 Millions | |
| Recent Price: 28.58 Smart Investing & Trading Score: 50 | |
| Day Percent Change: -2.15% Day Change: -0.62 | |
| Week Change: -0.39% Year-to-date Change: 28.4% | |
| CPNG Links: Profile News Message Board | |
| Charts:- Daily , Weekly | |
| Add CPNG to Watchlist: View: Get Complete CPNG Trend Analysis ➞ | |
 | ROST Ross Stores, Inc |
| Sector: Services & Goods | |
| SubSector: Apparel Retail | |
| MarketCap: 49371.3 Millions | |
| Recent Price: 151.04 Smart Investing & Trading Score: 60 | |
| Day Percent Change: -1.16% Day Change: -1.77 | |
| Week Change: 2.57% Year-to-date Change: 0.9% | |
| ROST Links: Profile News Message Board | |
| Charts:- Daily , Weekly | |
| Add ROST to Watchlist: View: Get Complete ROST Trend Analysis ➞ | |
 | TCOM Trip.com Group Ltd ADR |
| Sector: Services & Goods | |
| SubSector: Travel Services | |
| MarketCap: 47551.5 Millions | |
| Recent Price: 73.75 Smart Investing & Trading Score: 90 | |
| Day Percent Change: 0.7% Day Change: 0.44 | |
| Week Change: 5.49% Year-to-date Change: -6.9% | |
| TCOM Links: Profile News Message Board | |
| Charts:- Daily , Weekly | |
| Add TCOM to Watchlist: View: Get Complete TCOM Trend Analysis ➞ | |
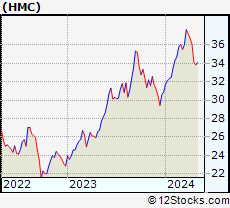 | HMC Honda Motor ADR |
| Sector: Services & Goods | |
| SubSector: Auto Manufacturers | |
| MarketCap: 46777.5 Millions | |
| Recent Price: 33.40 Smart Investing & Trading Score: 80 | |
| Day Percent Change: -1.74% Day Change: -0.6 | |
| Week Change: 2.02% Year-to-date Change: 21.8% | |
| HMC Links: Profile News Message Board | |
| Charts:- Daily , Weekly | |
| Add HMC to Watchlist: View: Get Complete HMC Trend Analysis ➞ | |
 | F Ford Motor Co |
| Sector: Services & Goods | |
| SubSector: Auto Manufacturers | |
| MarketCap: 46723.6 Millions | |
| Recent Price: 11.74 Smart Investing & Trading Score: 70 | |
| Day Percent Change: 0.51% Day Change: 0.06 | |
| Week Change: 0% Year-to-date Change: 23.7% | |
| F Links: Profile News Message Board | |
| Charts:- Daily , Weekly | |
| Add F to Watchlist: View: Get Complete F Trend Analysis ➞ | |
 | JD JD.com Inc ADR |
| Sector: Services & Goods | |
| SubSector: Internet Retail | |
| MarketCap: 42508.1 Millions | |
| Recent Price: 31.45 Smart Investing & Trading Score: 40 | |
| Day Percent Change: 1.68% Day Change: 0.52 | |
| Week Change: -1.35% Year-to-date Change: -20.5% | |
| JD Links: Profile News Message Board | |
| Charts:- Daily , Weekly | |
| Add JD to Watchlist: View: Get Complete JD Trend Analysis ➞ | |
 | EBAY EBay Inc |
| Sector: Services & Goods | |
| SubSector: Internet Retail | |
| MarketCap: 42345.6 Millions | |
| Recent Price: 91.83 Smart Investing & Trading Score: 70 | |
| Day Percent Change: -1.29% Day Change: -1.2 | |
| Week Change: -7.45% Year-to-date Change: 37.3% | |
| EBAY Links: Profile News Message Board | |
| Charts:- Daily , Weekly | |
| Add EBAY to Watchlist: View: Get Complete EBAY Trend Analysis ➞ | |
 | CCL Carnival Corp |
| Sector: Services & Goods | |
| SubSector: Travel Services | |
| MarketCap: 41060.4 Millions | |
| Recent Price: 31.5 Smart Investing & Trading Score: 80 | |
| Day Percent Change: -0.82% Day Change: -0.26 | |
| Week Change: 0.64% Year-to-date Change: 13.8% | |
| CCL Links: Profile News Message Board | |
| Charts:- Daily , Weekly | |
| Add CCL to Watchlist: View: Get Complete CCL Trend Analysis ➞ | |
 | YUM Yum Brands Inc |
| Sector: Services & Goods | |
| SubSector: Restaurants | |
| MarketCap: 40126.1 Millions | |
| Recent Price: 144.42 Smart Investing & Trading Score: 10 | |
| Day Percent Change: 0.52% Day Change: 0.75 | |
| Week Change: -2.33% Year-to-date Change: 11.7% | |
| YUM Links: Profile News Message Board | |
| Charts:- Daily , Weekly | |
| Add YUM to Watchlist: View: Get Complete YUM Trend Analysis ➞ | |
 | LVS Las Vegas Sands Corp |
| Sector: Services & Goods | |
| SubSector: Resorts & Casinos | |
| MarketCap: 36862.6 Millions | |
| Recent Price: 53.88 Smart Investing & Trading Score: 40 | |
| Day Percent Change: -2.23% Day Change: -1.23 | |
| Week Change: -2.13% Year-to-date Change: 19.6% | |
| LVS Links: Profile News Message Board | |
| Charts:- Daily , Weekly | |
| Add LVS to Watchlist: View: Get Complete LVS Trend Analysis ➞ | |
 | LEN Lennar Corp |
| Sector: Services & Goods | |
| SubSector: Residential Construction | |
| MarketCap: 36567.6 Millions | |
| Recent Price: 142.55 Smart Investing & Trading Score: 100 | |
| Day Percent Change: 3.24% Day Change: 4.48 | |
| Week Change: 5.01% Year-to-date Change: 9.6% | |
| LEN Links: Profile News Message Board | |
| Charts:- Daily , Weekly | |
| Add LEN to Watchlist: View: Get Complete LEN Trend Analysis ➞ | |
 | TSCO Tractor Supply Co |
| Sector: Services & Goods | |
| SubSector: Specialty Retail | |
| MarketCap: 32072.7 Millions | |
| Recent Price: 60.28 Smart Investing & Trading Score: 30 | |
| Day Percent Change: -0.59% Day Change: -0.36 | |
| Week Change: -2.16% Year-to-date Change: 11.9% | |
| TSCO Links: Profile News Message Board | |
| Charts:- Daily , Weekly | |
| Add TSCO to Watchlist: View: Get Complete TSCO Trend Analysis ➞ | |
 | QSR Restaurant Brands International Inc |
| Sector: Services & Goods | |
| SubSector: Restaurants | |
| MarketCap: 28696.9 Millions | |
| Recent Price: 63.33 Smart Investing & Trading Score: 40 | |
| Day Percent Change: 0.06% Day Change: 0.04 | |
| Week Change: -2.13% Year-to-date Change: -0.3% | |
| QSR Links: Profile News Message Board | |
| Charts:- Daily , Weekly | |
| Add QSR to Watchlist: View: Get Complete QSR Trend Analysis ➞ | |
 | PHM PulteGroup Inc |
| Sector: Services & Goods | |
| SubSector: Residential Construction | |
| MarketCap: 27734.1 Millions | |
| Recent Price: 140.48 Smart Investing & Trading Score: 100 | |
| Day Percent Change: 2.09% Day Change: 2.87 | |
| Week Change: 6.16% Year-to-date Change: 24.0% | |
| PHM Links: Profile News Message Board | |
| Charts:- Daily , Weekly | |
| Add PHM to Watchlist: View: Get Complete PHM Trend Analysis ➞ | |
 | ROL Rollins, Inc |
| Sector: Services & Goods | |
| SubSector: Personal Services | |
| MarketCap: 27391.8 Millions | |
| Recent Price: 56.19 Smart Investing & Trading Score: 40 | |
| Day Percent Change: -1.18% Day Change: -0.67 | |
| Week Change: -3.1% Year-to-date Change: 14.5% | |
| ROL Links: Profile News Message Board | |
| Charts:- Daily , Weekly | |
| Add ROL to Watchlist: View: Get Complete ROL Trend Analysis ➞ | |
 | EXPE Expedia Group Inc |
| Sector: Services & Goods | |
| SubSector: Travel Services | |
| MarketCap: 26592.7 Millions | |
| Recent Price: 214.95 Smart Investing & Trading Score: 80 | |
| Day Percent Change: -0.73% Day Change: -1.57 | |
| Week Change: 0.07% Year-to-date Change: 26.3% | |
| EXPE Links: Profile News Message Board | |
| Charts:- Daily , Weekly | |
| Add EXPE to Watchlist: View: Get Complete EXPE Trend Analysis ➞ | |
 | IP International Paper Co |
| Sector: Services & Goods | |
| SubSector: Packaging & Containers | |
| MarketCap: 25707.4 Millions | |
| Recent Price: 48.55 Smart Investing & Trading Score: 50 | |
| Day Percent Change: 0.5% Day Change: 0.24 | |
| Week Change: -0.7% Year-to-date Change: -11.2% | |
| IP Links: Profile News Message Board | |
| Charts:- Daily , Weekly | |
| Add IP to Watchlist: View: Get Complete IP Trend Analysis ➞ | |
 | WSM Williams-Sonoma, Inc |
| Sector: Services & Goods | |
| SubSector: Specialty Retail | |
| MarketCap: 24652.8 Millions | |
| Recent Price: 188.19 Smart Investing & Trading Score: 70 | |
| Day Percent Change: -1.03% Day Change: -2.06 | |
| Week Change: -4.01% Year-to-date Change: 7.7% | |
| WSM Links: Profile News Message Board | |
| Charts:- Daily , Weekly | |
| Add WSM to Watchlist: View: Get Complete WSM Trend Analysis ➞ | |
 | DRI Darden Restaurants, Inc |
| Sector: Services & Goods | |
| SubSector: Restaurants | |
| MarketCap: 24593.5 Millions | |
| Recent Price: 209.37 Smart Investing & Trading Score: 70 | |
| Day Percent Change: -0.39% Day Change: -0.82 | |
| Week Change: 0.38% Year-to-date Change: 8.8% | |
| DRI Links: Profile News Message Board | |
| Charts:- Daily , Weekly | |
| Add DRI to Watchlist: View: Get Complete DRI Trend Analysis ➞ | |
 | NVR NVR Inc |
| Sector: Services & Goods | |
| SubSector: Residential Construction | |
| MarketCap: 24399.1 Millions | |
| Recent Price: 8473.0 Smart Investing & Trading Score: 100 | |
| Day Percent Change: 0.78% Day Change: 65.23 | |
| Week Change: 3.17% Year-to-date Change: 5.7% | |
| NVR Links: Profile News Message Board | |
| Charts:- Daily , Weekly | |
| Add NVR to Watchlist: View: Get Complete NVR Trend Analysis ➞ | |
 | ULTA Ulta Beauty Inc |
| Sector: Services & Goods | |
| SubSector: Specialty Retail | |
| MarketCap: 23085.5 Millions | |
| Recent Price: 515.33 Smart Investing & Trading Score: 30 | |
| Day Percent Change: -2.68% Day Change: -14.17 | |
| Week Change: -2.68% Year-to-date Change: 25.0% | |
| ULTA Links: Profile News Message Board | |
| Charts:- Daily , Weekly | |
| Add ULTA to Watchlist: View: Get Complete ULTA Trend Analysis ➞ | |
 | TPR Tapestry Inc |
| Sector: Services & Goods | |
| SubSector: Luxury Goods | |
| MarketCap: 21682.3 Millions | |
| Recent Price: 104.08 Smart Investing & Trading Score: 70 | |
| Day Percent Change: -1.64% Day Change: -1.74 | |
| Week Change: 4.44% Year-to-date Change: 44.0% | |
| TPR Links: Profile News Message Board | |
| Charts:- Daily , Weekly | |
| Add TPR to Watchlist: View: Get Complete TPR Trend Analysis ➞ | |
 | LULU Lululemon Athletica inc |
| Sector: Services & Goods | |
| SubSector: Apparel Retail | |
| MarketCap: 20756.9 Millions | |
| Recent Price: 168.46 Smart Investing & Trading Score: 0 | |
| Day Percent Change: -18.26% Day Change: -37.63 | |
| Week Change: -18.85% Year-to-date Change: -59.3% | |
| LULU Links: Profile News Message Board | |
| Charts:- Daily , Weekly | |
| Add LULU to Watchlist: View: Get Complete LULU Trend Analysis ➞ | |
 | PKG Packaging Corp Of America |
| Sector: Services & Goods | |
| SubSector: Packaging & Containers | |
| MarketCap: 19817.8 Millions | |
| Recent Price: 218.75 Smart Investing & Trading Score: 100 | |
| Day Percent Change: 0.94% Day Change: 2.03 | |
| Week Change: 2.83% Year-to-date Change: 4.2% | |
| PKG Links: Profile News Message Board | |
| Charts:- Daily , Weekly | |
| Add PKG to Watchlist: View: Get Complete PKG Trend Analysis ➞ | |
| For tabular summary view of above stock list: Summary View ➞ 0 - 25 , 25 - 50 , 50 - 75 , 75 - 100 , 100 - 125 , 125 - 150 , 150 - 175 , 175 - 200 , 200 - 225 , 225 - 250 , 250 - 275 , 275 - 300 , 300 - 325 , 325 - 350 , 350 - 375 , 375 - 400 | ||
| Click To Change The Sort Order: By Market Cap or Company Size Performance: Year-to-date, Week and Day | |
| Select Chart Type: | ||
|
Best Stocks Today 12Stocks.com |
© 2025 12Stocks.com Terms & Conditions Privacy Contact Us
All Information Provided Only For Education And Not To Be Used For Investing or Trading. See Terms & Conditions


One More Thing ... Get Best Stocks Delivered Daily!
Never Ever Miss A Move With Our Top Ten Stocks Lists
Find Best Stocks In Any Market - Bull or Bear Market
Take A Peek At Our Top Ten Stocks Lists: Daily, Weekly, Year-to-Date & Top Trends
Find Best Stocks In Any Market - Bull or Bear Market
Take A Peek At Our Top Ten Stocks Lists: Daily, Weekly, Year-to-Date & Top Trends
Consumer Services Stocks With Best Up Trends [0-bearish to 100-bullish]: Designer Brands[100], Childrens Place[100], PDD [100], Lennar Corp[100], D.R. Horton[100], Mohawk Industries[100], Signet Jewelers[100], Shoe Carnival[100], H World[100], Pulte [100], Lowe's Cos[100]
Best Consumer Services Stocks Year-to-Date:
WW [2341.73%], ThredUp [702.88%], China Yuchai[231.9%], Niu Technologies[159.78%], Viomi Technology[154.48%], Cooper-Standard [153.02%], Nova Lifestyle[146.73%], National Vision[130.71%], Solid Power[128.57%], XPeng [92.47%], Super [88.69%] Best Consumer Services Stocks This Week:
Macy's [27.61%], Guess [25.88%], NIO [24.49%], Kandi Technologies[24.41%], Fossil [20%], Kohl's Corp[19.29%], Cooper-Standard [18.47%], Flexsteel Industries[18.05%], XPeng [17.39%], Smart Share[14.53%], MINISO [13.58%] Best Consumer Services Stocks Daily:
Cooper-Standard [16.38%], XPeng [11.68%], Viomi Technology[9.39%], NIO [9.27%], Funko [9.16%], Designer Brands[9.15%], Hamilton Beach[7.24%], MINISO [6.38%], Genesco [5.5%], Flexsteel Industries[5.47%], Solid Power[4.85%]