
 Login Sign Up


| |||||
 |  | ||||

| 12Stocks.com Market Intelligence |
Best Consumer Services Stocks
| In a hurry? Services & Goods Stocks: Performance Trends Table, Stock Charts
Sort Consumer Services: Daily, Weekly, Year-to-Date, Market Cap & Trends. Filter Services & Goods stocks list by size: All Large Mid-Range Small |
| 12Stocks.com Consumer Services Stocks Performances & Trends Daily | |||||||||
|
|  The overall Smart Investing & Trading Score is 100 (0-bearish to 100-bullish) which puts Consumer Services sector in short term bullish trend. The Smart Investing & Trading Score from previous trading session is 100 and an improvement of trend continues.
| ||||||||
Here are the Smart Investing & Trading Scores of the most requested Consumer Services stocks at 12Stocks.com (click stock name for detailed review):
|


| Consider signing up for our daily 12Stocks.com "Best Stocks Newsletter". You will never ever miss a big stock move again! |
| 12Stocks.com: Investing in Consumer Services sector with Stocks | |
|
The following table helps investors and traders sort through current performance and trends (as measured by Smart Investing & Trading Score) of various
stocks in the Consumer Services sector. Quick View: Move mouse or cursor over stock symbol (ticker) to view short-term Technical chart and over stock name to view long term chart. Click on  to add stock symbol to your watchlist and to add stock symbol to your watchlist and  to view watchlist. Click on any ticker or stock name for detailed market intelligence report for that stock. to view watchlist. Click on any ticker or stock name for detailed market intelligence report for that stock. |
12Stocks.com Performance of Stocks in Consumer Services Sector
| Ticker | Stock Name | Watchlist | Category | Recent Price | Smart Investing & Trading Score | Change % | YTD Change% |
| WINA | Winmark |   | Specialty Retail | 463.84 | 90 | 1.73% | 12.27% |
| RVLV | Revolve | | Internet Retail | 22.37 | 100 | 0.24% | -36.73% |
| TILE | Interface | | Furnishings, Fixtures & Appliances | 26.72 | 100 | -1.10% | 7.54% |
| ARHS | Arhaus | | Specialty Retail | 11.73 | 69 | -1.82% | 26.28% |
| PZZA | Papa John's | | Restaurants | 48.71 | 50 | -1.62% | 10.49% |
| TRS | Trimas | | Packaging | 38.67 | 80 | 0.86% | 53.92% |
| LGIH | LGI Homes | | Residential Construction | 61.91 | 100 | -2.21% | -30.63% |
| LZB | La-Z-Boy | | Furnishings, Fixtures & Appliances | 36.97 | 20 | 1.22% | -19.29% |
| ARCO | Arcos Dorados | | Restaurants | 7.00 | 60 | -1.13% | -2.50% |
| PSNYW | Polestar Automotive | | Auto Manufacturers | 0.31 | 73 | 4.69% | 16.45% |
| SBH | Sally Beauty | | Specialty Retail | 13.86 | 100 | 0.53% | 26.12% |
| TDUP | ThredUp | | Internet Retail | 10.82 | 90 | 4.79% | 702.88% |
| LEG | Leggett & Platt | | Furnishings, Fixtures & Appliances | 9.61 | 100 | -1.83% | -3.90% |
| GOOS | Canada Goose | | Apparel Manufacturing | 12.98 | 80 | -0.63% | 10.77% |
| CYD | China Yuchai | | Auto Manufacturers | 33.39 | 90 | 1.11% | 231.90% |
| FOXF | Fox Factory | | Auto Parts | 28.93 | 60 | -1.83% | -6.24% |
| EVGO | EVgo | | Specialty Retail | 3.87 | 80 | -2.78% | -5.19% |
| CBRL | Cracker Barrel | | Restaurants | 59.82 | 0 | -7.15% | 5.20% |
| FWRG | First Watch | | Restaurants | 18.84 | 68 | 0.98% | -5.43% |
| FIGS | Figs | | Apparel Manufacturing | 7.05 | 70 | -2.94% | 11.95% |
| GIII | G-III Apparel | | Apparel Manufacturing | 27.00 | 60 | 0.77% | -20.14% |
| THRM | Gentherm | | Auto Parts | 36.77 | 40 | -1.42% | -13.16% |
| JMIA | Jumia Technologies | | Internet Retail | 8.60 | 90 | -1.10% | 88.22% |
| SG | Sweetgreen | | Restaurants | 9.10 | 50 | -0.44% | -71.99% |
| CNNE | Cannae | | Restaurants | 18.70 | 50 | -0.60% | -7.72% |
| For chart view version of above stock list: Chart View ➞ 0 - 25 , 25 - 50 , 50 - 75 , 75 - 100 , 100 - 125 , 125 - 150 , 150 - 175 , 175 - 200 , 200 - 225 , 225 - 250 , 250 - 275 , 275 - 300 , 300 - 325 , 325 - 350 , 350 - 375 , 375 - 400 | ||
 | Click To Change The Sort Order: By Market Cap or Company Size Performance: Year-to-date, Week and Day |  |
|
Get the most comprehensive stock market coverage daily at 12Stocks.com ➞ Best Stocks Today ➞ Best Stocks Weekly ➞ Best Stocks Year-to-Date ➞ Best Stocks Trends ➞  Best Stocks Today 12Stocks.com Best Nasdaq Stocks ➞ Best S&P 500 Stocks ➞ Best Tech Stocks ➞ Best Biotech Stocks ➞ |
| Detailed Overview of Consumer Services Stocks |
| Consumer Services Technical Overview, Leaders & Laggards, Top Consumer Services ETF Funds & Detailed Consumer Services Stocks List, Charts, Trends & More |
| Consumer Services Sector: Technical Analysis, Trends & YTD Performance | |
| Consumer Services sector is composed of stocks
from retail, entertainment, media/publishing, consumer goods
and services subsectors. Consumer Services sector, as represented by XLY, an exchange-traded fund [ETF] that holds basket of Consumer Services stocks (e.g, Walmart, Alibaba) is up by 0.83% and is currently underperforming the overall market by -6.89% year-to-date. Below is a quick view of Technical charts and trends: |
|
 XLY Weekly Chart |
|
| Long Term Trend: Very Good | |
| Medium Term Trend: Good | |
 XLY Daily Chart |
|
| Short Term Trend: Very Good | |
| Overall Trend Score: 100 | |
| YTD Performance: 0.83% | |
| **Trend Scores & Views Are Only For Educational Purposes And Not For Investing | |
| 12Stocks.com: Top Performing Consumer Services Sector Stocks | ||||||||||||||||||||||||||||||||||||||||||||||||
 The top performing Consumer Services sector stocks year to date are
Now, more recently, over last week, the top performing Consumer Services sector stocks on the move are


|
||||||||||||||||||||||||||||||||||||||||||||||||
| 12Stocks.com: Investing in Consumer Services Sector using Exchange Traded Funds | |
|
The following table shows list of key exchange traded funds (ETF) that
help investors track Consumer Services Index. For detailed view, check out our ETF Funds section of our website. Quick View: Move mouse or cursor over ETF symbol (ticker) to view short-term Technical chart and over ETF name to view long term chart. Click on ticker or stock name for detailed view. Click on to add stock symbol to your watchlist and to view watchlist. |
12Stocks.com List of ETFs that track Consumer Services Index
| Ticker | ETF Name | Watchlist | Recent Price | Smart Investing & Trading Score | Change % | Week % | Year-to-date % |
| 12Stocks.com: Charts, Trends, Fundamental Data and Performances of Consumer Services Stocks | |
|
We now take in-depth look at all Consumer Services stocks including charts, multi-period performances and overall trends (as measured by Smart Investing & Trading Score). One can sort Consumer Services stocks (click link to choose) by Daily, Weekly and by Year-to-Date performances. Also, one can sort by size of the company or by market capitalization. |
| Select Your Default Chart Type: | |||||
| |||||
| Click on stock symbol or name for detailed view. Click on to add stock symbol to your watchlist and to view watchlist. Quick View: Move mouse or cursor over "Daily" to quickly view daily Technical stock chart and over "Weekly" to view weekly Technical stock chart. | |||||

 | WINA Winmark Corporation |
| Sector: Services & Goods | |
| SubSector: Specialty Retail | |
| MarketCap: 1702.05 Millions | |
| Recent Price: 463.84 Smart Investing & Trading Score: 90 | |
| Day Percent Change: 1.73% Day Change: 7.46 | |
| Week Change: 2.5% Year-to-date Change: 12.3% | |
| WINA Links: Profile News Message Board | |
| Charts:- Daily , Weekly | |
| Add WINA to Watchlist: View: Get Complete WINA Trend Analysis ➞ | |
 | RVLV Revolve Group Inc |
| Sector: Services & Goods | |
| SubSector: Internet Retail | |
| MarketCap: 1699.69 Millions | |
| Recent Price: 22.37 Smart Investing & Trading Score: 100 | |
| Day Percent Change: 0.24% Day Change: 0.05 | |
| Week Change: -2.31% Year-to-date Change: -36.7% | |
| RVLV Links: Profile News Message Board | |
| Charts:- Daily , Weekly | |
| Add RVLV to Watchlist: View: Get Complete RVLV Trend Analysis ➞ | |
 | TILE Interface Inc |
| Sector: Services & Goods | |
| SubSector: Furnishings, Fixtures & Appliances | |
| MarketCap: 1644.63 Millions | |
| Recent Price: 26.72 Smart Investing & Trading Score: 100 | |
| Day Percent Change: -1.1% Day Change: -0.29 | |
| Week Change: -2.17% Year-to-date Change: 7.5% | |
| TILE Links: Profile News Message Board | |
| Charts:- Daily , Weekly | |
| Add TILE to Watchlist: View: Get Complete TILE Trend Analysis ➞ | |
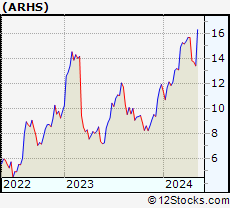 | ARHS Arhaus Inc |
| Sector: Services & Goods | |
| SubSector: Specialty Retail | |
| MarketCap: 1624.03 Millions | |
| Recent Price: 11.73 Smart Investing & Trading Score: 69 | |
| Day Percent Change: -1.82% Day Change: -0.22 | |
| Week Change: -4.04% Year-to-date Change: 26.3% | |
| ARHS Links: Profile News Message Board | |
| Charts:- Daily , Weekly | |
| Add ARHS to Watchlist: View: Get Complete ARHS Trend Analysis ➞ | |
 | PZZA Papa John's International, Inc |
| Sector: Services & Goods | |
| SubSector: Restaurants | |
| MarketCap: 1580.24 Millions | |
| Recent Price: 48.71 Smart Investing & Trading Score: 50 | |
| Day Percent Change: -1.62% Day Change: -0.73 | |
| Week Change: -6.89% Year-to-date Change: 10.5% | |
| PZZA Links: Profile News Message Board | |
| Charts:- Daily , Weekly | |
| Add PZZA to Watchlist: View: Get Complete PZZA Trend Analysis ➞ | |
 | TRS Trimas Corporation |
| Sector: Services & Goods | |
| SubSector: Packaging & Containers | |
| MarketCap: 1574.44 Millions | |
| Recent Price: 38.67 Smart Investing & Trading Score: 80 | |
| Day Percent Change: 0.86% Day Change: 0.32 | |
| Week Change: 1.89% Year-to-date Change: 53.9% | |
| TRS Links: Profile News Message Board | |
| Charts:- Daily , Weekly | |
| Add TRS to Watchlist: View: Get Complete TRS Trend Analysis ➞ | |
 | LGIH LGI Homes Inc |
| Sector: Services & Goods | |
| SubSector: Residential Construction | |
| MarketCap: 1545.03 Millions | |
| Recent Price: 61.91 Smart Investing & Trading Score: 100 | |
| Day Percent Change: -2.21% Day Change: -1.4 | |
| Week Change: -4.61% Year-to-date Change: -30.6% | |
| LGIH Links: Profile News Message Board | |
| Charts:- Daily , Weekly | |
| Add LGIH to Watchlist: View: Get Complete LGIH Trend Analysis ➞ | |
 | LZB La-Z-Boy Inc |
| Sector: Services & Goods | |
| SubSector: Furnishings, Fixtures & Appliances | |
| MarketCap: 1490.05 Millions | |
| Recent Price: 36.97 Smart Investing & Trading Score: 20 | |
| Day Percent Change: 1.22% Day Change: 0.42 | |
| Week Change: -9.87% Year-to-date Change: -19.3% | |
| LZB Links: Profile News Message Board | |
| Charts:- Daily , Weekly | |
| Add LZB to Watchlist: View: Get Complete LZB Trend Analysis ➞ | |
 | ARCO Arcos Dorados Holdings Inc |
| Sector: Services & Goods | |
| SubSector: Restaurants | |
| MarketCap: 1474.64 Millions | |
| Recent Price: 7.00 Smart Investing & Trading Score: 60 | |
| Day Percent Change: -1.13% Day Change: -0.08 | |
| Week Change: -6.92% Year-to-date Change: -2.5% | |
| ARCO Links: Profile News Message Board | |
| Charts:- Daily , Weekly | |
| Add ARCO to Watchlist: View: Get Complete ARCO Trend Analysis ➞ | |
 | PSNYW Polestar Automotive Holding UK PLC |
| Sector: Services & Goods | |
| SubSector: Auto Manufacturers | |
| MarketCap: 1450 Millions | |
| Recent Price: 0.31 Smart Investing & Trading Score: 73 | |
| Day Percent Change: 4.69% Day Change: 0.01 | |
| Week Change: 3.48% Year-to-date Change: 16.5% | |
| PSNYW Links: Profile News Message Board | |
| Charts:- Daily , Weekly | |
| Add PSNYW to Watchlist: View: Get Complete PSNYW Trend Analysis ➞ | |
 | SBH Sally Beauty Holdings Inc |
| Sector: Services & Goods | |
| SubSector: Specialty Retail | |
| MarketCap: 1435.69 Millions | |
| Recent Price: 13.86 Smart Investing & Trading Score: 100 | |
| Day Percent Change: 0.53% Day Change: 0.07 | |
| Week Change: -0.83% Year-to-date Change: 26.1% | |
| SBH Links: Profile News Message Board | |
| Charts:- Daily , Weekly | |
| Add SBH to Watchlist: View: Get Complete SBH Trend Analysis ➞ | |
 | TDUP ThredUp Inc |
| Sector: Services & Goods | |
| SubSector: Internet Retail | |
| MarketCap: 1428.67 Millions | |
| Recent Price: 10.82 Smart Investing & Trading Score: 90 | |
| Day Percent Change: 4.79% Day Change: 0.51 | |
| Week Change: 6.18% Year-to-date Change: 702.9% | |
| TDUP Links: Profile News Message Board | |
| Charts:- Daily , Weekly | |
| Add TDUP to Watchlist: View: Get Complete TDUP Trend Analysis ➞ | |
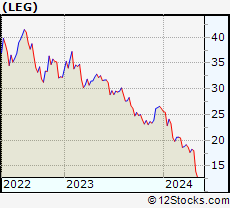 | LEG Leggett & Platt, Inc |
| Sector: Services & Goods | |
| SubSector: Furnishings, Fixtures & Appliances | |
| MarketCap: 1354.86 Millions | |
| Recent Price: 9.61 Smart Investing & Trading Score: 100 | |
| Day Percent Change: -1.83% Day Change: -0.17 | |
| Week Change: -2.98% Year-to-date Change: -3.9% | |
| LEG Links: Profile News Message Board | |
| Charts:- Daily , Weekly | |
| Add LEG to Watchlist: View: Get Complete LEG Trend Analysis ➞ | |
 | GOOS Canada Goose Holdings Inc |
| Sector: Services & Goods | |
| SubSector: Apparel Manufacturing | |
| MarketCap: 1299.77 Millions | |
| Recent Price: 12.98 Smart Investing & Trading Score: 80 | |
| Day Percent Change: -0.63% Day Change: -0.07 | |
| Week Change: -0.18% Year-to-date Change: 10.8% | |
| GOOS Links: Profile News Message Board | |
| Charts:- Daily , Weekly | |
| Add GOOS to Watchlist: View: Get Complete GOOS Trend Analysis ➞ | |
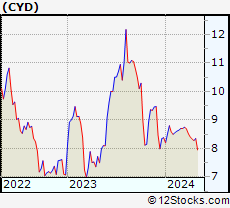 | CYD China Yuchai International |
| Sector: Services & Goods | |
| SubSector: Auto Manufacturers | |
| MarketCap: 1292.51 Millions | |
| Recent Price: 33.39 Smart Investing & Trading Score: 90 | |
| Day Percent Change: 1.11% Day Change: 0.34 | |
| Week Change: 8.53% Year-to-date Change: 231.9% | |
| CYD Links: Profile News Message Board | |
| Charts:- Daily , Weekly | |
| Add CYD to Watchlist: View: Get Complete CYD Trend Analysis ➞ | |
 | FOXF Fox Factory Holding Corp |
| Sector: Services & Goods | |
| SubSector: Auto Parts | |
| MarketCap: 1221.83 Millions | |
| Recent Price: 28.93 Smart Investing & Trading Score: 60 | |
| Day Percent Change: -1.83% Day Change: -0.53 | |
| Week Change: -4.35% Year-to-date Change: -6.2% | |
| FOXF Links: Profile News Message Board | |
| Charts:- Daily , Weekly | |
| Add FOXF to Watchlist: View: Get Complete FOXF Trend Analysis ➞ | |
 | EVGO EVgo Inc |
| Sector: Services & Goods | |
| SubSector: Specialty Retail | |
| MarketCap: 1208.44 Millions | |
| Recent Price: 3.87 Smart Investing & Trading Score: 80 | |
| Day Percent Change: -2.78% Day Change: -0.11 | |
| Week Change: 1.86% Year-to-date Change: -5.2% | |
| EVGO Links: Profile News Message Board | |
| Charts:- Daily , Weekly | |
| Add EVGO to Watchlist: View: Get Complete EVGO Trend Analysis ➞ | |
 | CBRL Cracker Barrel Old Country Store Inc |
| Sector: Services & Goods | |
| SubSector: Restaurants | |
| MarketCap: 1175.92 Millions | |
| Recent Price: 59.82 Smart Investing & Trading Score: 0 | |
| Day Percent Change: -7.15% Day Change: -4.22 | |
| Week Change: -12.39% Year-to-date Change: 5.2% | |
| CBRL Links: Profile News Message Board | |
| Charts:- Daily , Weekly | |
| Add CBRL to Watchlist: View: Get Complete CBRL Trend Analysis ➞ | |
 | FWRG First Watch Restaurant Group Inc |
| Sector: Services & Goods | |
| SubSector: Restaurants | |
| MarketCap: 1134.44 Millions | |
| Recent Price: 18.84 Smart Investing & Trading Score: 68 | |
| Day Percent Change: 0.98% Day Change: 0.17 | |
| Week Change: -1.46% Year-to-date Change: -5.4% | |
| FWRG Links: Profile News Message Board | |
| Charts:- Daily , Weekly | |
| Add FWRG to Watchlist: View: Get Complete FWRG Trend Analysis ➞ | |
 | FIGS Figs Inc |
| Sector: Services & Goods | |
| SubSector: Apparel Manufacturing | |
| MarketCap: 1124.95 Millions | |
| Recent Price: 7.05 Smart Investing & Trading Score: 70 | |
| Day Percent Change: -2.94% Day Change: -0.21 | |
| Week Change: 1.32% Year-to-date Change: 12.0% | |
| FIGS Links: Profile News Message Board | |
| Charts:- Daily , Weekly | |
| Add FIGS to Watchlist: View: Get Complete FIGS Trend Analysis ➞ | |
 | GIII G-III Apparel Group Ltd |
| Sector: Services & Goods | |
| SubSector: Apparel Manufacturing | |
| MarketCap: 1124.22 Millions | |
| Recent Price: 27.00 Smart Investing & Trading Score: 60 | |
| Day Percent Change: 0.77% Day Change: 0.2 | |
| Week Change: 1.64% Year-to-date Change: -20.1% | |
| GIII Links: Profile News Message Board | |
| Charts:- Daily , Weekly | |
| Add GIII to Watchlist: View: Get Complete GIII Trend Analysis ➞ | |
 | THRM Gentherm Inc |
| Sector: Services & Goods | |
| SubSector: Auto Parts | |
| MarketCap: 1100.39 Millions | |
| Recent Price: 36.77 Smart Investing & Trading Score: 40 | |
| Day Percent Change: -1.42% Day Change: -0.5 | |
| Week Change: -2.12% Year-to-date Change: -13.2% | |
| THRM Links: Profile News Message Board | |
| Charts:- Daily , Weekly | |
| Add THRM to Watchlist: View: Get Complete THRM Trend Analysis ➞ | |
 | JMIA Jumia Technologies Ag ADR |
| Sector: Services & Goods | |
| SubSector: Internet Retail | |
| MarketCap: 1085 Millions | |
| Recent Price: 8.60 Smart Investing & Trading Score: 90 | |
| Day Percent Change: -1.1% Day Change: -0.08 | |
| Week Change: -6.62% Year-to-date Change: 88.2% | |
| JMIA Links: Profile News Message Board | |
| Charts:- Daily , Weekly | |
| Add JMIA to Watchlist: View: Get Complete JMIA Trend Analysis ➞ | |
 | SG Sweetgreen Inc |
| Sector: Services & Goods | |
| SubSector: Restaurants | |
| MarketCap: 1055.63 Millions | |
| Recent Price: 9.10 Smart Investing & Trading Score: 50 | |
| Day Percent Change: -0.44% Day Change: -0.04 | |
| Week Change: -1.86% Year-to-date Change: -72.0% | |
| SG Links: Profile News Message Board | |
| Charts:- Daily , Weekly | |
| Add SG to Watchlist: View: Get Complete SG Trend Analysis ➞ | |
 | CNNE Cannae Holdings Inc |
| Sector: Services & Goods | |
| SubSector: Restaurants | |
| MarketCap: 1049.72 Millions | |
| Recent Price: 18.70 Smart Investing & Trading Score: 50 | |
| Day Percent Change: -0.6% Day Change: -0.11 | |
| Week Change: 1.06% Year-to-date Change: -7.7% | |
| CNNE Links: Profile News Message Board | |
| Charts:- Daily , Weekly | |
| Add CNNE to Watchlist: View: Get Complete CNNE Trend Analysis ➞ | |
| For tabular summary view of above stock list: Summary View ➞ 0 - 25 , 25 - 50 , 50 - 75 , 75 - 100 , 100 - 125 , 125 - 150 , 150 - 175 , 175 - 200 , 200 - 225 , 225 - 250 , 250 - 275 , 275 - 300 , 300 - 325 , 325 - 350 , 350 - 375 , 375 - 400 | ||
| Click To Change The Sort Order: By Market Cap or Company Size Performance: Year-to-date, Week and Day | |
| Select Chart Type: | ||
|
Best Stocks Today 12Stocks.com |
© 2025 12Stocks.com Terms & Conditions Privacy Contact Us
All Information Provided Only For Education And Not To Be Used For Investing or Trading. See Terms & Conditions


One More Thing ... Get Best Stocks Delivered Daily!
Never Ever Miss A Move With Our Top Ten Stocks Lists
Find Best Stocks In Any Market - Bull or Bear Market
Take A Peek At Our Top Ten Stocks Lists: Daily, Weekly, Year-to-Date & Top Trends
Find Best Stocks In Any Market - Bull or Bear Market
Take A Peek At Our Top Ten Stocks Lists: Daily, Weekly, Year-to-Date & Top Trends
Consumer Services Stocks With Best Up Trends [0-bearish to 100-bullish]: Designer Brands[100], Childrens Place[100], PDD [100], Lennar Corp[100], D.R. Horton[100], Mohawk Industries[100], Signet Jewelers[100], Shoe Carnival[100], H World[100], Pulte [100], Lowe's Cos[100]
Best Consumer Services Stocks Year-to-Date:
WW [2341.73%], ThredUp [702.88%], China Yuchai[231.9%], Niu Technologies[159.78%], Viomi Technology[154.48%], Cooper-Standard [153.02%], Nova Lifestyle[146.73%], National Vision[130.71%], Solid Power[128.57%], XPeng [92.47%], Super [88.69%] Best Consumer Services Stocks This Week:
Macy's [27.61%], Guess [25.88%], NIO [24.49%], Kandi Technologies[24.41%], Fossil [20%], Kohl's Corp[19.29%], Cooper-Standard [18.47%], Flexsteel Industries[18.05%], XPeng [17.39%], Smart Share[14.53%], MINISO [13.58%] Best Consumer Services Stocks Daily:
Cooper-Standard [16.38%], XPeng [11.68%], Viomi Technology[9.39%], NIO [9.27%], Funko [9.16%], Designer Brands[9.15%], Hamilton Beach[7.24%], MINISO [6.38%], Genesco [5.5%], Flexsteel Industries[5.47%], Solid Power[4.85%]