
 Login Sign Up


| |||||
 |  | ||||

| 12Stocks.com Market Intelligence |
Best Consumer Services Stocks
| In a hurry? Services & Goods Stocks: Performance Trends Table, Stock Charts
Sort Consumer Services: Daily, Weekly, Year-to-Date, Market Cap & Trends. Filter Services & Goods stocks list by size: All Large Mid-Range Small |
| 12Stocks.com Consumer Services Stocks Performances & Trends Daily | |||||||||
|
|  The overall Smart Investing & Trading Score is 100 (0-bearish to 100-bullish) which puts Consumer Services sector in short term bullish trend. The Smart Investing & Trading Score from previous trading session is 90 and an improvement of trend continues.
| ||||||||
Here are the Smart Investing & Trading Scores of the most requested Consumer Services stocks at 12Stocks.com (click stock name for detailed review):
|


| Consider signing up for our daily 12Stocks.com "Best Stocks Newsletter". You will never ever miss a big stock move again! |
| 12Stocks.com: Investing in Consumer Services sector with Stocks | |
|
The following table helps investors and traders sort through current performance and trends (as measured by Smart Investing & Trading Score) of various
stocks in the Consumer Services sector. Quick View: Move mouse or cursor over stock symbol (ticker) to view short-term Technical chart and over stock name to view long term chart. Click on  to add stock symbol to your watchlist and to add stock symbol to your watchlist and  to view watchlist. Click on any ticker or stock name for detailed market intelligence report for that stock. to view watchlist. Click on any ticker or stock name for detailed market intelligence report for that stock. |
12Stocks.com Performance of Stocks in Consumer Services Sector
| Ticker | Stock Name | Watchlist | Category | Recent Price | Smart Investing & Trading Score | Change % | YTD Change% |
| ORLY | O Reilly |   | Auto Parts | 102.64 | 50 | 20.16% | 29.84% |
| ASGN | ASGN | | Staffing | 52.10 | 50 | 19.88% | -37.49% |
| INSW | Seaways | | Services | 42.31 | 50 | 14.41% | 22.21% |
| SSP | E.W. Scripps | | Broadcasting | 3.07 | 50 | 6.93% | 38.91% |
| LE | Lands | | Retail | 13.19 | 50 | 4.88% | 0.38% |
| KMX | CarMax | | Automobile | 58.62 | 50 | 4.72% | -28.30% |
| EAT | Brinker | | Restaurants | 157.38 | 50 | 3.60% | 18.97% |
| FC | Franklin Covey | | Education | 19.68 | 50 | 3.48% | -47.63% |
| BJRI | BJ s | | Restaurants | 36.06 | 50 | 3.08% | 2.63% |
| LBRDK | Liberty Broadband | | Broadcasting | 61.35 | 50 | 3.02% | -12.34% |
| AMC | AMC Entertainment | | Entertainment | 3.07 | 50 | 2.85% | -22.86% |
| FIVE | Five Below | | Retail | 138.30 | 50 | 2.43% | 31.76% |
| NL | NL Industries | | Equipment | 6.56 | 50 | 2.41% | -13.36% |
| EEFT | Euronet Worldwide | | Services | 97.72 | 50 | 2.30% | -4.98% |
| JACK | Jack in | | Restaurants | 18.67 | 50 | 1.93% | -54.53% |
| TSCO | Tractor Supply | | Retail | 59.73 | 50 | 1.57% | 13.54% |
| CBZ | CBIZ | | Services | 65.03 | 50 | 1.55% | -20.53% |
| PSO | Pearson | | Publishing | 14.51 | 50 | 1.25% | -8.79% |
| GLP | Global Partners | | Basic Materials Wholesale | 50.98 | 50 | 1.14% | 14.38% |
| YUM | Yum! Brands | | Restaurants | 144.79 | 50 | 1.03% | 8.97% |
| IMAX | IMAX | | Entertainment | 25.77 | 50 | 0.83% | 0.66% |
| CMG | Chipotle Mexican | | Restaurants | 43.48 | 50 | 0.48% | -27.89% |
| BFAM | Bright Horizons | | Services | 119.58 | 50 | 0.41% | 7.88% |
| FWONA | Formula One | | Broadcasting | 89.43 | 50 | 0.28% | 6.41% |
| DRI | Darden Restaurants | | Restaurants | 206.92 | 50 | 0.24% | 13.29% |
| For chart view version of above stock list: Chart View ➞ 0 - 25 , 25 - 50 , 50 - 75 , 75 - 100 , 100 - 125 , 125 - 150 , 150 - 175 , 175 - 200 , 200 - 225 , 225 - 250 , 250 - 275 , 275 - 300 | ||
 | Click To Change The Sort Order: By Market Cap or Company Size Performance: Year-to-date, Week and Day |  |
|
Get the most comprehensive stock market coverage daily at 12Stocks.com ➞ Best Stocks Today ➞ Best Stocks Weekly ➞ Best Stocks Year-to-Date ➞ Best Stocks Trends ➞  Best Stocks Today 12Stocks.com Best Nasdaq Stocks ➞ Best S&P 500 Stocks ➞ Best Tech Stocks ➞ Best Biotech Stocks ➞ |
| Detailed Overview of Consumer Services Stocks |
| Consumer Services Technical Overview, Leaders & Laggards, Top Consumer Services ETF Funds & Detailed Consumer Services Stocks List, Charts, Trends & More |
| Consumer Services Sector: Technical Analysis, Trends & YTD Performance | |
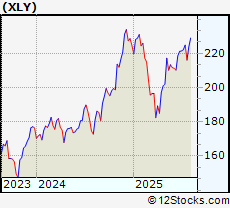
| Consumer Services sector is composed of stocks
from retail, entertainment, media/publishing, consumer goods
and services subsectors. Consumer Services sector, as represented by XLY, an exchange-traded fund [ETF] that holds basket of Consumer Services stocks (e.g, Walmart, Alibaba) is up by 2.95% and is currently underperforming the overall market by -7.38% year-to-date. Below is a quick view of Technical charts and trends: |
|
 XLY Weekly Chart |
|
| Long Term Trend: Very Good | |
| Medium Term Trend: Very Good | |
 XLY Daily Chart |
|
| Short Term Trend: Very Good | |
| Overall Trend Score: 100 | |
| YTD Performance: 2.95% | |
| **Trend Scores & Views Are Only For Educational Purposes And Not For Investing | |
| 12Stocks.com: Top Performing Consumer Services Sector Stocks | ||||||||||||||||||||||||||||||||||||||||||||||||
 The top performing Consumer Services sector stocks year to date are
Now, more recently, over last week, the top performing Consumer Services sector stocks on the move are


|
||||||||||||||||||||||||||||||||||||||||||||||||
| 12Stocks.com: Investing in Consumer Services Sector using Exchange Traded Funds | |
|
The following table shows list of key exchange traded funds (ETF) that
help investors track Consumer Services Index. For detailed view, check out our ETF Funds section of our website. Quick View: Move mouse or cursor over ETF symbol (ticker) to view short-term Technical chart and over ETF name to view long term chart. Click on ticker or stock name for detailed view. Click on to add stock symbol to your watchlist and to view watchlist. |
12Stocks.com List of ETFs that track Consumer Services Index
| Ticker | ETF Name | Watchlist | Recent Price | Smart Investing & Trading Score | Change % | Week % | Year-to-date % |
| XLY | Consumer Discret Sel | | 229.85 | 100 | 2.01 | 2.86 | 2.95% |
| RTH | Retail | | 247.67 | 100 | 0.63 | 0.8 | 10.46% |
| XRT | Retail | | 85.03 | 100 | 2.54 | 4.47 | 7.4% |
| IYK | Consumer Goods | | 70.39 | 70 | 0.37 | 1.49 | 8.38% |
| UCC | Consumer Services | | 49.99 | 100 | 2.96 | 5.78 | -2.73% |
| SCC | Short Consumer Services | | 15.90 | 0 | -19.86 | -5.49 | -12.44% |
| UGE | Consumer Goods | | 19.18 | 70 | 1.05 | 2.4 | 7.27% |
| 12Stocks.com: Charts, Trends, Fundamental Data and Performances of Consumer Services Stocks | |
|
We now take in-depth look at all Consumer Services stocks including charts, multi-period performances and overall trends (as measured by Smart Investing & Trading Score). One can sort Consumer Services stocks (click link to choose) by Daily, Weekly and by Year-to-Date performances. Also, one can sort by size of the company or by market capitalization. |
| Select Your Default Chart Type: | |||||
| |||||
| Click on stock symbol or name for detailed view. Click on to add stock symbol to your watchlist and to view watchlist. Quick View: Move mouse or cursor over "Daily" to quickly view daily Technical stock chart and over "Weekly" to view weekly Technical stock chart. | |||||

 | ORLY O Reilly Automotive, Inc. |
| Sector: Services & Goods | |
| SubSector: Auto Parts Stores | |
| MarketCap: 22391.5 Millions | |
| Recent Price: 102.64 Smart Investing & Trading Score: 50 | |
| Day Percent Change: 20.16% Day Change: 187.37 | |
| Week Change: -1.72% Year-to-date Change: 29.8% | |
| ORLY Links: Profile News Message Board | |
| Charts:- Daily , Weekly | |
| Add ORLY to Watchlist: View: Get Complete ORLY Trend Analysis ➞ | |
 | ASGN ASGN Incorporated |
| Sector: Services & Goods | |
| SubSector: Staffing & Outsourcing Services | |
| MarketCap: 2035.88 Millions | |
| Recent Price: 52.10 Smart Investing & Trading Score: 50 | |
| Day Percent Change: 19.88% Day Change: 15.94 | |
| Week Change: 3.11% Year-to-date Change: -37.5% | |
| ASGN Links: Profile News Message Board | |
| Charts:- Daily , Weekly | |
| Add ASGN to Watchlist: View: Get Complete ASGN Trend Analysis ➞ | |
 | INSW International Seaways, Inc. |
| Sector: Services & Goods | |
| SubSector: Business Services | |
| MarketCap: 521.582 Millions | |
| Recent Price: 42.31 Smart Investing & Trading Score: 50 | |
| Day Percent Change: 14.41% Day Change: 6.41 | |
| Week Change: -3.18% Year-to-date Change: 22.2% | |
| INSW Links: Profile News Message Board | |
| Charts:- Daily , Weekly | |
| Add INSW to Watchlist: View: Get Complete INSW Trend Analysis ➞ | |
 | SSP The E.W. Scripps Company |
| Sector: Services & Goods | |
| SubSector: Broadcasting - TV | |
| MarketCap: 766.163 Millions | |
| Recent Price: 3.07 Smart Investing & Trading Score: 50 | |
| Day Percent Change: 6.93% Day Change: 0.14 | |
| Week Change: -2.23% Year-to-date Change: 38.9% | |
| SSP Links: Profile News Message Board | |
| Charts:- Daily , Weekly | |
| Add SSP to Watchlist: View: Get Complete SSP Trend Analysis ➞ | |
 | LE Lands End, Inc. |
| Sector: Services & Goods | |
| SubSector: Catalog & Mail Order Houses | |
| MarketCap: 268.692 Millions | |
| Recent Price: 13.19 Smart Investing & Trading Score: 50 | |
| Day Percent Change: 4.88% Day Change: 0.72 | |
| Week Change: 0.08% Year-to-date Change: 0.4% | |
| LE Links: Profile News Message Board | |
| Charts:- Daily , Weekly | |
| Add LE to Watchlist: View: Get Complete LE Trend Analysis ➞ | |
 | KMX CarMax, Inc. |
| Sector: Services & Goods | |
| SubSector: Auto Dealerships | |
| MarketCap: 8121.71 Millions | |
| Recent Price: 58.62 Smart Investing & Trading Score: 50 | |
| Day Percent Change: 4.72% Day Change: 3.86 | |
| Week Change: 4.27% Year-to-date Change: -28.3% | |
| KMX Links: Profile News Message Board | |
| Charts:- Daily , Weekly | |
| Add KMX to Watchlist: View: Get Complete KMX Trend Analysis ➞ | |
 | EAT Brinker International, Inc. |
| Sector: Services & Goods | |
| SubSector: Restaurants | |
| MarketCap: 435.97 Millions | |
| Recent Price: 157.38 Smart Investing & Trading Score: 50 | |
| Day Percent Change: 3.6% Day Change: 2.47 | |
| Week Change: -1.07% Year-to-date Change: 19.0% | |
| EAT Links: Profile News Message Board | |
| Charts:- Daily , Weekly | |
| Add EAT to Watchlist: View: Get Complete EAT Trend Analysis ➞ | |
 | FC Franklin Covey Co. |
| Sector: Services & Goods | |
| SubSector: Education & Training Services | |
| MarketCap: 243.306 Millions | |
| Recent Price: 19.68 Smart Investing & Trading Score: 50 | |
| Day Percent Change: 3.48% Day Change: 1.34 | |
| Week Change: 1.29% Year-to-date Change: -47.6% | |
| FC Links: Profile News Message Board | |
| Charts:- Daily , Weekly | |
| Add FC to Watchlist: View: Get Complete FC Trend Analysis ➞ | |
 | BJRI BJ s Restaurants, Inc. |
| Sector: Services & Goods | |
| SubSector: Restaurants | |
| MarketCap: 183.67 Millions | |
| Recent Price: 36.06 Smart Investing & Trading Score: 50 | |
| Day Percent Change: 3.08% Day Change: 0.98 | |
| Week Change: 5.53% Year-to-date Change: 2.6% | |
| BJRI Links: Profile News Message Board | |
| Charts:- Daily , Weekly | |
| Add BJRI to Watchlist: View: Get Complete BJRI Trend Analysis ➞ | |
 | LBRDK Liberty Broadband Corporation |
| Sector: Services & Goods | |
| SubSector: Broadcasting - TV | |
| MarketCap: 13847.3 Millions | |
| Recent Price: 61.35 Smart Investing & Trading Score: 50 | |
| Day Percent Change: 3.02% Day Change: 1.82 | |
| Week Change: 2.99% Year-to-date Change: -12.3% | |
| LBRDK Links: Profile News Message Board | |
| Charts:- Daily , Weekly | |
| Add LBRDK to Watchlist: View: Get Complete LBRDK Trend Analysis ➞ | |
 | AMC AMC Entertainment Holdings, Inc. |
| Sector: Services & Goods | |
| SubSector: Movie Production, Theaters | |
| MarketCap: 415.929 Millions | |
| Recent Price: 3.07 Smart Investing & Trading Score: 50 | |
| Day Percent Change: 2.85% Day Change: 0.14 | |
| Week Change: 10.43% Year-to-date Change: -22.9% | |
| AMC Links: Profile News Message Board | |
| Charts:- Daily , Weekly | |
| Add AMC to Watchlist: View: Get Complete AMC Trend Analysis ➞ | |
 | FIVE Five Below, Inc. |
| Sector: Services & Goods | |
| SubSector: Specialty Retail, Other | |
| MarketCap: 3693.74 Millions | |
| Recent Price: 138.30 Smart Investing & Trading Score: 50 | |
| Day Percent Change: 2.43% Day Change: 1.96 | |
| Week Change: 2.04% Year-to-date Change: 31.8% | |
| FIVE Links: Profile News Message Board | |
| Charts:- Daily , Weekly | |
| Add FIVE to Watchlist: View: Get Complete FIVE Trend Analysis ➞ | |
 | NL NL Industries, Inc. |
| Sector: Services & Goods | |
| SubSector: Industrial Equipment Wholesale | |
| MarketCap: 126.258 Millions | |
| Recent Price: 6.56 Smart Investing & Trading Score: 50 | |
| Day Percent Change: 2.41% Day Change: 0.16 | |
| Week Change: 15.09% Year-to-date Change: -13.4% | |
| NL Links: Profile News Message Board | |
| Charts:- Daily , Weekly | |
| Add NL to Watchlist: View: Get Complete NL Trend Analysis ➞ | |
 | EEFT Euronet Worldwide, Inc. |
| Sector: Services & Goods | |
| SubSector: Business Services | |
| MarketCap: 4809.62 Millions | |
| Recent Price: 97.72 Smart Investing & Trading Score: 50 | |
| Day Percent Change: 2.3% Day Change: 2.38 | |
| Week Change: 5.75% Year-to-date Change: -5.0% | |
| EEFT Links: Profile News Message Board | |
| Charts:- Daily , Weekly | |
| Add EEFT to Watchlist: View: Get Complete EEFT Trend Analysis ➞ | |
 | JACK Jack in the Box Inc. |
| Sector: Services & Goods | |
| SubSector: Restaurants | |
| MarketCap: 633.87 Millions | |
| Recent Price: 18.67 Smart Investing & Trading Score: 50 | |
| Day Percent Change: 1.93% Day Change: 0.98 | |
| Week Change: -1.43% Year-to-date Change: -54.5% | |
| JACK Links: Profile News Message Board | |
| Charts:- Daily , Weekly | |
| Add JACK to Watchlist: View: Get Complete JACK Trend Analysis ➞ | |
 | TSCO Tractor Supply Company |
| Sector: Services & Goods | |
| SubSector: Specialty Retail, Other | |
| MarketCap: 9692.94 Millions | |
| Recent Price: 59.73 Smart Investing & Trading Score: 50 | |
| Day Percent Change: 1.57% Day Change: 4.15 | |
| Week Change: -0.86% Year-to-date Change: 13.5% | |
| TSCO Links: Profile News Message Board | |
| Charts:- Daily , Weekly | |
| Add TSCO to Watchlist: View: Get Complete TSCO Trend Analysis ➞ | |
 | CBZ CBIZ, Inc. |
| Sector: Services & Goods | |
| SubSector: Business Services | |
| MarketCap: 1121.32 Millions | |
| Recent Price: 65.03 Smart Investing & Trading Score: 50 | |
| Day Percent Change: 1.55% Day Change: 1.1 | |
| Week Change: 4.97% Year-to-date Change: -20.5% | |
| CBZ Links: Profile News Message Board | |
| Charts:- Daily , Weekly | |
| Add CBZ to Watchlist: View: Get Complete CBZ Trend Analysis ➞ | |
 | PSO Pearson plc |
| Sector: Services & Goods | |
| SubSector: Publishing - Books | |
| MarketCap: 4595.42 Millions | |
| Recent Price: 14.51 Smart Investing & Trading Score: 50 | |
| Day Percent Change: 1.25% Day Change: 0.17 | |
| Week Change: 0.35% Year-to-date Change: -8.8% | |
| PSO Links: Profile News Message Board | |
| Charts:- Daily , Weekly | |
| Add PSO to Watchlist: View: Get Complete PSO Trend Analysis ➞ | |
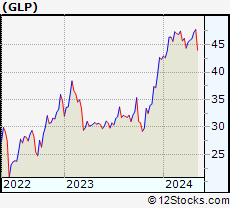 | GLP Global Partners LP |
| Sector: Services & Goods | |
| SubSector: Basic Materials Wholesale | |
| MarketCap: 416.73 Millions | |
| Recent Price: 50.98 Smart Investing & Trading Score: 50 | |
| Day Percent Change: 1.14% Day Change: 0.48 | |
| Week Change: 3.17% Year-to-date Change: 14.4% | |
| GLP Links: Profile News Message Board | |
| Charts:- Daily , Weekly | |
| Add GLP to Watchlist: View: Get Complete GLP Trend Analysis ➞ | |
 | YUM Yum! Brands, Inc. |
| Sector: Services & Goods | |
| SubSector: Restaurants | |
| MarketCap: 18033.3 Millions | |
| Recent Price: 144.79 Smart Investing & Trading Score: 50 | |
| Day Percent Change: 1.03% Day Change: 1.38 | |
| Week Change: 2.44% Year-to-date Change: 9.0% | |
| YUM Links: Profile News Message Board | |
| Charts:- Daily , Weekly | |
| Add YUM to Watchlist: View: Get Complete YUM Trend Analysis ➞ | |
 | IMAX IMAX Corporation |
| Sector: Services & Goods | |
| SubSector: Entertainment - Diversified | |
| MarketCap: 874.237 Millions | |
| Recent Price: 25.77 Smart Investing & Trading Score: 50 | |
| Day Percent Change: 0.83% Day Change: 0.18 | |
| Week Change: 5.14% Year-to-date Change: 0.7% | |
| IMAX Links: Profile News Message Board | |
| Charts:- Daily , Weekly | |
| Add IMAX to Watchlist: View: Get Complete IMAX Trend Analysis ➞ | |
 | CMG Chipotle Mexican Grill, Inc. |
| Sector: Services & Goods | |
| SubSector: Restaurants | |
| MarketCap: 16849.9 Millions | |
| Recent Price: 43.48 Smart Investing & Trading Score: 50 | |
| Day Percent Change: 0.48% Day Change: 0.26 | |
| Week Change: 1.85% Year-to-date Change: -27.9% | |
| CMG Links: Profile News Message Board | |
| Charts:- Daily , Weekly | |
| Add CMG to Watchlist: View: Get Complete CMG Trend Analysis ➞ | |
 | BFAM Bright Horizons Family Solutions Inc. |
| Sector: Services & Goods | |
| SubSector: Personal Services | |
| MarketCap: 5487.65 Millions | |
| Recent Price: 119.58 Smart Investing & Trading Score: 50 | |
| Day Percent Change: 0.41% Day Change: 0.56 | |
| Week Change: 0.33% Year-to-date Change: 7.9% | |
| BFAM Links: Profile News Message Board | |
| Charts:- Daily , Weekly | |
| Add BFAM to Watchlist: View: Get Complete BFAM Trend Analysis ➞ | |
 | FWONA Formula One Group |
| Sector: Services & Goods | |
| SubSector: Broadcasting - TV | |
| MarketCap: 17485.6 Millions | |
| Recent Price: 89.43 Smart Investing & Trading Score: 50 | |
| Day Percent Change: 0.28% Day Change: 0.2 | |
| Week Change: 0.3% Year-to-date Change: 6.4% | |
| FWONA Links: Profile News Message Board | |
| Charts:- Daily , Weekly | |
| Add FWONA to Watchlist: View: Get Complete FWONA Trend Analysis ➞ | |
 | DRI Darden Restaurants, Inc. |
| Sector: Services & Goods | |
| SubSector: Restaurants | |
| MarketCap: 5623.1 Millions | |
| Recent Price: 206.92 Smart Investing & Trading Score: 50 | |
| Day Percent Change: 0.24% Day Change: 0.37 | |
| Week Change: 0.86% Year-to-date Change: 13.3% | |
| DRI Links: Profile News Message Board | |
| Charts:- Daily , Weekly | |
| Add DRI to Watchlist: View: Get Complete DRI Trend Analysis ➞ | |
| For tabular summary view of above stock list: Summary View ➞ 0 - 25 , 25 - 50 , 50 - 75 , 75 - 100 , 100 - 125 , 125 - 150 , 150 - 175 , 175 - 200 , 200 - 225 , 225 - 250 , 250 - 275 , 275 - 300 | ||
| Click To Change The Sort Order: By Market Cap or Company Size Performance: Year-to-date, Week and Day | |
| Select Chart Type: | ||
|
Best Stocks Today 12Stocks.com |
© 2025 12Stocks.com Terms & Conditions Privacy Contact Us
All Information Provided Only For Education And Not To Be Used For Investing or Trading. See Terms & Conditions


One More Thing ... Get Best Stocks Delivered Daily!
Never Ever Miss A Move With Our Top Ten Stocks Lists
Find Best Stocks In Any Market - Bull or Bear Market
Take A Peek At Our Top Ten Stocks Lists: Daily, Weekly, Year-to-Date & Top Trends
Find Best Stocks In Any Market - Bull or Bear Market
Take A Peek At Our Top Ten Stocks Lists: Daily, Weekly, Year-to-Date & Top Trends
Consumer Services Stocks With Best Up Trends [0-bearish to 100-bullish]: Daily Journal[100], Napco Security[100], Louisiana-Pacific [100], Ritchie Bros.[100], eBay [100], Graham [100], Fastenal [100], AECOM [100], Kelly Services[100], Wayfair [100], Gray Television[100]
Best Consumer Services Stocks Year-to-Date:
Willdan [210.66%], Kratos Defense[160.61%], Altisource Portfolio[97.94%], Gray Television[94.26%], Wayfair [77.55%], Noodles & [76.23%], VSE [73.56%], Sears [67.56%], eBay [64.06%], WNS ()[58.64%], Dollar General[55.7%] Best Consumer Services Stocks This Week:
Willdan [34.44%], Gray Television[33.03%], Park-Ohio [27.27%], TEGNA [27.26%], Etsy [24.72%], AMC Networks[22.47%], Deluxe [21.77%], Kohl s[19.15%], Petco Health[19%], Kelly Services[18.78%], CompX [18.12%] Best Consumer Services Stocks Daily:
CareDx [185.69%], Wingstop [150.46%], National CineMedia[112.46%], VSE [69.41%], Burlington Stores[66.03%], Myriad Genetics[64.88%], Costco Wholesale[58.1%], Daily Journal[57.5%], Texas Roadhouse[55.27%], Royal Caribbean[53.63%], CRA [53.26%]