
 Login Sign Up


| |||||
 |  | ||||

| 12Stocks.com Market Intelligence |
Best Consumer Services Stocks
| In a hurry? Services & Goods Stocks: Performance Trends Table, Stock Charts
Sort Consumer Services: Daily, Weekly, Year-to-Date, Market Cap & Trends. Filter Services & Goods stocks list by size: All Large Mid-Range Small |
| 12Stocks.com Consumer Services Stocks Performances & Trends Daily | |||||||||
|
|  The overall Smart Investing & Trading Score is 100 (0-bearish to 100-bullish) which puts Consumer Services sector in short term bullish trend. The Smart Investing & Trading Score from previous trading session is 90 and an improvement of trend continues.
| ||||||||
Here are the Smart Investing & Trading Scores of the most requested Consumer Services stocks at 12Stocks.com (click stock name for detailed review):
|


| Consider signing up for our daily 12Stocks.com "Best Stocks Newsletter". You will never ever miss a big stock move again! |
| 12Stocks.com: Investing in Consumer Services sector with Stocks | |
|
The following table helps investors and traders sort through current performance and trends (as measured by Smart Investing & Trading Score) of various
stocks in the Consumer Services sector. Quick View: Move mouse or cursor over stock symbol (ticker) to view short-term Technical chart and over stock name to view long term chart. Click on  to add stock symbol to your watchlist and to add stock symbol to your watchlist and  to view watchlist. Click on any ticker or stock name for detailed market intelligence report for that stock. to view watchlist. Click on any ticker or stock name for detailed market intelligence report for that stock. |
12Stocks.com Performance of Stocks in Consumer Services Sector
| Ticker | Stock Name | Watchlist | Category | Recent Price | Smart Investing & Trading Score | Change % | YTD Change% |
| CSV | Carriage Services |   | Services | 47.94 | 60 | 3.86% | 21.27% |
| VLGEA | Village Super | | Grocery | 36.32 | 60 | 3.83% | 16.31% |
| RHI | Robert Half | | Staffing | 36.66 | 60 | 2.92% | -46.78% |
| DIS | Walt Disney | | Entertainment | 116.64 | 60 | 2.76% | 5.20% |
| WBA | Walgreens Boots | | Drug Stores | 11.89 | 60 | 2.33% | 27.44% |
| PLCE | Children s | | Apparel | 4.65 | 60 | 2.24% | -55.54% |
| SBUX | Starbucks | | Restaurants | 94.18 | 60 | 1.70% | 4.50% |
| LOPE | Grand Canyon | | Education | 198.00 | 60 | 1.35% | 20.88% |
| SBGI | Slair Broadcast | | Broadcasting | 14.75 | 60 | 1.30% | -5.36% |
| MUSA | Murphy USA | | Retail | 394.76 | 60 | 1.21% | -21.15% |
| FCN | FTI Consulting | | Services | 169.08 | 60 | 0.25% | -11.54% |
| DG | Dollar General | | Retail | 115.79 | 60 | 0.24% | 55.70% |
| PLAY | Dave & Buster s Entertainment | | Restaurants | 26.27 | 60 | 0.12% | -10.00% |
| QGEN | QIAGEN N.V | | Research | 49.23 | 60 | -1.17% | 14.32% |
| MBLY | Mobileye Global | | Auto Parts | 14.25 | 60 | -5.01% | -28.46% |
| ARMK | Aramark | | Restaurants | 40.74 | 60 | -12.80% | 10.08% |
| WEN | Wendy s | | Restaurants | 10.41 | 60 | -22.23% | -34.28% |
| CCRN | Cross Country | | Staffing | 13.11 | 60 | -32.48% | -27.81% |
| YUMC | Yum China | | Restaurants | 45.61 | 60 | -41.09% | -4.33% |
| FORR | Forrester Research | | Research | 10.20 | 60 | -43.13% | -34.91% |
| TV | Grupo Televisa | | Broadcasting | 2.38 | 60 | -58.66% | 48.44% |
| RRGB | Red Robin | | Restaurants | 6.00 | 60 | -69.46% | 9.29% |
| MYGN | Myriad Genetics | | Research | 5.87 | 50 | 64.88% | -57.18% |
| OLLI | Ollie s | | Retail | 135.24 | 50 | 37.73% | 23.25% |
| GWW | W.W. Grainger | | Equipment | 982.07 | 50 | 37.67% | -6.22% |
| For chart view version of above stock list: Chart View ➞ 0 - 25 , 25 - 50 , 50 - 75 , 75 - 100 , 100 - 125 , 125 - 150 , 150 - 175 , 175 - 200 , 200 - 225 , 225 - 250 , 250 - 275 , 275 - 300 | ||
 | Click To Change The Sort Order: By Market Cap or Company Size Performance: Year-to-date, Week and Day |  |
|
Get the most comprehensive stock market coverage daily at 12Stocks.com ➞ Best Stocks Today ➞ Best Stocks Weekly ➞ Best Stocks Year-to-Date ➞ Best Stocks Trends ➞  Best Stocks Today 12Stocks.com Best Nasdaq Stocks ➞ Best S&P 500 Stocks ➞ Best Tech Stocks ➞ Best Biotech Stocks ➞ |
| Detailed Overview of Consumer Services Stocks |
| Consumer Services Technical Overview, Leaders & Laggards, Top Consumer Services ETF Funds & Detailed Consumer Services Stocks List, Charts, Trends & More |
| Consumer Services Sector: Technical Analysis, Trends & YTD Performance | |
| Consumer Services sector is composed of stocks
from retail, entertainment, media/publishing, consumer goods
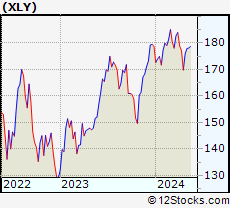
and services subsectors. Consumer Services sector, as represented by XLY, an exchange-traded fund [ETF] that holds basket of Consumer Services stocks (e.g, Walmart, Alibaba) is up by 2.95% and is currently underperforming the overall market by -7.38% year-to-date. Below is a quick view of Technical charts and trends: |
|
 XLY Weekly Chart |
|
| Long Term Trend: Very Good | |
| Medium Term Trend: Very Good | |
 XLY Daily Chart |
|
| Short Term Trend: Very Good | |
| Overall Trend Score: 100 | |
| YTD Performance: 2.95% | |
| **Trend Scores & Views Are Only For Educational Purposes And Not For Investing | |
| 12Stocks.com: Top Performing Consumer Services Sector Stocks | ||||||||||||||||||||||||||||||||||||||||||||||||
 The top performing Consumer Services sector stocks year to date are
Now, more recently, over last week, the top performing Consumer Services sector stocks on the move are


|
||||||||||||||||||||||||||||||||||||||||||||||||
| 12Stocks.com: Investing in Consumer Services Sector using Exchange Traded Funds | |
|
The following table shows list of key exchange traded funds (ETF) that
help investors track Consumer Services Index. For detailed view, check out our ETF Funds section of our website. Quick View: Move mouse or cursor over ETF symbol (ticker) to view short-term Technical chart and over ETF name to view long term chart. Click on ticker or stock name for detailed view. Click on to add stock symbol to your watchlist and to view watchlist. |
12Stocks.com List of ETFs that track Consumer Services Index
| Ticker | ETF Name | Watchlist | Recent Price | Smart Investing & Trading Score | Change % | Week % | Year-to-date % |
| XLY | Consumer Discret Sel | | 229.85 | 100 | 2.01 | 2.86 | 2.95% |
| RTH | Retail | | 247.67 | 100 | 0.63 | 0.8 | 10.46% |
| XRT | Retail | | 85.03 | 100 | 2.54 | 4.47 | 7.4% |
| IYK | Consumer Goods | | 70.39 | 70 | 0.37 | 1.49 | 8.38% |
| UCC | Consumer Services | | 49.99 | 100 | 2.96 | 5.78 | -2.73% |
| SCC | Short Consumer Services | | 15.90 | 0 | -19.86 | -5.49 | -12.44% |
| UGE | Consumer Goods | | 19.18 | 70 | 1.05 | 2.4 | 7.27% |
| 12Stocks.com: Charts, Trends, Fundamental Data and Performances of Consumer Services Stocks | |
|
We now take in-depth look at all Consumer Services stocks including charts, multi-period performances and overall trends (as measured by Smart Investing & Trading Score). One can sort Consumer Services stocks (click link to choose) by Daily, Weekly and by Year-to-Date performances. Also, one can sort by size of the company or by market capitalization. |
| Select Your Default Chart Type: | |||||
| |||||
| Click on stock symbol or name for detailed view. Click on to add stock symbol to your watchlist and to view watchlist. Quick View: Move mouse or cursor over "Daily" to quickly view daily Technical stock chart and over "Weekly" to view weekly Technical stock chart. | |||||

 | CSV Carriage Services, Inc. |
| Sector: Services & Goods | |
| SubSector: Personal Services | |
| MarketCap: 304.725 Millions | |
| Recent Price: 47.94 Smart Investing & Trading Score: 60 | |
| Day Percent Change: 3.86% Day Change: 1.2 | |
| Week Change: 3.74% Year-to-date Change: 21.3% | |
| CSV Links: Profile News Message Board | |
| Charts:- Daily , Weekly | |
| Add CSV to Watchlist: View: Get Complete CSV Trend Analysis ➞ | |
 | VLGEA Village Super Market, Inc. |
| Sector: Services & Goods | |
| SubSector: Grocery Stores | |
| MarketCap: 222.375 Millions | |
| Recent Price: 36.32 Smart Investing & Trading Score: 60 | |
| Day Percent Change: 3.83% Day Change: 1.16 | |
| Week Change: 3.89% Year-to-date Change: 16.3% | |
| VLGEA Links: Profile News Message Board | |
| Charts:- Daily , Weekly | |
| Add VLGEA to Watchlist: View: Get Complete VLGEA Trend Analysis ➞ | |
 | RHI Robert Half International Inc. |
| Sector: Services & Goods | |
| SubSector: Staffing & Outsourcing Services | |
| MarketCap: 4302 Millions | |
| Recent Price: 36.66 Smart Investing & Trading Score: 60 | |
| Day Percent Change: 2.92% Day Change: 1.81 | |
| Week Change: 5.77% Year-to-date Change: -46.8% | |
| RHI Links: Profile News Message Board | |
| Charts:- Daily , Weekly | |
| Add RHI to Watchlist: View: Get Complete RHI Trend Analysis ➞ | |
 | DIS The Walt Disney Company |
| Sector: Services & Goods | |
| SubSector: Entertainment - Diversified | |
| MarketCap: 178396 Millions | |
| Recent Price: 116.64 Smart Investing & Trading Score: 60 | |
| Day Percent Change: 2.76% Day Change: 2.43 | |
| Week Change: 1.28% Year-to-date Change: 5.2% | |
| DIS Links: Profile News Message Board | |
| Charts:- Daily , Weekly | |
| Add DIS to Watchlist: View: Get Complete DIS Trend Analysis ➞ | |
 | WBA Walgreens Boots Alliance, Inc. |
| Sector: Services & Goods | |
| SubSector: Drug Stores | |
| MarketCap: 46184.1 Millions | |
| Recent Price: 11.89 Smart Investing & Trading Score: 60 | |
| Day Percent Change: 2.33% Day Change: 0.24 | |
| Week Change: 0.51% Year-to-date Change: 27.4% | |
| WBA Links: Profile News Message Board | |
| Charts:- Daily , Weekly | |
| Add WBA to Watchlist: View: Get Complete WBA Trend Analysis ➞ | |
 | PLCE The Children s Place, Inc. |
| Sector: Services & Goods | |
| SubSector: Apparel Stores | |
| MarketCap: 303.608 Millions | |
| Recent Price: 4.65 Smart Investing & Trading Score: 60 | |
| Day Percent Change: 2.24% Day Change: 0.14 | |
| Week Change: -1.9% Year-to-date Change: -55.5% | |
| PLCE Links: Profile News Message Board | |
| Charts:- Daily , Weekly | |
| Add PLCE to Watchlist: View: Get Complete PLCE Trend Analysis ➞ | |
 | SBUX Starbucks Corporation |
| Sector: Services & Goods | |
| SubSector: Specialty Eateries | |
| MarketCap: 74909.7 Millions | |
| Recent Price: 94.18 Smart Investing & Trading Score: 60 | |
| Day Percent Change: 1.7% Day Change: 1.57 | |
| Week Change: 5.83% Year-to-date Change: 4.5% | |
| SBUX Links: Profile News Message Board | |
| Charts:- Daily , Weekly | |
| Add SBUX to Watchlist: View: Get Complete SBUX Trend Analysis ➞ | |
 | LOPE Grand Canyon Education, Inc. |
| Sector: Services & Goods | |
| SubSector: Education & Training Services | |
| MarketCap: 3073.56 Millions | |
| Recent Price: 198.00 Smart Investing & Trading Score: 60 | |
| Day Percent Change: 1.35% Day Change: 1.89 | |
| Week Change: 15.08% Year-to-date Change: 20.9% | |
| LOPE Links: Profile News Message Board | |
| Charts:- Daily , Weekly | |
| Add LOPE to Watchlist: View: Get Complete LOPE Trend Analysis ➞ | |
 | SBGI Sinclair Broadcast Group, Inc. |
| Sector: Services & Goods | |
| SubSector: Broadcasting - TV | |
| MarketCap: 1461.73 Millions | |
| Recent Price: 14.75 Smart Investing & Trading Score: 60 | |
| Day Percent Change: 1.3% Day Change: 0.18 | |
| Week Change: 4.39% Year-to-date Change: -5.4% | |
| SBGI Links: Profile News Message Board | |
| Charts:- Daily , Weekly | |
| Add SBGI to Watchlist: View: Get Complete SBGI Trend Analysis ➞ | |
 | MUSA Murphy USA Inc. |
| Sector: Services & Goods | |
| SubSector: Specialty Retail, Other | |
| MarketCap: 3133.14 Millions | |
| Recent Price: 394.76 Smart Investing & Trading Score: 60 | |
| Day Percent Change: 1.21% Day Change: 6.14 | |
| Week Change: 7.39% Year-to-date Change: -21.2% | |
| MUSA Links: Profile News Message Board | |
| Charts:- Daily , Weekly | |
| Add MUSA to Watchlist: View: Get Complete MUSA Trend Analysis ➞ | |
 | FCN FTI Consulting, Inc. |
| Sector: Services & Goods | |
| SubSector: Management Services | |
| MarketCap: 4485.05 Millions | |
| Recent Price: 169.08 Smart Investing & Trading Score: 60 | |
| Day Percent Change: 0.25% Day Change: 0.55 | |
| Week Change: 0.63% Year-to-date Change: -11.5% | |
| FCN Links: Profile News Message Board | |
| Charts:- Daily , Weekly | |
| Add FCN to Watchlist: View: Get Complete FCN Trend Analysis ➞ | |
 | DG Dollar General Corporation |
| Sector: Services & Goods | |
| SubSector: Discount, Variety Stores | |
| MarketCap: 39611.9 Millions | |
| Recent Price: 115.79 Smart Investing & Trading Score: 60 | |
| Day Percent Change: 0.24% Day Change: 0.3 | |
| Week Change: 2.18% Year-to-date Change: 55.7% | |
| DG Links: Profile News Message Board | |
| Charts:- Daily , Weekly | |
| Add DG to Watchlist: View: Get Complete DG Trend Analysis ➞ | |
 | PLAY Dave & Buster s Entertainment, Inc. |
| Sector: Services & Goods | |
| SubSector: Restaurants | |
| MarketCap: 283.07 Millions | |
| Recent Price: 26.27 Smart Investing & Trading Score: 60 | |
| Day Percent Change: 0.12% Day Change: 0.04 | |
| Week Change: 4.41% Year-to-date Change: -10.0% | |
| PLAY Links: Profile News Message Board | |
| Charts:- Daily , Weekly | |
| Add PLAY to Watchlist: View: Get Complete PLAY Trend Analysis ➞ | |
 | QGEN QIAGEN N.V. |
| Sector: Services & Goods | |
| SubSector: Research Services | |
| MarketCap: 8698.94 Millions | |
| Recent Price: 49.23 Smart Investing & Trading Score: 60 | |
| Day Percent Change: -1.17% Day Change: -0.55 | |
| Week Change: 3.66% Year-to-date Change: 14.3% | |
| QGEN Links: Profile News Message Board | |
| Charts:- Daily , Weekly | |
| Add QGEN to Watchlist: View: Get Complete QGEN Trend Analysis ➞ | |
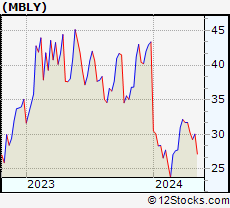 | MBLY Mobileye Global Inc. |
| Sector: Services & Goods | |
| SubSector: Auto Parts | |
| MarketCap: 31280 Millions | |
| Recent Price: 14.25 Smart Investing & Trading Score: 60 | |
| Day Percent Change: -5.01% Day Change: -0.76 | |
| Week Change: 2.44% Year-to-date Change: -28.5% | |
| MBLY Links: Profile News Message Board | |
| Charts:- Daily , Weekly | |
| Add MBLY to Watchlist: View: Get Complete MBLY Trend Analysis ➞ | |
 | ARMK Aramark |
| Sector: Services & Goods | |
| SubSector: Specialty Eateries | |
| MarketCap: 5242.27 Millions | |
| Recent Price: 40.74 Smart Investing & Trading Score: 60 | |
| Day Percent Change: -12.8% Day Change: -5.22 | |
| Week Change: 3.48% Year-to-date Change: 10.1% | |
| ARMK Links: Profile News Message Board | |
| Charts:- Daily , Weekly | |
| Add ARMK to Watchlist: View: Get Complete ARMK Trend Analysis ➞ | |
 | WEN The Wendy s Company |
| Sector: Services & Goods | |
| SubSector: Restaurants | |
| MarketCap: 2814.9 Millions | |
| Recent Price: 10.41 Smart Investing & Trading Score: 60 | |
| Day Percent Change: -22.23% Day Change: -4.83 | |
| Week Change: 3.69% Year-to-date Change: -34.3% | |
| WEN Links: Profile News Message Board | |
| Charts:- Daily , Weekly | |
| Add WEN to Watchlist: View: Get Complete WEN Trend Analysis ➞ | |
 | CCRN Cross Country Healthcare, Inc. |
| Sector: Services & Goods | |
| SubSector: Staffing & Outsourcing Services | |
| MarketCap: 348.328 Millions | |
| Recent Price: 13.11 Smart Investing & Trading Score: 60 | |
| Day Percent Change: -32.48% Day Change: -7.38 | |
| Week Change: 0.08% Year-to-date Change: -27.8% | |
| CCRN Links: Profile News Message Board | |
| Charts:- Daily , Weekly | |
| Add CCRN to Watchlist: View: Get Complete CCRN Trend Analysis ➞ | |
 | YUMC Yum China Holdings, Inc. |
| Sector: Services & Goods | |
| SubSector: Restaurants | |
| MarketCap: 16284.5 Millions | |
| Recent Price: 45.61 Smart Investing & Trading Score: 60 | |
| Day Percent Change: -41.09% Day Change: -23.28 | |
| Week Change: 1.81% Year-to-date Change: -4.3% | |
| YUMC Links: Profile News Message Board | |
| Charts:- Daily , Weekly | |
| Add YUMC to Watchlist: View: Get Complete YUMC Trend Analysis ➞ | |
 | FORR Forrester Research, Inc. |
| Sector: Services & Goods | |
| SubSector: Research Services | |
| MarketCap: 473.394 Millions | |
| Recent Price: 10.20 Smart Investing & Trading Score: 60 | |
| Day Percent Change: -43.13% Day Change: -13.97 | |
| Week Change: -0.58% Year-to-date Change: -34.9% | |
| FORR Links: Profile News Message Board | |
| Charts:- Daily , Weekly | |
| Add FORR to Watchlist: View: Get Complete FORR Trend Analysis ➞ | |
 | TV Grupo Televisa, S.A.B. |
| Sector: Services & Goods | |
| SubSector: Broadcasting - TV | |
| MarketCap: 3740.43 Millions | |
| Recent Price: 2.38 Smart Investing & Trading Score: 60 | |
| Day Percent Change: -58.66% Day Change: -2.88 | |
| Week Change: -2.06% Year-to-date Change: 48.4% | |
| TV Links: Profile News Message Board | |
| Charts:- Daily , Weekly | |
| Add TV to Watchlist: View: Get Complete TV Trend Analysis ➞ | |
 | RRGB Red Robin Gourmet Burgers, Inc. |
| Sector: Services & Goods | |
| SubSector: Restaurants | |
| MarketCap: 121.57 Millions | |
| Recent Price: 6.00 Smart Investing & Trading Score: 60 | |
| Day Percent Change: -69.46% Day Change: -9.87 | |
| Week Change: 8.5% Year-to-date Change: 9.3% | |
| RRGB Links: Profile News Message Board | |
| Charts:- Daily , Weekly | |
| Add RRGB to Watchlist: View: Get Complete RRGB Trend Analysis ➞ | |
 | MYGN Myriad Genetics, Inc. |
| Sector: Services & Goods | |
| SubSector: Research Services | |
| MarketCap: 1051.94 Millions | |
| Recent Price: 5.87 Smart Investing & Trading Score: 50 | |
| Day Percent Change: 64.88% Day Change: 11.07 | |
| Week Change: 3.53% Year-to-date Change: -57.2% | |
| MYGN Links: Profile News Message Board | |
| Charts:- Daily , Weekly | |
| Add MYGN to Watchlist: View: Get Complete MYGN Trend Analysis ➞ | |
 | OLLI Ollie s Bargain Outlet Holdings, Inc. |
| Sector: Services & Goods | |
| SubSector: Discount, Variety Stores | |
| MarketCap: 2904.62 Millions | |
| Recent Price: 135.24 Smart Investing & Trading Score: 50 | |
| Day Percent Change: 37.73% Day Change: 27.09 | |
| Week Change: -3.95% Year-to-date Change: 23.3% | |
| OLLI Links: Profile News Message Board | |
| Charts:- Daily , Weekly | |
| Add OLLI to Watchlist: View: Get Complete OLLI Trend Analysis ➞ | |
 | GWW W.W. Grainger, Inc. |
| Sector: Services & Goods | |
| SubSector: Industrial Equipment Wholesale | |
| MarketCap: 12794.8 Millions | |
| Recent Price: 982.07 Smart Investing & Trading Score: 50 | |
| Day Percent Change: 37.67% Day Change: 268.75 | |
| Week Change: 2.51% Year-to-date Change: -6.2% | |
| GWW Links: Profile News Message Board | |
| Charts:- Daily , Weekly | |
| Add GWW to Watchlist: View: Get Complete GWW Trend Analysis ➞ | |
| For tabular summary view of above stock list: Summary View ➞ 0 - 25 , 25 - 50 , 50 - 75 , 75 - 100 , 100 - 125 , 125 - 150 , 150 - 175 , 175 - 200 , 200 - 225 , 225 - 250 , 250 - 275 , 275 - 300 | ||
| Click To Change The Sort Order: By Market Cap or Company Size Performance: Year-to-date, Week and Day | |
| Select Chart Type: | ||
|
Best Stocks Today 12Stocks.com |
© 2025 12Stocks.com Terms & Conditions Privacy Contact Us
All Information Provided Only For Education And Not To Be Used For Investing or Trading. See Terms & Conditions


One More Thing ... Get Best Stocks Delivered Daily!
Never Ever Miss A Move With Our Top Ten Stocks Lists
Find Best Stocks In Any Market - Bull or Bear Market
Take A Peek At Our Top Ten Stocks Lists: Daily, Weekly, Year-to-Date & Top Trends
Find Best Stocks In Any Market - Bull or Bear Market
Take A Peek At Our Top Ten Stocks Lists: Daily, Weekly, Year-to-Date & Top Trends
Consumer Services Stocks With Best Up Trends [0-bearish to 100-bullish]: Daily Journal[100], Napco Security[100], Louisiana-Pacific [100], Ritchie Bros.[100], eBay [100], Graham [100], Fastenal [100], AECOM [100], Kelly Services[100], Wayfair [100], Gray Television[100]
Best Consumer Services Stocks Year-to-Date:
Willdan [210.66%], Kratos Defense[160.61%], Altisource Portfolio[97.94%], Gray Television[94.26%], Wayfair [77.55%], Noodles & [76.23%], VSE [73.56%], Sears [67.56%], eBay [64.06%], WNS ()[58.64%], Dollar General[55.7%] Best Consumer Services Stocks This Week:
Willdan [34.44%], Gray Television[33.03%], Park-Ohio [27.27%], TEGNA [27.26%], Etsy [24.72%], AMC Networks[22.47%], Deluxe [21.77%], Kohl s[19.15%], Petco Health[19%], Kelly Services[18.78%], CompX [18.12%] Best Consumer Services Stocks Daily:
CareDx [185.69%], Wingstop [150.46%], National CineMedia[112.46%], VSE [69.41%], Burlington Stores[66.03%], Myriad Genetics[64.88%], Costco Wholesale[58.1%], Daily Journal[57.5%], Texas Roadhouse[55.27%], Royal Caribbean[53.63%], CRA [53.26%]