
 Login Sign Up


| |||||
 |  | ||||

| 12Stocks.com Market Intelligence |
Best Consumer Services Stocks
| In a hurry? Services & Goods Stocks: Performance Trends Table, Stock Charts
Sort Consumer Services: Daily, Weekly, Year-to-Date, Market Cap & Trends. Filter Services & Goods stocks list by size: All Large Mid-Range Small |
| 12Stocks.com Consumer Services Stocks Performances & Trends Daily | |||||||||
|
|  The overall Smart Investing & Trading Score is 100 (0-bearish to 100-bullish) which puts Consumer Services sector in short term bullish trend. The Smart Investing & Trading Score from previous trading session is 90 and an improvement of trend continues.
| ||||||||
Here are the Smart Investing & Trading Scores of the most requested Consumer Services stocks at 12Stocks.com (click stock name for detailed review):
|


| Consider signing up for our daily 12Stocks.com "Best Stocks Newsletter". You will never ever miss a big stock move again! |
| 12Stocks.com: Investing in Consumer Services sector with Stocks | |
|
The following table helps investors and traders sort through current performance and trends (as measured by Smart Investing & Trading Score) of various
stocks in the Consumer Services sector. Quick View: Move mouse or cursor over stock symbol (ticker) to view short-term Technical chart and over stock name to view long term chart. Click on  to add stock symbol to your watchlist and to add stock symbol to your watchlist and  to view watchlist. Click on any ticker or stock name for detailed market intelligence report for that stock. to view watchlist. Click on any ticker or stock name for detailed market intelligence report for that stock. |
12Stocks.com Performance of Stocks in Consumer Services Sector
| Ticker | Stock Name | Watchlist | Category | Recent Price | Smart Investing & Trading Score | Change % | YTD Change% |
| SHLD | Sears |   | Department | 62.56 | 80 | 0.00% | 67.56% |
| SCOR | comScore | | Services | 6.90 | 80 | -0.28% | 18.15% |
| LVS | Las Vegas | | Casinos | 54.33 | 80 | -1.29% | 7.61% |
| CCO | Clear Channel | | Marketing | 1.17 | 80 | -5.13% | -14.60% |
| HGV | Hilton Grand | | Casinos | 45.99 | 80 | -17.38% | 18.07% |
| EVC | Entravision | | Broadcasting | 2.64 | 80 | -45.36% | 18.10% |
| NWSA | News | | Broadcasting | 29.62 | 70 | 38.08% | 7.95% |
| H | Hyatt Hotels | | Lodging | 145.24 | 70 | 28.81% | -7.27% |
| LOCO | El Pollo | | Restaurants | 10.69 | 70 | 26.70% | -7.37% |
| TRU | TransUnion | | Services | 92.77 | 70 | 25.02% | 0.33% |
| GOLF | Acushnet | | Retail | 79.98 | 70 | 16.72% | 13.28% |
| CASS | Cass Information | | Services | 42.77 | 70 | 13.10% | 6.06% |
| GAIA | Gaia | | Retail | 4.97 | 70 | 9.09% | 10.69% |
| MCRI | Monarch Casino | | Casinos | 101.11 | 70 | 9.06% | 29.04% |
| HURN | Huron Consulting | | Services | 137.00 | 70 | 7.92% | 10.25% |
| NATH | Nathan s | | Restaurants | 103.10 | 70 | 4.71% | 32.43% |
| SCVL | Shoe Carnival | | Apparel | 21.45 | 70 | 3.54% | -33.91% |
| CHGG | Chegg | | Education | 1.28 | 70 | 3.50% | -20.50% |
| EXPO | Exponent | | Services | 72.65 | 70 | 2.62% | -17.85% |
| VAC | Marriott Vacations | | Casinos | 76.83 | 70 | 2.56% | -12.46% |
| MAN | Manpower | | Staffing | 41.77 | 70 | 2.50% | -26.37% |
| ABM | ABM Industries | | Services | 49.53 | 70 | 1.75% | -1.65% |
| IHG | InterContinental Hotels | | Lodging | 121.61 | 70 | 1.61% | -1.58% |
| MTN | Vail Resorts | | Casinos | 154.84 | 70 | 1.45% | -15.07% |
| OMC | Omnicom | | Advertising | 76.47 | 70 | 1.33% | -9.50% |
| For chart view version of above stock list: Chart View ➞ 0 - 25 , 25 - 50 , 50 - 75 , 75 - 100 , 100 - 125 , 125 - 150 , 150 - 175 , 175 - 200 , 200 - 225 , 225 - 250 , 250 - 275 , 275 - 300 | ||
 | Click To Change The Sort Order: By Market Cap or Company Size Performance: Year-to-date, Week and Day |  |
|
Get the most comprehensive stock market coverage daily at 12Stocks.com ➞ Best Stocks Today ➞ Best Stocks Weekly ➞ Best Stocks Year-to-Date ➞ Best Stocks Trends ➞  Best Stocks Today 12Stocks.com Best Nasdaq Stocks ➞ Best S&P 500 Stocks ➞ Best Tech Stocks ➞ Best Biotech Stocks ➞ |
| Detailed Overview of Consumer Services Stocks |
| Consumer Services Technical Overview, Leaders & Laggards, Top Consumer Services ETF Funds & Detailed Consumer Services Stocks List, Charts, Trends & More |
| Consumer Services Sector: Technical Analysis, Trends & YTD Performance | |
| Consumer Services sector is composed of stocks
from retail, entertainment, media/publishing, consumer goods
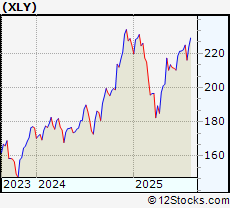
and services subsectors. Consumer Services sector, as represented by XLY, an exchange-traded fund [ETF] that holds basket of Consumer Services stocks (e.g, Walmart, Alibaba) is up by 2.95% and is currently underperforming the overall market by -7.38% year-to-date. Below is a quick view of Technical charts and trends: |
|
 XLY Weekly Chart |
|
| Long Term Trend: Very Good | |
| Medium Term Trend: Very Good | |
 XLY Daily Chart |
|
| Short Term Trend: Very Good | |
| Overall Trend Score: 100 | |
| YTD Performance: 2.95% | |
| **Trend Scores & Views Are Only For Educational Purposes And Not For Investing | |
| 12Stocks.com: Top Performing Consumer Services Sector Stocks | ||||||||||||||||||||||||||||||||||||||||||||||||
 The top performing Consumer Services sector stocks year to date are
Now, more recently, over last week, the top performing Consumer Services sector stocks on the move are


|
||||||||||||||||||||||||||||||||||||||||||||||||
| 12Stocks.com: Investing in Consumer Services Sector using Exchange Traded Funds | |
|
The following table shows list of key exchange traded funds (ETF) that
help investors track Consumer Services Index. For detailed view, check out our ETF Funds section of our website. Quick View: Move mouse or cursor over ETF symbol (ticker) to view short-term Technical chart and over ETF name to view long term chart. Click on ticker or stock name for detailed view. Click on to add stock symbol to your watchlist and to view watchlist. |
12Stocks.com List of ETFs that track Consumer Services Index
| Ticker | ETF Name | Watchlist | Recent Price | Smart Investing & Trading Score | Change % | Week % | Year-to-date % |
| XLY | Consumer Discret Sel | | 229.85 | 100 | 2.01 | 2.86 | 2.95% |
| RTH | Retail | | 247.67 | 100 | 0.63 | 0.8 | 10.46% |
| XRT | Retail | | 85.03 | 100 | 2.54 | 4.47 | 7.4% |
| IYK | Consumer Goods | | 70.39 | 70 | 0.37 | 1.49 | 8.38% |
| UCC | Consumer Services | | 49.99 | 100 | 2.96 | 5.78 | -2.73% |
| SCC | Short Consumer Services | | 15.90 | 0 | -19.86 | -5.49 | -12.44% |
| UGE | Consumer Goods | | 19.18 | 70 | 1.05 | 2.4 | 7.27% |
| 12Stocks.com: Charts, Trends, Fundamental Data and Performances of Consumer Services Stocks | |
|
We now take in-depth look at all Consumer Services stocks including charts, multi-period performances and overall trends (as measured by Smart Investing & Trading Score). One can sort Consumer Services stocks (click link to choose) by Daily, Weekly and by Year-to-Date performances. Also, one can sort by size of the company or by market capitalization. |
| Select Your Default Chart Type: | |||||
| |||||
| Click on stock symbol or name for detailed view. Click on to add stock symbol to your watchlist and to view watchlist. Quick View: Move mouse or cursor over "Daily" to quickly view daily Technical stock chart and over "Weekly" to view weekly Technical stock chart. | |||||

 | SHLD Sears Holdings Corporation |
| Sector: Services & Goods | |
| SubSector: Department Stores | |
| MarketCap: 813.63 Millions | |
| Recent Price: 62.56 Smart Investing & Trading Score: 80 | |
| Day Percent Change: 0% Day Change: 0 | |
| Week Change: -1.68% Year-to-date Change: 67.6% | |
| SHLD Links: Profile News Message Board | |
| Charts:- Daily , Weekly | |
| Add SHLD to Watchlist: View: Get Complete SHLD Trend Analysis ➞ | |
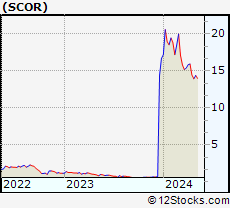 | SCOR comScore, Inc. |
| Sector: Services & Goods | |
| SubSector: Business Services | |
| MarketCap: 166.082 Millions | |
| Recent Price: 6.90 Smart Investing & Trading Score: 80 | |
| Day Percent Change: -0.28% Day Change: -0.02 | |
| Week Change: 15.58% Year-to-date Change: 18.2% | |
| SCOR Links: Profile News Message Board | |
| Charts:- Daily , Weekly | |
| Add SCOR to Watchlist: View: Get Complete SCOR Trend Analysis ➞ | |
 | LVS Las Vegas Sands Corp. |
| Sector: Services & Goods | |
| SubSector: Resorts & Casinos | |
| MarketCap: 36431.6 Millions | |
| Recent Price: 54.33 Smart Investing & Trading Score: 80 | |
| Day Percent Change: -1.29% Day Change: -0.53 | |
| Week Change: 3.05% Year-to-date Change: 7.6% | |
| LVS Links: Profile News Message Board | |
| Charts:- Daily , Weekly | |
| Add LVS to Watchlist: View: Get Complete LVS Trend Analysis ➞ | |
 | CCO Clear Channel Outdoor Holdings, Inc. |
| Sector: Services & Goods | |
| SubSector: Marketing Services | |
| MarketCap: 312.715 Millions | |
| Recent Price: 1.17 Smart Investing & Trading Score: 80 | |
| Day Percent Change: -5.13% Day Change: -0.08 | |
| Week Change: 6.36% Year-to-date Change: -14.6% | |
| CCO Links: Profile News Message Board | |
| Charts:- Daily , Weekly | |
| Add CCO to Watchlist: View: Get Complete CCO Trend Analysis ➞ | |
 | HGV Hilton Grand Vacations Inc. |
| Sector: Services & Goods | |
| SubSector: Resorts & Casinos | |
| MarketCap: 1333.04 Millions | |
| Recent Price: 45.99 Smart Investing & Trading Score: 80 | |
| Day Percent Change: -17.38% Day Change: -8.06 | |
| Week Change: 3.65% Year-to-date Change: 18.1% | |
| HGV Links: Profile News Message Board | |
| Charts:- Daily , Weekly | |
| Add HGV to Watchlist: View: Get Complete HGV Trend Analysis ➞ | |
 | EVC Entravision Communications Corporation |
| Sector: Services & Goods | |
| SubSector: Broadcasting - TV | |
| MarketCap: 171.763 Millions | |
| Recent Price: 2.64 Smart Investing & Trading Score: 80 | |
| Day Percent Change: -45.36% Day Change: -1.71 | |
| Week Change: 10.92% Year-to-date Change: 18.1% | |
| EVC Links: Profile News Message Board | |
| Charts:- Daily , Weekly | |
| Add EVC to Watchlist: View: Get Complete EVC Trend Analysis ➞ | |
 | NWSA News Corporation |
| Sector: Services & Goods | |
| SubSector: Broadcasting - TV | |
| MarketCap: 5857.53 Millions | |
| Recent Price: 29.62 Smart Investing & Trading Score: 70 | |
| Day Percent Change: 38.08% Day Change: 7.76 | |
| Week Change: 0.65% Year-to-date Change: 8.0% | |
| NWSA Links: Profile News Message Board | |
| Charts:- Daily , Weekly | |
| Add NWSA to Watchlist: View: Get Complete NWSA Trend Analysis ➞ | |
 | H Hyatt Hotels Corporation |
| Sector: Services & Goods | |
| SubSector: Lodging | |
| MarketCap: 5525.56 Millions | |
| Recent Price: 145.24 Smart Investing & Trading Score: 70 | |
| Day Percent Change: 28.81% Day Change: 33.27 | |
| Week Change: 6.75% Year-to-date Change: -7.3% | |
| H Links: Profile News Message Board | |
| Charts:- Daily , Weekly | |
| Add H to Watchlist: View: Get Complete H Trend Analysis ➞ | |
 | LOCO El Pollo Loco Holdings, Inc. |
| Sector: Services & Goods | |
| SubSector: Restaurants | |
| MarketCap: 296.97 Millions | |
| Recent Price: 10.69 Smart Investing & Trading Score: 70 | |
| Day Percent Change: 26.7% Day Change: 2.87 | |
| Week Change: 4.39% Year-to-date Change: -7.4% | |
| LOCO Links: Profile News Message Board | |
| Charts:- Daily , Weekly | |
| Add LOCO to Watchlist: View: Get Complete LOCO Trend Analysis ➞ | |
 | TRU TransUnion |
| Sector: Services & Goods | |
| SubSector: Business Services | |
| MarketCap: 11457.2 Millions | |
| Recent Price: 92.77 Smart Investing & Trading Score: 70 | |
| Day Percent Change: 25.02% Day Change: 19.47 | |
| Week Change: 2.06% Year-to-date Change: 0.3% | |
| TRU Links: Profile News Message Board | |
| Charts:- Daily , Weekly | |
| Add TRU to Watchlist: View: Get Complete TRU Trend Analysis ➞ | |
 | GOLF Acushnet Holdings Corp. |
| Sector: Services & Goods | |
| SubSector: Sporting Goods Stores | |
| MarketCap: 1717.74 Millions | |
| Recent Price: 79.98 Smart Investing & Trading Score: 70 | |
| Day Percent Change: 16.72% Day Change: 9.6 | |
| Week Change: 0.35% Year-to-date Change: 13.3% | |
| GOLF Links: Profile News Message Board | |
| Charts:- Daily , Weekly | |
| Add GOLF to Watchlist: View: Get Complete GOLF Trend Analysis ➞ | |
 | CASS Cass Information Systems, Inc. |
| Sector: Services & Goods | |
| SubSector: Business Services | |
| MarketCap: 477.382 Millions | |
| Recent Price: 42.77 Smart Investing & Trading Score: 70 | |
| Day Percent Change: 13.1% Day Change: 5.01 | |
| Week Change: 2.25% Year-to-date Change: 6.1% | |
| CASS Links: Profile News Message Board | |
| Charts:- Daily , Weekly | |
| Add CASS to Watchlist: View: Get Complete CASS Trend Analysis ➞ | |
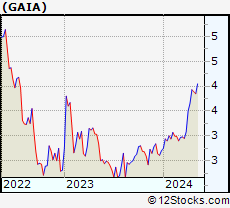 | GAIA Gaia, Inc. |
| Sector: Services & Goods | |
| SubSector: Catalog & Mail Order Houses | |
| MarketCap: 130.592 Millions | |
| Recent Price: 4.97 Smart Investing & Trading Score: 70 | |
| Day Percent Change: 9.09% Day Change: 0.35 | |
| Week Change: 12.7% Year-to-date Change: 10.7% | |
| GAIA Links: Profile News Message Board | |
| Charts:- Daily , Weekly | |
| Add GAIA to Watchlist: View: Get Complete GAIA Trend Analysis ➞ | |
 | MCRI Monarch Casino & Resort, Inc. |
| Sector: Services & Goods | |
| SubSector: Resorts & Casinos | |
| MarketCap: 352.894 Millions | |
| Recent Price: 101.11 Smart Investing & Trading Score: 70 | |
| Day Percent Change: 9.06% Day Change: 6.17 | |
| Week Change: 1.52% Year-to-date Change: 29.0% | |
| MCRI Links: Profile News Message Board | |
| Charts:- Daily , Weekly | |
| Add MCRI to Watchlist: View: Get Complete MCRI Trend Analysis ➞ | |
 | HURN Huron Consulting Group Inc. |
| Sector: Services & Goods | |
| SubSector: Management Services | |
| MarketCap: 968.645 Millions | |
| Recent Price: 137.00 Smart Investing & Trading Score: 70 | |
| Day Percent Change: 7.92% Day Change: 7.9 | |
| Week Change: 6.28% Year-to-date Change: 10.3% | |
| HURN Links: Profile News Message Board | |
| Charts:- Daily , Weekly | |
| Add HURN to Watchlist: View: Get Complete HURN Trend Analysis ➞ | |
 | NATH Nathan s Famous, Inc. |
| Sector: Services & Goods | |
| SubSector: Restaurants | |
| MarketCap: 211.77 Millions | |
| Recent Price: 103.10 Smart Investing & Trading Score: 70 | |
| Day Percent Change: 4.71% Day Change: 3.53 | |
| Week Change: 2.23% Year-to-date Change: 32.4% | |
| NATH Links: Profile News Message Board | |
| Charts:- Daily , Weekly | |
| Add NATH to Watchlist: View: Get Complete NATH Trend Analysis ➞ | |
 | SCVL Shoe Carnival, Inc. |
| Sector: Services & Goods | |
| SubSector: Apparel Stores | |
| MarketCap: 252.508 Millions | |
| Recent Price: 21.45 Smart Investing & Trading Score: 70 | |
| Day Percent Change: 3.54% Day Change: 1.5 | |
| Week Change: 2.05% Year-to-date Change: -33.9% | |
| SCVL Links: Profile News Message Board | |
| Charts:- Daily , Weekly | |
| Add SCVL to Watchlist: View: Get Complete SCVL Trend Analysis ➞ | |
 | CHGG Chegg, Inc. |
| Sector: Services & Goods | |
| SubSector: Education & Training Services | |
| MarketCap: 3606.86 Millions | |
| Recent Price: 1.28 Smart Investing & Trading Score: 70 | |
| Day Percent Change: 3.5% Day Change: 0.08 | |
| Week Change: 15.32% Year-to-date Change: -20.5% | |
| CHGG Links: Profile News Message Board | |
| Charts:- Daily , Weekly | |
| Add CHGG to Watchlist: View: Get Complete CHGG Trend Analysis ➞ | |
 | EXPO Exponent, Inc. |
| Sector: Services & Goods | |
| SubSector: Management Services | |
| MarketCap: 3605.95 Millions | |
| Recent Price: 72.65 Smart Investing & Trading Score: 70 | |
| Day Percent Change: 2.62% Day Change: 2.71 | |
| Week Change: 1.62% Year-to-date Change: -17.9% | |
| EXPO Links: Profile News Message Board | |
| Charts:- Daily , Weekly | |
| Add EXPO to Watchlist: View: Get Complete EXPO Trend Analysis ➞ | |
 | VAC Marriott Vacations Worldwide Corporation |
| Sector: Services & Goods | |
| SubSector: Resorts & Casinos | |
| MarketCap: 2173.54 Millions | |
| Recent Price: 76.83 Smart Investing & Trading Score: 70 | |
| Day Percent Change: 2.56% Day Change: 1.85 | |
| Week Change: 6.44% Year-to-date Change: -12.5% | |
| VAC Links: Profile News Message Board | |
| Charts:- Daily , Weekly | |
| Add VAC to Watchlist: View: Get Complete VAC Trend Analysis ➞ | |
 | MAN ManpowerGroup Inc. |
| Sector: Services & Goods | |
| SubSector: Staffing & Outsourcing Services | |
| MarketCap: 3436.28 Millions | |
| Recent Price: 41.77 Smart Investing & Trading Score: 70 | |
| Day Percent Change: 2.5% Day Change: 1.78 | |
| Week Change: 8.78% Year-to-date Change: -26.4% | |
| MAN Links: Profile News Message Board | |
| Charts:- Daily , Weekly | |
| Add MAN to Watchlist: View: Get Complete MAN Trend Analysis ➞ | |
 | ABM ABM Industries Incorporated |
| Sector: Services & Goods | |
| SubSector: Business Services | |
| MarketCap: 1706.72 Millions | |
| Recent Price: 49.53 Smart Investing & Trading Score: 70 | |
| Day Percent Change: 1.75% Day Change: 0.95 | |
| Week Change: 4.52% Year-to-date Change: -1.7% | |
| ABM Links: Profile News Message Board | |
| Charts:- Daily , Weekly | |
| Add ABM to Watchlist: View: Get Complete ABM Trend Analysis ➞ | |
 | IHG InterContinental Hotels Group PLC |
| Sector: Services & Goods | |
| SubSector: Lodging | |
| MarketCap: 6387.46 Millions | |
| Recent Price: 121.61 Smart Investing & Trading Score: 70 | |
| Day Percent Change: 1.61% Day Change: 1.58 | |
| Week Change: 4.41% Year-to-date Change: -1.6% | |
| IHG Links: Profile News Message Board | |
| Charts:- Daily , Weekly | |
| Add IHG to Watchlist: View: Get Complete IHG Trend Analysis ➞ | |
 | MTN Vail Resorts, Inc. |
| Sector: Services & Goods | |
| SubSector: Resorts & Casinos | |
| MarketCap: 6259.64 Millions | |
| Recent Price: 154.84 Smart Investing & Trading Score: 70 | |
| Day Percent Change: 1.45% Day Change: 2.54 | |
| Week Change: 3.89% Year-to-date Change: -15.1% | |
| MTN Links: Profile News Message Board | |
| Charts:- Daily , Weekly | |
| Add MTN to Watchlist: View: Get Complete MTN Trend Analysis ➞ | |
 | OMC Omnicom Group Inc. |
| Sector: Services & Goods | |
| SubSector: Advertising Agencies | |
| MarketCap: 11813.5 Millions | |
| Recent Price: 76.47 Smart Investing & Trading Score: 70 | |
| Day Percent Change: 1.33% Day Change: 1.29 | |
| Week Change: 4.83% Year-to-date Change: -9.5% | |
| OMC Links: Profile News Message Board | |
| Charts:- Daily , Weekly | |
| Add OMC to Watchlist: View: Get Complete OMC Trend Analysis ➞ | |
| For tabular summary view of above stock list: Summary View ➞ 0 - 25 , 25 - 50 , 50 - 75 , 75 - 100 , 100 - 125 , 125 - 150 , 150 - 175 , 175 - 200 , 200 - 225 , 225 - 250 , 250 - 275 , 275 - 300 | ||
| Click To Change The Sort Order: By Market Cap or Company Size Performance: Year-to-date, Week and Day | |
| Select Chart Type: | ||
|
Best Stocks Today 12Stocks.com |
© 2025 12Stocks.com Terms & Conditions Privacy Contact Us
All Information Provided Only For Education And Not To Be Used For Investing or Trading. See Terms & Conditions


One More Thing ... Get Best Stocks Delivered Daily!
Never Ever Miss A Move With Our Top Ten Stocks Lists
Find Best Stocks In Any Market - Bull or Bear Market
Take A Peek At Our Top Ten Stocks Lists: Daily, Weekly, Year-to-Date & Top Trends
Find Best Stocks In Any Market - Bull or Bear Market
Take A Peek At Our Top Ten Stocks Lists: Daily, Weekly, Year-to-Date & Top Trends
Consumer Services Stocks With Best Up Trends [0-bearish to 100-bullish]: Daily Journal[100], Napco Security[100], Louisiana-Pacific [100], Ritchie Bros.[100], eBay [100], Graham [100], Fastenal [100], AECOM [100], Kelly Services[100], Wayfair [100], Gray Television[100]
Best Consumer Services Stocks Year-to-Date:
Willdan [210.66%], Kratos Defense[160.61%], Altisource Portfolio[97.94%], Gray Television[94.26%], Wayfair [77.55%], Noodles & [76.23%], VSE [73.56%], Sears [67.56%], eBay [64.06%], WNS ()[58.64%], Dollar General[55.7%] Best Consumer Services Stocks This Week:
Willdan [34.44%], Gray Television[33.03%], Park-Ohio [27.27%], TEGNA [27.26%], Etsy [24.72%], AMC Networks[22.47%], Deluxe [21.77%], Kohl s[19.15%], Petco Health[19%], Kelly Services[18.78%], CompX [18.12%] Best Consumer Services Stocks Daily:
CareDx [185.69%], Wingstop [150.46%], National CineMedia[112.46%], VSE [69.41%], Burlington Stores[66.03%], Myriad Genetics[64.88%], Costco Wholesale[58.1%], Daily Journal[57.5%], Texas Roadhouse[55.27%], Royal Caribbean[53.63%], CRA [53.26%]