
 Login Sign Up


| |||||
 |  | ||||

| 12Stocks.com Market Intelligence |
Best Consumer Services Stocks
| In a hurry? Services & Goods Stocks: Performance Trends Table, Stock Charts
Sort Consumer Services: Daily, Weekly, Year-to-Date, Market Cap & Trends. Filter Services & Goods stocks list by size: All Large Mid-Range Small |
| 12Stocks.com Consumer Services Stocks Performances & Trends Daily | |||||||||
|
|  The overall Smart Investing & Trading Score is 100 (0-bearish to 100-bullish) which puts Consumer Services sector in short term bullish trend. The Smart Investing & Trading Score from previous trading session is 90 and an improvement of trend continues.
| ||||||||
Here are the Smart Investing & Trading Scores of the most requested Consumer Services stocks at 12Stocks.com (click stock name for detailed review):
|


| Consider signing up for our daily 12Stocks.com "Best Stocks Newsletter". You will never ever miss a big stock move again! |
| 12Stocks.com: Investing in Consumer Services sector with Stocks | |
|
The following table helps investors and traders sort through current performance and trends (as measured by Smart Investing & Trading Score) of various
stocks in the Consumer Services sector. Quick View: Move mouse or cursor over stock symbol (ticker) to view short-term Technical chart and over stock name to view long term chart. Click on  to add stock symbol to your watchlist and to add stock symbol to your watchlist and  to view watchlist. Click on any ticker or stock name for detailed market intelligence report for that stock. to view watchlist. Click on any ticker or stock name for detailed market intelligence report for that stock. |
12Stocks.com Performance of Stocks in Consumer Services Sector
| Ticker | Stock Name | Watchlist | Category | Recent Price | Smart Investing & Trading Score | Change % | YTD Change% |
| CRAI | CRA |   | Services | 193.14 | 80 | 53.26% | 3.98% |
| KTOS | Kratos Defense | | Security | 68.75 | 80 | 32.54% | 160.61% |
| CIX | CompX | | Security | 31.49 | 80 | 24.36% | 23.60% |
| LQDT | Liquidity Services | | Retail | 26.15 | 80 | 22.37% | -19.02% |
| WOOF | Petco Health | | Specialty Retail | 3.57 | 80 | 9.12% | -6.30% |
| WLDN | Willdan | | Services | 118.33 | 80 | 7.92% | 210.66% |
| DDS | Dillard s | | Department | 497.93 | 80 | 6.43% | 15.48% |
| CAKE | Cheesecake Factory | | Restaurants | 64.78 | 80 | 5.78% | 38.59% |
| ABG | Asbury Automotive | | Automobile | 243.18 | 80 | 4.90% | 0.06% |
| ARW | Arrow Electronics | | Retail | 127.40 | 80 | 4.45% | 12.62% |
| DXPE | DXP Enterprises | | Equipment | 119.78 | 80 | 3.67% | 44.98% |
| INCR | Research | | Research | 1.64 | 80 | 3.43% | 3.14% |
| SIG | Signet Jewelers | | Retail | 83.28 | 80 | 3.32% | 4.64% |
| DFIN | Donnelley Financial | | Services | 57.90 | 80 | 2.51% | -7.70% |
| DENN | Denny s | | Restaurants | 4.10 | 80 | 2.46% | -32.23% |
| BYD | Boyd Gaming | | Casinos | 84.33 | 80 | 2.30% | 16.85% |
| SCHL | Scholastic | | Publishing | 26.35 | 80 | 2.00% | 26.16% |
| MATW | Matthews | | Services | 25.37 | 80 | 1.98% | -5.32% |
| IMKTA | Ingles Markets | | Grocery | 64.79 | 80 | 1.98% | 1.32% |
| SIRI | Sirius XM | | Broadcasting | 22.41 | 80 | 1.75% | 1.87% |
| PFGC | Performance Food | | Restaurants | 101.27 | 80 | 1.44% | 19.78% |
| MG | Mistras | | Security | 9.16 | 80 | 1.20% | 1.10% |
| LYV | Live Nation | | Entertainment | 158.87 | 80 | 0.88% | 22.68% |
| HLT | Hilton Worldwide | | Lodging | 272.85 | 80 | 0.71% | 10.52% |
| MGM | MGM Resorts | | Casinos | 36.45 | 80 | 0.44% | 5.19% |
| For chart view version of above stock list: Chart View ➞ 0 - 25 , 25 - 50 , 50 - 75 , 75 - 100 , 100 - 125 , 125 - 150 , 150 - 175 , 175 - 200 , 200 - 225 , 225 - 250 , 250 - 275 , 275 - 300 | ||
 | Click To Change The Sort Order: By Market Cap or Company Size Performance: Year-to-date, Week and Day |  |
|
Get the most comprehensive stock market coverage daily at 12Stocks.com ➞ Best Stocks Today ➞ Best Stocks Weekly ➞ Best Stocks Year-to-Date ➞ Best Stocks Trends ➞  Best Stocks Today 12Stocks.com Best Nasdaq Stocks ➞ Best S&P 500 Stocks ➞ Best Tech Stocks ➞ Best Biotech Stocks ➞ |
| Detailed Overview of Consumer Services Stocks |
| Consumer Services Technical Overview, Leaders & Laggards, Top Consumer Services ETF Funds & Detailed Consumer Services Stocks List, Charts, Trends & More |
| Consumer Services Sector: Technical Analysis, Trends & YTD Performance | |
| Consumer Services sector is composed of stocks
from retail, entertainment, media/publishing, consumer goods
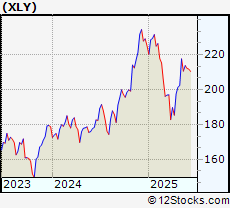
and services subsectors. Consumer Services sector, as represented by XLY, an exchange-traded fund [ETF] that holds basket of Consumer Services stocks (e.g, Walmart, Alibaba) is up by 2.95% and is currently underperforming the overall market by -7.38% year-to-date. Below is a quick view of Technical charts and trends: |
|
 XLY Weekly Chart |
|
| Long Term Trend: Very Good | |
| Medium Term Trend: Very Good | |
 XLY Daily Chart |
|
| Short Term Trend: Very Good | |
| Overall Trend Score: 100 | |
| YTD Performance: 2.95% | |
| **Trend Scores & Views Are Only For Educational Purposes And Not For Investing | |
| 12Stocks.com: Top Performing Consumer Services Sector Stocks | ||||||||||||||||||||||||||||||||||||||||||||||||
 The top performing Consumer Services sector stocks year to date are
Now, more recently, over last week, the top performing Consumer Services sector stocks on the move are


|
||||||||||||||||||||||||||||||||||||||||||||||||
| 12Stocks.com: Investing in Consumer Services Sector using Exchange Traded Funds | |
|
The following table shows list of key exchange traded funds (ETF) that
help investors track Consumer Services Index. For detailed view, check out our ETF Funds section of our website. Quick View: Move mouse or cursor over ETF symbol (ticker) to view short-term Technical chart and over ETF name to view long term chart. Click on ticker or stock name for detailed view. Click on to add stock symbol to your watchlist and to view watchlist. |
12Stocks.com List of ETFs that track Consumer Services Index
| Ticker | ETF Name | Watchlist | Recent Price | Smart Investing & Trading Score | Change % | Week % | Year-to-date % |
| XLY | Consumer Discret Sel | | 229.85 | 100 | 2.01 | 2.86 | 2.95% |
| RTH | Retail | | 247.67 | 100 | 0.63 | 0.8 | 10.46% |
| XRT | Retail | | 85.03 | 100 | 2.54 | 4.47 | 7.4% |
| IYK | Consumer Goods | | 70.39 | 70 | 0.37 | 1.49 | 8.38% |
| UCC | Consumer Services | | 49.99 | 100 | 2.96 | 5.78 | -2.73% |
| SCC | Short Consumer Services | | 15.90 | 0 | -19.86 | -5.49 | -12.44% |
| UGE | Consumer Goods | | 19.18 | 70 | 1.05 | 2.4 | 7.27% |
| 12Stocks.com: Charts, Trends, Fundamental Data and Performances of Consumer Services Stocks | |
|
We now take in-depth look at all Consumer Services stocks including charts, multi-period performances and overall trends (as measured by Smart Investing & Trading Score). One can sort Consumer Services stocks (click link to choose) by Daily, Weekly and by Year-to-Date performances. Also, one can sort by size of the company or by market capitalization. |
| Select Your Default Chart Type: | |||||
| |||||
| Click on stock symbol or name for detailed view. Click on to add stock symbol to your watchlist and to view watchlist. Quick View: Move mouse or cursor over "Daily" to quickly view daily Technical stock chart and over "Weekly" to view weekly Technical stock chart. | |||||

 | CRAI CRA International, Inc. |
| Sector: Services & Goods | |
| SubSector: Management Services | |
| MarketCap: 209.645 Millions | |
| Recent Price: 193.14 Smart Investing & Trading Score: 80 | |
| Day Percent Change: 53.26% Day Change: 56.81 | |
| Week Change: 2.26% Year-to-date Change: 4.0% | |
| CRAI Links: Profile News Message Board | |
| Charts:- Daily , Weekly | |
| Add CRAI to Watchlist: View: Get Complete CRAI Trend Analysis ➞ | |
 | KTOS Kratos Defense & Security Solutions, Inc. |
| Sector: Services & Goods | |
| SubSector: Security & Protection Services | |
| MarketCap: 1369.63 Millions | |
| Recent Price: 68.75 Smart Investing & Trading Score: 80 | |
| Day Percent Change: 32.54% Day Change: 5.59 | |
| Week Change: 16.66% Year-to-date Change: 160.6% | |
| KTOS Links: Profile News Message Board | |
| Charts:- Daily , Weekly | |
| Add KTOS to Watchlist: View: Get Complete KTOS Trend Analysis ➞ | |
 | CIX CompX International Inc. |
| Sector: Services & Goods | |
| SubSector: Security & Protection Services | |
| MarketCap: 189.603 Millions | |
| Recent Price: 31.49 Smart Investing & Trading Score: 80 | |
| Day Percent Change: 24.36% Day Change: 5.37 | |
| Week Change: 18.12% Year-to-date Change: 23.6% | |
| CIX Links: Profile News Message Board | |
| Charts:- Daily , Weekly | |
| Add CIX to Watchlist: View: Get Complete CIX Trend Analysis ➞ | |
 | LQDT Liquidity Services, Inc. |
| Sector: Services & Goods | |
| SubSector: Catalog & Mail Order Houses | |
| MarketCap: 144.492 Millions | |
| Recent Price: 26.15 Smart Investing & Trading Score: 80 | |
| Day Percent Change: 22.37% Day Change: 4.1 | |
| Week Change: 5.23% Year-to-date Change: -19.0% | |
| LQDT Links: Profile News Message Board | |
| Charts:- Daily , Weekly | |
| Add LQDT to Watchlist: View: Get Complete LQDT Trend Analysis ➞ | |
 | WOOF Petco Health and Wellness Company, Inc. |
| Sector: Services & Goods | |
| SubSector: Specialty Retail | |
| MarketCap: 2030 Millions | |
| Recent Price: 3.57 Smart Investing & Trading Score: 80 | |
| Day Percent Change: 9.12% Day Change: 0.25 | |
| Week Change: 19% Year-to-date Change: -6.3% | |
| WOOF Links: Profile News Message Board | |
| Charts:- Daily , Weekly | |
| Add WOOF to Watchlist: View: Get Complete WOOF Trend Analysis ➞ | |
 | WLDN Willdan Group, Inc. |
| Sector: Services & Goods | |
| SubSector: Technical Services | |
| MarketCap: 235.61 Millions | |
| Recent Price: 118.33 Smart Investing & Trading Score: 80 | |
| Day Percent Change: 7.92% Day Change: 2.88 | |
| Week Change: 34.44% Year-to-date Change: 210.7% | |
| WLDN Links: Profile News Message Board | |
| Charts:- Daily , Weekly | |
| Add WLDN to Watchlist: View: Get Complete WLDN Trend Analysis ➞ | |
 | DDS Dillard s, Inc. |
| Sector: Services & Goods | |
| SubSector: Department Stores | |
| MarketCap: 1170.82 Millions | |
| Recent Price: 497.93 Smart Investing & Trading Score: 80 | |
| Day Percent Change: 6.43% Day Change: 21.65 | |
| Week Change: 6.06% Year-to-date Change: 15.5% | |
| DDS Links: Profile News Message Board | |
| Charts:- Daily , Weekly | |
| Add DDS to Watchlist: View: Get Complete DDS Trend Analysis ➞ | |
 | CAKE The Cheesecake Factory Incorporated |
| Sector: Services & Goods | |
| SubSector: Restaurants | |
| MarketCap: 829 Millions | |
| Recent Price: 64.78 Smart Investing & Trading Score: 80 | |
| Day Percent Change: 5.78% Day Change: 2.22 | |
| Week Change: 5.37% Year-to-date Change: 38.6% | |
| CAKE Links: Profile News Message Board | |
| Charts:- Daily , Weekly | |
| Add CAKE to Watchlist: View: Get Complete CAKE Trend Analysis ➞ | |
 | ABG Asbury Automotive Group, Inc. |
| Sector: Services & Goods | |
| SubSector: Auto Dealerships | |
| MarketCap: 1203.21 Millions | |
| Recent Price: 243.18 Smart Investing & Trading Score: 80 | |
| Day Percent Change: 4.9% Day Change: 11.28 | |
| Week Change: 6.02% Year-to-date Change: 0.1% | |
| ABG Links: Profile News Message Board | |
| Charts:- Daily , Weekly | |
| Add ABG to Watchlist: View: Get Complete ABG Trend Analysis ➞ | |
 | ARW Arrow Electronics, Inc. |
| Sector: Services & Goods | |
| SubSector: Electronics Wholesale | |
| MarketCap: 4155.03 Millions | |
| Recent Price: 127.40 Smart Investing & Trading Score: 80 | |
| Day Percent Change: 4.45% Day Change: 5.67 | |
| Week Change: 9.63% Year-to-date Change: 12.6% | |
| ARW Links: Profile News Message Board | |
| Charts:- Daily , Weekly | |
| Add ARW to Watchlist: View: Get Complete ARW Trend Analysis ➞ | |
 | DXPE DXP Enterprises, Inc. |
| Sector: Services & Goods | |
| SubSector: Industrial Equipment Wholesale | |
| MarketCap: 243.758 Millions | |
| Recent Price: 119.78 Smart Investing & Trading Score: 80 | |
| Day Percent Change: 3.67% Day Change: 1.84 | |
| Week Change: 6.58% Year-to-date Change: 45.0% | |
| DXPE Links: Profile News Message Board | |
| Charts:- Daily , Weekly | |
| Add DXPE to Watchlist: View: Get Complete DXPE Trend Analysis ➞ | |
 | INCR INC Research Holdings, Inc. |
| Sector: Services & Goods | |
| SubSector: Research Services | |
| MarketCap: 2486.94 Millions | |
| Recent Price: 1.64 Smart Investing & Trading Score: 80 | |
| Day Percent Change: 3.43% Day Change: 0.07 | |
| Week Change: 12.71% Year-to-date Change: 3.1% | |
| INCR Links: Profile News Message Board | |
| Charts:- Daily , Weekly | |
| Add INCR to Watchlist: View: Get Complete INCR Trend Analysis ➞ | |
 | SIG Signet Jewelers Limited |
| Sector: Services & Goods | |
| SubSector: Jewelry Stores | |
| MarketCap: 518.1 Millions | |
| Recent Price: 83.28 Smart Investing & Trading Score: 80 | |
| Day Percent Change: 3.32% Day Change: 2.58 | |
| Week Change: 10.85% Year-to-date Change: 4.6% | |
| SIG Links: Profile News Message Board | |
| Charts:- Daily , Weekly | |
| Add SIG to Watchlist: View: Get Complete SIG Trend Analysis ➞ | |
 | DFIN Donnelley Financial Solutions, Inc. |
| Sector: Services & Goods | |
| SubSector: Business Services | |
| MarketCap: 229.882 Millions | |
| Recent Price: 57.90 Smart Investing & Trading Score: 80 | |
| Day Percent Change: 2.51% Day Change: 1.63 | |
| Week Change: 11.35% Year-to-date Change: -7.7% | |
| DFIN Links: Profile News Message Board | |
| Charts:- Daily , Weekly | |
| Add DFIN to Watchlist: View: Get Complete DFIN Trend Analysis ➞ | |
 | DENN Denny s Corporation |
| Sector: Services & Goods | |
| SubSector: Restaurants | |
| MarketCap: 367.47 Millions | |
| Recent Price: 4.10 Smart Investing & Trading Score: 80 | |
| Day Percent Change: 2.46% Day Change: 0.15 | |
| Week Change: 15.17% Year-to-date Change: -32.2% | |
| DENN Links: Profile News Message Board | |
| Charts:- Daily , Weekly | |
| Add DENN to Watchlist: View: Get Complete DENN Trend Analysis ➞ | |
 | BYD Boyd Gaming Corporation |
| Sector: Services & Goods | |
| SubSector: Resorts & Casinos | |
| MarketCap: 1652.54 Millions | |
| Recent Price: 84.33 Smart Investing & Trading Score: 80 | |
| Day Percent Change: 2.3% Day Change: 1.35 | |
| Week Change: 1.24% Year-to-date Change: 16.9% | |
| BYD Links: Profile News Message Board | |
| Charts:- Daily , Weekly | |
| Add BYD to Watchlist: View: Get Complete BYD Trend Analysis ➞ | |
 | SCHL Scholastic Corporation |
| Sector: Services & Goods | |
| SubSector: Publishing - Books | |
| MarketCap: 791 Millions | |
| Recent Price: 26.35 Smart Investing & Trading Score: 80 | |
| Day Percent Change: 2% Day Change: 0.62 | |
| Week Change: 5.82% Year-to-date Change: 26.2% | |
| SCHL Links: Profile News Message Board | |
| Charts:- Daily , Weekly | |
| Add SCHL to Watchlist: View: Get Complete SCHL Trend Analysis ➞ | |
 | MATW Matthews International Corporation |
| Sector: Services & Goods | |
| SubSector: Personal Services | |
| MarketCap: 803.325 Millions | |
| Recent Price: 25.37 Smart Investing & Trading Score: 80 | |
| Day Percent Change: 1.98% Day Change: 0.5 | |
| Week Change: 2.08% Year-to-date Change: -5.3% | |
| MATW Links: Profile News Message Board | |
| Charts:- Daily , Weekly | |
| Add MATW to Watchlist: View: Get Complete MATW Trend Analysis ➞ | |
 | IMKTA Ingles Markets, Incorporated |
| Sector: Services & Goods | |
| SubSector: Grocery Stores | |
| MarketCap: 827.075 Millions | |
| Recent Price: 64.79 Smart Investing & Trading Score: 80 | |
| Day Percent Change: 1.98% Day Change: 1.4 | |
| Week Change: 2.27% Year-to-date Change: 1.3% | |
| IMKTA Links: Profile News Message Board | |
| Charts:- Daily , Weekly | |
| Add IMKTA to Watchlist: View: Get Complete IMKTA Trend Analysis ➞ | |
 | SIRI Sirius XM Holdings Inc. |
| Sector: Services & Goods | |
| SubSector: Broadcasting - Radio | |
| MarketCap: 21325.5 Millions | |
| Recent Price: 22.41 Smart Investing & Trading Score: 80 | |
| Day Percent Change: 1.75% Day Change: 0.06 | |
| Week Change: 8.24% Year-to-date Change: 1.9% | |
| SIRI Links: Profile News Message Board | |
| Charts:- Daily , Weekly | |
| Add SIRI to Watchlist: View: Get Complete SIRI Trend Analysis ➞ | |
 | PFGC Performance Food Group Company |
| Sector: Services & Goods | |
| SubSector: Restaurants | |
| MarketCap: 2457.5 Millions | |
| Recent Price: 101.27 Smart Investing & Trading Score: 80 | |
| Day Percent Change: 1.44% Day Change: 1.06 | |
| Week Change: 3.04% Year-to-date Change: 19.8% | |
| PFGC Links: Profile News Message Board | |
| Charts:- Daily , Weekly | |
| Add PFGC to Watchlist: View: Get Complete PFGC Trend Analysis ➞ | |
 | MG Mistras Group, Inc. |
| Sector: Services & Goods | |
| SubSector: Security & Protection Services | |
| MarketCap: 136.903 Millions | |
| Recent Price: 9.16 Smart Investing & Trading Score: 80 | |
| Day Percent Change: 1.2% Day Change: 0.14 | |
| Week Change: 14.93% Year-to-date Change: 1.1% | |
| MG Links: Profile News Message Board | |
| Charts:- Daily , Weekly | |
| Add MG to Watchlist: View: Get Complete MG Trend Analysis ➞ | |
 | LYV Live Nation Entertainment, Inc. |
| Sector: Services & Goods | |
| SubSector: Entertainment - Diversified | |
| MarketCap: 8457.17 Millions | |
| Recent Price: 158.87 Smart Investing & Trading Score: 80 | |
| Day Percent Change: 0.88% Day Change: 0.84 | |
| Week Change: 6.42% Year-to-date Change: 22.7% | |
| LYV Links: Profile News Message Board | |
| Charts:- Daily , Weekly | |
| Add LYV to Watchlist: View: Get Complete LYV Trend Analysis ➞ | |
 | HLT Hilton Worldwide Holdings Inc. |
| Sector: Services & Goods | |
| SubSector: Lodging | |
| MarketCap: 18064.6 Millions | |
| Recent Price: 272.85 Smart Investing & Trading Score: 80 | |
| Day Percent Change: 0.71% Day Change: 1.53 | |
| Week Change: 4.56% Year-to-date Change: 10.5% | |
| HLT Links: Profile News Message Board | |
| Charts:- Daily , Weekly | |
| Add HLT to Watchlist: View: Get Complete HLT Trend Analysis ➞ | |
 | MGM MGM Resorts International |
| Sector: Services & Goods | |
| SubSector: Resorts & Casinos | |
| MarketCap: 5315.04 Millions | |
| Recent Price: 36.45 Smart Investing & Trading Score: 80 | |
| Day Percent Change: 0.44% Day Change: 0.17 | |
| Week Change: 3.88% Year-to-date Change: 5.2% | |
| MGM Links: Profile News Message Board | |
| Charts:- Daily , Weekly | |
| Add MGM to Watchlist: View: Get Complete MGM Trend Analysis ➞ | |
| For tabular summary view of above stock list: Summary View ➞ 0 - 25 , 25 - 50 , 50 - 75 , 75 - 100 , 100 - 125 , 125 - 150 , 150 - 175 , 175 - 200 , 200 - 225 , 225 - 250 , 250 - 275 , 275 - 300 | ||
| Click To Change The Sort Order: By Market Cap or Company Size Performance: Year-to-date, Week and Day | |
| Select Chart Type: | ||
|
Best Stocks Today 12Stocks.com |
© 2025 12Stocks.com Terms & Conditions Privacy Contact Us
All Information Provided Only For Education And Not To Be Used For Investing or Trading. See Terms & Conditions


One More Thing ... Get Best Stocks Delivered Daily!
Never Ever Miss A Move With Our Top Ten Stocks Lists
Find Best Stocks In Any Market - Bull or Bear Market
Take A Peek At Our Top Ten Stocks Lists: Daily, Weekly, Year-to-Date & Top Trends
Find Best Stocks In Any Market - Bull or Bear Market
Take A Peek At Our Top Ten Stocks Lists: Daily, Weekly, Year-to-Date & Top Trends
Consumer Services Stocks With Best Up Trends [0-bearish to 100-bullish]: Daily Journal[100], Napco Security[100], Louisiana-Pacific [100], Ritchie Bros.[100], eBay [100], Graham [100], Fastenal [100], AECOM [100], Kelly Services[100], Wayfair [100], Gray Television[100]
Best Consumer Services Stocks Year-to-Date:
Willdan [210.66%], Kratos Defense[160.61%], Altisource Portfolio[97.94%], Gray Television[94.26%], Wayfair [77.55%], Noodles & [76.23%], VSE [73.56%], Sears [67.56%], eBay [64.06%], WNS ()[58.64%], Dollar General[55.7%] Best Consumer Services Stocks This Week:
Willdan [34.44%], Gray Television[33.03%], Park-Ohio [27.27%], TEGNA [27.26%], Etsy [24.72%], AMC Networks[22.47%], Deluxe [21.77%], Kohl s[19.15%], Petco Health[19%], Kelly Services[18.78%], CompX [18.12%] Best Consumer Services Stocks Daily:
CareDx [185.69%], Wingstop [150.46%], National CineMedia[112.46%], VSE [69.41%], Burlington Stores[66.03%], Myriad Genetics[64.88%], Costco Wholesale[58.1%], Daily Journal[57.5%], Texas Roadhouse[55.27%], Royal Caribbean[53.63%], CRA [53.26%]