
 Login Sign Up


| |||||
 |  | ||||

| 12Stocks.com Market Intelligence |
Best Consumer Services Stocks
| In a hurry? Services & Goods Stocks: Performance Trends Table, Stock Charts
Sort Consumer Services: Daily, Weekly, Year-to-Date, Market Cap & Trends. Filter Services & Goods stocks list by size: All Large Mid-Range Small |
| 12Stocks.com Consumer Services Stocks Performances & Trends Daily | |||||||||
|
|  The overall Smart Investing & Trading Score is 100 (0-bearish to 100-bullish) which puts Consumer Services sector in short term bullish trend. The Smart Investing & Trading Score from previous trading session is 90 and an improvement of trend continues.
| ||||||||
Here are the Smart Investing & Trading Scores of the most requested Consumer Services stocks at 12Stocks.com (click stock name for detailed review):
|


| Consider signing up for our daily 12Stocks.com "Best Stocks Newsletter". You will never ever miss a big stock move again! |
| 12Stocks.com: Investing in Consumer Services sector with Stocks | |
|
The following table helps investors and traders sort through current performance and trends (as measured by Smart Investing & Trading Score) of various
stocks in the Consumer Services sector. Quick View: Move mouse or cursor over stock symbol (ticker) to view short-term Technical chart and over stock name to view long term chart. Click on  to add stock symbol to your watchlist and to add stock symbol to your watchlist and  to view watchlist. Click on any ticker or stock name for detailed market intelligence report for that stock. to view watchlist. Click on any ticker or stock name for detailed market intelligence report for that stock. |
12Stocks.com Performance of Stocks in Consumer Services Sector
| Ticker | Stock Name | Watchlist | Category | Recent Price | Smart Investing & Trading Score | Change % | YTD Change% |
| DJCO | Daily Journal |   | Publishing | 451.02 | 100 | 57.50% | -20.59% |
| NSSC | Napco Security | | Security | 32.45 | 100 | 52.56% | -7.84% |
| LPX | Louisiana-Pacific | | Wholesale | 102.75 | 100 | 52.20% | -0.20% |
| RBA | Ritchie Bros. | | Services | 118.02 | 100 | 47.48% | 31.59% |
| EBAY | eBay | | Retail | 100.77 | 100 | 35.29% | 64.06% |
| GHC | Graham | | Education | 1061.70 | 100 | 30.97% | 22.49% |
| FAST | Fastenal | | Equipment | 49.21 | 100 | 20.11% | 39.05% |
| ACM | AECOM | | Services | 122.02 | 100 | 14.94% | 15.09% |
| KELYA | Kelly Services | | Staffing | 14.55 | 100 | 13.06% | 5.58% |
| W | Wayfair | | Retail | 78.69 | 100 | 9.20% | 77.55% |
| GTN | Gray Television | | Broadcasting | 5.88 | 100 | 7.20% | 94.26% |
| WSM | Williams-Sonoma | | Retail | 210.20 | 100 | 6.79% | 14.83% |
| RUSHB | Rush Enterprises | | Automobile | 59.82 | 100 | 6.54% | 10.99% |
| HVT | Haverty Furniture | | Retail | 23.14 | 100 | 6.43% | 7.13% |
| GCO | Genesco | | Apparel | 27.15 | 100 | 5.09% | -36.49% |
| OUT | Outfront Media | | Marketing | 18.78 | 100 | 5.04% | 7.06% |
| BKE | Buckle | | Apparel | 57.26 | 100 | 4.97% | 21.35% |
| ZUMZ | Zumiez | | Retail | 15.98 | 100 | 4.90% | -16.64% |
| AEO | American Eagle | | Apparel | 13.52 | 100 | 4.23% | -16.26% |
| LOW | Lowe s | | Retail | 256.33 | 100 | 4.07% | 5.42% |
| BCO | Brink s | | Security | 111.33 | 100 | 3.96% | 21.01% |
| MGA | Magna | | Auto Parts | 45.05 | 100 | 3.86% | 10.70% |
| ETSY | Etsy | | Retail | 70.09 | 100 | 3.33% | 32.52% |
| BABA | Alibaba | | Retail | 126.86 | 100 | 3.13% | 50.81% |
| NEWT | Newtek Business | | Services | 12.30 | 100 | 3.05% | -0.29% |
| For chart view version of above stock list: Chart View ➞ 0 - 25 , 25 - 50 , 50 - 75 , 75 - 100 , 100 - 125 , 125 - 150 , 150 - 175 , 175 - 200 , 200 - 225 , 225 - 250 , 250 - 275 , 275 - 300 | ||
 | Click To Change The Sort Order: By Market Cap or Company Size Performance: Year-to-date, Week and Day |  |
|
Get the most comprehensive stock market coverage daily at 12Stocks.com ➞ Best Stocks Today ➞ Best Stocks Weekly ➞ Best Stocks Year-to-Date ➞ Best Stocks Trends ➞  Best Stocks Today 12Stocks.com Best Nasdaq Stocks ➞ Best S&P 500 Stocks ➞ Best Tech Stocks ➞ Best Biotech Stocks ➞ |
| Detailed Overview of Consumer Services Stocks |
| Consumer Services Technical Overview, Leaders & Laggards, Top Consumer Services ETF Funds & Detailed Consumer Services Stocks List, Charts, Trends & More |
| Consumer Services Sector: Technical Analysis, Trends & YTD Performance | |
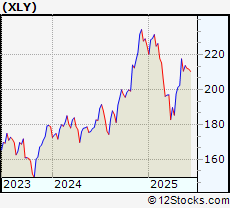
| Consumer Services sector is composed of stocks
from retail, entertainment, media/publishing, consumer goods
and services subsectors. Consumer Services sector, as represented by XLY, an exchange-traded fund [ETF] that holds basket of Consumer Services stocks (e.g, Walmart, Alibaba) is up by 2.95% and is currently underperforming the overall market by -7.38% year-to-date. Below is a quick view of Technical charts and trends: |
|
 XLY Weekly Chart |
|
| Long Term Trend: Very Good | |
| Medium Term Trend: Very Good | |
 XLY Daily Chart |
|
| Short Term Trend: Very Good | |
| Overall Trend Score: 100 | |
| YTD Performance: 2.95% | |
| **Trend Scores & Views Are Only For Educational Purposes And Not For Investing | |
| 12Stocks.com: Top Performing Consumer Services Sector Stocks | ||||||||||||||||||||||||||||||||||||||||||||||||
 The top performing Consumer Services sector stocks year to date are
Now, more recently, over last week, the top performing Consumer Services sector stocks on the move are


|
||||||||||||||||||||||||||||||||||||||||||||||||
| 12Stocks.com: Investing in Consumer Services Sector using Exchange Traded Funds | |
|
The following table shows list of key exchange traded funds (ETF) that
help investors track Consumer Services Index. For detailed view, check out our ETF Funds section of our website. Quick View: Move mouse or cursor over ETF symbol (ticker) to view short-term Technical chart and over ETF name to view long term chart. Click on ticker or stock name for detailed view. Click on to add stock symbol to your watchlist and to view watchlist. |
12Stocks.com List of ETFs that track Consumer Services Index
| Ticker | ETF Name | Watchlist | Recent Price | Smart Investing & Trading Score | Change % | Week % | Year-to-date % |
| XLY | Consumer Discret Sel | | 229.85 | 100 | 2.01 | 2.86 | 2.95% |
| RTH | Retail | | 247.67 | 100 | 0.63 | 0.8 | 10.46% |
| XRT | Retail | | 85.03 | 100 | 2.54 | 4.47 | 7.4% |
| IYK | Consumer Goods | | 70.39 | 70 | 0.37 | 1.49 | 8.38% |
| UCC | Consumer Services | | 49.99 | 100 | 2.96 | 5.78 | -2.73% |
| SCC | Short Consumer Services | | 15.90 | 0 | -19.86 | -5.49 | -12.44% |
| UGE | Consumer Goods | | 19.18 | 70 | 1.05 | 2.4 | 7.27% |
| 12Stocks.com: Charts, Trends, Fundamental Data and Performances of Consumer Services Stocks | |
|
We now take in-depth look at all Consumer Services stocks including charts, multi-period performances and overall trends (as measured by Smart Investing & Trading Score). One can sort Consumer Services stocks (click link to choose) by Daily, Weekly and by Year-to-Date performances. Also, one can sort by size of the company or by market capitalization. |
| Select Your Default Chart Type: | |||||
| |||||
| Click on stock symbol or name for detailed view. Click on to add stock symbol to your watchlist and to view watchlist. Quick View: Move mouse or cursor over "Daily" to quickly view daily Technical stock chart and over "Weekly" to view weekly Technical stock chart. | |||||

 | DJCO Daily Journal Corporation |
| Sector: Services & Goods | |
| SubSector: Publishing - Newspapers | |
| MarketCap: 306.822 Millions | |
| Recent Price: 451.02 Smart Investing & Trading Score: 100 | |
| Day Percent Change: 57.5% Day Change: 178.35 | |
| Week Change: 8.7% Year-to-date Change: -20.6% | |
| DJCO Links: Profile News Message Board | |
| Charts:- Daily , Weekly | |
| Add DJCO to Watchlist: View: Get Complete DJCO Trend Analysis ➞ | |
 | NSSC Napco Security Technologies, Inc. |
| Sector: Services & Goods | |
| SubSector: Security & Protection Services | |
| MarketCap: 339.103 Millions | |
| Recent Price: 32.45 Smart Investing & Trading Score: 100 | |
| Day Percent Change: 52.56% Day Change: 19.11 | |
| Week Change: 9.67% Year-to-date Change: -7.8% | |
| NSSC Links: Profile News Message Board | |
| Charts:- Daily , Weekly | |
| Add NSSC to Watchlist: View: Get Complete NSSC Trend Analysis ➞ | |
 | LPX Louisiana-Pacific Corporation |
| Sector: Services & Goods | |
| SubSector: Building Materials Wholesale | |
| MarketCap: 1943.43 Millions | |
| Recent Price: 102.75 Smart Investing & Trading Score: 100 | |
| Day Percent Change: 52.2% Day Change: 33.33 | |
| Week Change: 10.2% Year-to-date Change: -0.2% | |
| LPX Links: Profile News Message Board | |
| Charts:- Daily , Weekly | |
| Add LPX to Watchlist: View: Get Complete LPX Trend Analysis ➞ | |
 | RBA Ritchie Bros. Auctioneers Incorporated |
| Sector: Services & Goods | |
| SubSector: Business Services | |
| MarketCap: 3491.02 Millions | |
| Recent Price: 118.02 Smart Investing & Trading Score: 100 | |
| Day Percent Change: 47.48% Day Change: 27.58 | |
| Week Change: 8.49% Year-to-date Change: 31.6% | |
| RBA Links: Profile News Message Board | |
| Charts:- Daily , Weekly | |
| Add RBA to Watchlist: View: Get Complete RBA Trend Analysis ➞ | |
 | EBAY eBay Inc. |
| Sector: Services & Goods | |
| SubSector: Specialty Retail, Other | |
| MarketCap: 23152.3 Millions | |
| Recent Price: 100.77 Smart Investing & Trading Score: 100 | |
| Day Percent Change: 35.29% Day Change: 15.36 | |
| Week Change: 8.89% Year-to-date Change: 64.1% | |
| EBAY Links: Profile News Message Board | |
| Charts:- Daily , Weekly | |
| Add EBAY to Watchlist: View: Get Complete EBAY Trend Analysis ➞ | |
 | GHC Graham Holdings Company |
| Sector: Services & Goods | |
| SubSector: Education & Training Services | |
| MarketCap: 1871.06 Millions | |
| Recent Price: 1061.70 Smart Investing & Trading Score: 100 | |
| Day Percent Change: 30.97% Day Change: 186.78 | |
| Week Change: 9.92% Year-to-date Change: 22.5% | |
| GHC Links: Profile News Message Board | |
| Charts:- Daily , Weekly | |
| Add GHC to Watchlist: View: Get Complete GHC Trend Analysis ➞ | |
 | FAST Fastenal Company |
| Sector: Services & Goods | |
| SubSector: Industrial Equipment Wholesale | |
| MarketCap: 17609.9 Millions | |
| Recent Price: 49.21 Smart Investing & Trading Score: 100 | |
| Day Percent Change: 20.11% Day Change: 11.4 | |
| Week Change: 5.19% Year-to-date Change: 39.1% | |
| FAST Links: Profile News Message Board | |
| Charts:- Daily , Weekly | |
| Add FAST to Watchlist: View: Get Complete FAST Trend Analysis ➞ | |
 | ACM AECOM |
| Sector: Services & Goods | |
| SubSector: Technical Services | |
| MarketCap: 4781.9 Millions | |
| Recent Price: 122.02 Smart Investing & Trading Score: 100 | |
| Day Percent Change: 14.94% Day Change: 12.76 | |
| Week Change: 2.68% Year-to-date Change: 15.1% | |
| ACM Links: Profile News Message Board | |
| Charts:- Daily , Weekly | |
| Add ACM to Watchlist: View: Get Complete ACM Trend Analysis ➞ | |
 | KELYA Kelly Services, Inc. |
| Sector: Services & Goods | |
| SubSector: Staffing & Outsourcing Services | |
| MarketCap: 587.228 Millions | |
| Recent Price: 14.55 Smart Investing & Trading Score: 100 | |
| Day Percent Change: 13.06% Day Change: 2.4 | |
| Week Change: 18.78% Year-to-date Change: 5.6% | |
| KELYA Links: Profile News Message Board | |
| Charts:- Daily , Weekly | |
| Add KELYA to Watchlist: View: Get Complete KELYA Trend Analysis ➞ | |
 | W Wayfair Inc. |
| Sector: Services & Goods | |
| SubSector: Catalog & Mail Order Houses | |
| MarketCap: 3497.02 Millions | |
| Recent Price: 78.69 Smart Investing & Trading Score: 100 | |
| Day Percent Change: 9.2% Day Change: 3.84 | |
| Week Change: 2.62% Year-to-date Change: 77.6% | |
| W Links: Profile News Message Board | |
| Charts:- Daily , Weekly | |
| Add W to Watchlist: View: Get Complete W Trend Analysis ➞ | |
 | GTN Gray Television, Inc. |
| Sector: Services & Goods | |
| SubSector: Broadcasting - TV | |
| MarketCap: 1144.63 Millions | |
| Recent Price: 5.88 Smart Investing & Trading Score: 100 | |
| Day Percent Change: 7.2% Day Change: 0.35 | |
| Week Change: 33.03% Year-to-date Change: 94.3% | |
| GTN Links: Profile News Message Board | |
| Charts:- Daily , Weekly | |
| Add GTN to Watchlist: View: Get Complete GTN Trend Analysis ➞ | |
 | WSM Williams-Sonoma, Inc. |
| Sector: Services & Goods | |
| SubSector: Home Furnishing Stores | |
| MarketCap: 3370.05 Millions | |
| Recent Price: 210.20 Smart Investing & Trading Score: 100 | |
| Day Percent Change: 6.79% Day Change: 8.88 | |
| Week Change: 4.71% Year-to-date Change: 14.8% | |
| WSM Links: Profile News Message Board | |
| Charts:- Daily , Weekly | |
| Add WSM to Watchlist: View: Get Complete WSM Trend Analysis ➞ | |
 | RUSHB Rush Enterprises, Inc. |
| Sector: Services & Goods | |
| SubSector: Auto Dealerships | |
| MarketCap: 203.221 Millions | |
| Recent Price: 59.82 Smart Investing & Trading Score: 100 | |
| Day Percent Change: 6.54% Day Change: 2.93 | |
| Week Change: 9.36% Year-to-date Change: 11.0% | |
| RUSHB Links: Profile News Message Board | |
| Charts:- Daily , Weekly | |
| Add RUSHB to Watchlist: View: Get Complete RUSHB Trend Analysis ➞ | |
 | HVT Haverty Furniture Companies, Inc. |
| Sector: Services & Goods | |
| SubSector: Home Furnishing Stores | |
| MarketCap: 253.125 Millions | |
| Recent Price: 23.14 Smart Investing & Trading Score: 100 | |
| Day Percent Change: 6.43% Day Change: 1.7 | |
| Week Change: 9.1% Year-to-date Change: 7.1% | |
| HVT Links: Profile News Message Board | |
| Charts:- Daily , Weekly | |
| Add HVT to Watchlist: View: Get Complete HVT Trend Analysis ➞ | |
 | GCO Genesco Inc. |
| Sector: Services & Goods | |
| SubSector: Apparel Stores | |
| MarketCap: 187.508 Millions | |
| Recent Price: 27.15 Smart Investing & Trading Score: 100 | |
| Day Percent Change: 5.09% Day Change: 1.51 | |
| Week Change: 5.68% Year-to-date Change: -36.5% | |
| GCO Links: Profile News Message Board | |
| Charts:- Daily , Weekly | |
| Add GCO to Watchlist: View: Get Complete GCO Trend Analysis ➞ | |
 | OUT Outfront Media Inc. |
| Sector: Services & Goods | |
| SubSector: Marketing Services | |
| MarketCap: 1388.15 Millions | |
| Recent Price: 18.78 Smart Investing & Trading Score: 100 | |
| Day Percent Change: 5.04% Day Change: 0.8 | |
| Week Change: 6.28% Year-to-date Change: 7.1% | |
| OUT Links: Profile News Message Board | |
| Charts:- Daily , Weekly | |
| Add OUT to Watchlist: View: Get Complete OUT Trend Analysis ➞ | |
 | BKE The Buckle, Inc. |
| Sector: Services & Goods | |
| SubSector: Apparel Stores | |
| MarketCap: 913.808 Millions | |
| Recent Price: 57.26 Smart Investing & Trading Score: 100 | |
| Day Percent Change: 4.97% Day Change: 2.07 | |
| Week Change: 10.67% Year-to-date Change: 21.4% | |
| BKE Links: Profile News Message Board | |
| Charts:- Daily , Weekly | |
| Add BKE to Watchlist: View: Get Complete BKE Trend Analysis ➞ | |
 | ZUMZ Zumiez Inc. |
| Sector: Services & Goods | |
| SubSector: Specialty Retail, Other | |
| MarketCap: 526.244 Millions | |
| Recent Price: 15.98 Smart Investing & Trading Score: 100 | |
| Day Percent Change: 4.9% Day Change: 1.36 | |
| Week Change: 8.93% Year-to-date Change: -16.6% | |
| ZUMZ Links: Profile News Message Board | |
| Charts:- Daily , Weekly | |
| Add ZUMZ to Watchlist: View: Get Complete ZUMZ Trend Analysis ➞ | |
 | AEO American Eagle Outfitters, Inc. |
| Sector: Services & Goods | |
| SubSector: Apparel Stores | |
| MarketCap: 1577.08 Millions | |
| Recent Price: 13.52 Smart Investing & Trading Score: 100 | |
| Day Percent Change: 4.23% Day Change: 0.9 | |
| Week Change: 5.46% Year-to-date Change: -16.3% | |
| AEO Links: Profile News Message Board | |
| Charts:- Daily , Weekly | |
| Add AEO to Watchlist: View: Get Complete AEO Trend Analysis ➞ | |
 | LOW Lowe s Companies, Inc. |
| Sector: Services & Goods | |
| SubSector: Home Improvement Stores | |
| MarketCap: 56084.2 Millions | |
| Recent Price: 256.33 Smart Investing & Trading Score: 100 | |
| Day Percent Change: 4.07% Day Change: 9.78 | |
| Week Change: 7.57% Year-to-date Change: 5.4% | |
| LOW Links: Profile News Message Board | |
| Charts:- Daily , Weekly | |
| Add LOW to Watchlist: View: Get Complete LOW Trend Analysis ➞ | |
 | BCO The Brink s Company |
| Sector: Services & Goods | |
| SubSector: Security & Protection Services | |
| MarketCap: 2544.73 Millions | |
| Recent Price: 111.33 Smart Investing & Trading Score: 100 | |
| Day Percent Change: 3.96% Day Change: 4.16 | |
| Week Change: 11.31% Year-to-date Change: 21.0% | |
| BCO Links: Profile News Message Board | |
| Charts:- Daily , Weekly | |
| Add BCO to Watchlist: View: Get Complete BCO Trend Analysis ➞ | |
 | MGA Magna International Inc. |
| Sector: Services & Goods | |
| SubSector: Auto Parts Wholesale | |
| MarketCap: 8967.3 Millions | |
| Recent Price: 45.05 Smart Investing & Trading Score: 100 | |
| Day Percent Change: 3.86% Day Change: 1.58 | |
| Week Change: 7.26% Year-to-date Change: 10.7% | |
| MGA Links: Profile News Message Board | |
| Charts:- Daily , Weekly | |
| Add MGA to Watchlist: View: Get Complete MGA Trend Analysis ➞ | |
 | ETSY Etsy, Inc. |
| Sector: Services & Goods | |
| SubSector: Specialty Retail, Other | |
| MarketCap: 4263.24 Millions | |
| Recent Price: 70.09 Smart Investing & Trading Score: 100 | |
| Day Percent Change: 3.33% Day Change: 1.78 | |
| Week Change: 24.72% Year-to-date Change: 32.5% | |
| ETSY Links: Profile News Message Board | |
| Charts:- Daily , Weekly | |
| Add ETSY to Watchlist: View: Get Complete ETSY Trend Analysis ➞ | |
 | BABA Alibaba Group Holding Limited |
| Sector: Services & Goods | |
| SubSector: Specialty Retail, Other | |
| MarketCap: 522666 Millions | |
| Recent Price: 126.86 Smart Investing & Trading Score: 100 | |
| Day Percent Change: 3.13% Day Change: 2.59 | |
| Week Change: 4.96% Year-to-date Change: 50.8% | |
| BABA Links: Profile News Message Board | |
| Charts:- Daily , Weekly | |
| Add BABA to Watchlist: View: Get Complete BABA Trend Analysis ➞ | |
 | NEWT Newtek Business Services Corp. |
| Sector: Services & Goods | |
| SubSector: Business Services | |
| MarketCap: 243.982 Millions | |
| Recent Price: 12.30 Smart Investing & Trading Score: 100 | |
| Day Percent Change: 3.05% Day Change: 0.38 | |
| Week Change: 9.72% Year-to-date Change: -0.3% | |
| NEWT Links: Profile News Message Board | |
| Charts:- Daily , Weekly | |
| Add NEWT to Watchlist: View: Get Complete NEWT Trend Analysis ➞ | |
| For tabular summary view of above stock list: Summary View ➞ 0 - 25 , 25 - 50 , 50 - 75 , 75 - 100 , 100 - 125 , 125 - 150 , 150 - 175 , 175 - 200 , 200 - 225 , 225 - 250 , 250 - 275 , 275 - 300 | ||
| Click To Change The Sort Order: By Market Cap or Company Size Performance: Year-to-date, Week and Day | |
| Select Chart Type: | ||
|
Best Stocks Today 12Stocks.com |
© 2025 12Stocks.com Terms & Conditions Privacy Contact Us
All Information Provided Only For Education And Not To Be Used For Investing or Trading. See Terms & Conditions


One More Thing ... Get Best Stocks Delivered Daily!
Never Ever Miss A Move With Our Top Ten Stocks Lists
Find Best Stocks In Any Market - Bull or Bear Market
Take A Peek At Our Top Ten Stocks Lists: Daily, Weekly, Year-to-Date & Top Trends
Find Best Stocks In Any Market - Bull or Bear Market
Take A Peek At Our Top Ten Stocks Lists: Daily, Weekly, Year-to-Date & Top Trends
Consumer Services Stocks With Best Up Trends [0-bearish to 100-bullish]: Daily Journal[100], Napco Security[100], Louisiana-Pacific [100], Ritchie Bros.[100], eBay [100], Graham [100], Fastenal [100], AECOM [100], Kelly Services[100], Wayfair [100], Gray Television[100]
Best Consumer Services Stocks Year-to-Date:
Willdan [210.66%], Kratos Defense[160.61%], Altisource Portfolio[97.94%], Gray Television[94.26%], Wayfair [77.55%], Noodles & [76.23%], VSE [73.56%], Sears [67.56%], eBay [64.06%], WNS ()[58.64%], Dollar General[55.7%] Best Consumer Services Stocks This Week:
Willdan [34.44%], Gray Television[33.03%], Park-Ohio [27.27%], TEGNA [27.26%], Etsy [24.72%], AMC Networks[22.47%], Deluxe [21.77%], Kohl s[19.15%], Petco Health[19%], Kelly Services[18.78%], CompX [18.12%] Best Consumer Services Stocks Daily:
CareDx [185.69%], Wingstop [150.46%], National CineMedia[112.46%], VSE [69.41%], Burlington Stores[66.03%], Myriad Genetics[64.88%], Costco Wholesale[58.1%], Daily Journal[57.5%], Texas Roadhouse[55.27%], Royal Caribbean[53.63%], CRA [53.26%]