
 Login Sign Up


| |||||
 |  | ||||

| 12Stocks.com Market Intelligence |
Best Canada Stocks
|
|
| Quick Read: Top Canada Stocks By Performances & Trends: Daily, Weekly, Year-to-Date, Market Cap (Size) & Technical Trends | |||
| Best Canada Views: Quick Browse View, Summary & Slide Show | |||
| 12Stocks.com Canada Stocks Performances & Trends Daily | |||||||||
|
|  The overall market intelligence score is 90 (0-bearish to 100-bullish) which puts Canada index in short term bullish trend. The market intelligence score from previous trading session is 90 and an improvement of trend continues.
| ||||||||
Here are the market intelligence trend scores of the most requested Canada stocks at 12Stocks.com (click stock name for detailed review):
| ||||||||||||||||||||||||
| Scroll down this page for most comprehensive review of Canada stocks by performance, trends, technical analysis, charts, fund plays & more | ||||||||||||||||||||||||

| 12Stocks.com: Top Performing Canada Index Stocks | ||||||||||||||||||||||||||||||||||||||||||||||||
 The top performing Canada Index stocks year to date are
Now, more recently, over last week, the top performing Canada Index stocks on the move are


|
||||||||||||||||||||||||||||||||||||||||||||||||
| 12Stocks.com: Investing in Canada Index with Stocks | |
|
The following table helps investors and traders sort through current performance and trends (as measured by market intelligence score) of various
stocks in the Canada Index. Quick View: Move mouse or cursor over stock symbol (ticker) to view short-term technical chart and over stock name to view long term chart. Click on  to add stock symbol to your watchlist and to add stock symbol to your watchlist and  to view watchlist. Click on any ticker or stock name for detailed market intelligence report for that stock. to view watchlist. Click on any ticker or stock name for detailed market intelligence report for that stock. |
12Stocks.com Performance of Stocks in Canada Index
| Ticker | Stock Name | Watchlist | Category | Recent Price | Market Intelligence Score | Change % | YTD Change% |
| NTR | Nutrien |   | Materials | 56.43 | 0 | -0.97% | 27.19% |
| KGC | Kinross Gold | | Materials | 22.11 | 100 | 2.89% | 124.85% |
| TU | Telus Corp | | Technology | 16.57 | 60 | 0.91% | 26.06% |
| FTS | Fortis | | Utilities | 49.23 | 10 | -0.91% | 21.26% |
| BCE | BCE | | Technology | 24.72 | 70 | 1.02% | 10.93% |
| ABX | Barrick Gold | | Materials | 13.54 | 30 | 0.00% | 0.00% |
| PBA | Pembina Pipeline | | Energy | 37.98 | 90 | 0.50% | 5.04% |
| GIB | CGI | | Technology | 96.73 | 50 | 1.51% | -11.24% |
| LULU | Lululemon Athletica | | Services & Goods | 166.84 | 0 | -0.57% | -59.72% |
| RCI | | Technology | 35.89 | 90 | 0.84% | 21.26% | |
| GFL | GFL Environmental | | Industrials | 47.90 | 0 | -0.70% | 7.45% |
| TECK | Teck Resources | | Materials | 34.31 | 80 | 4.70% | -15.77% |
| POT | Potash | | Materials | 831.27 | 80 | 2.11% | 0.00% |
| AGI | Alamos Gold | | Materials | 32.19 | 90 | 2.03% | 67.46% |
| AGU | Agrium | | Materials | 16.91 | 10 | -0.35% | 0.00% |
| GG | Goldcorp | | Materials | 16.91 | 0 | -0.35% | 0.00% |
| MGA | Magna | | Services & Goods | 45.88 | 80 | 1.17% | 14.22% |
| PHYS | Sprott Physical | | Financials | 27.60 | 100 | 1.21% | 35.03% |
| PAAS | Pan American | | Materials | 34.60 | 100 | 3.04% | 63.30% |
| STN | Stantec | | Industrials | 108.05 | 10 | -1.13% | 38.04% |
| ECA | Encana | | Energy | 46.90 | 80 | 0.06% | 0.00% |
| DSGX | Descartes Systems | | Technology | 107.79 | 90 | 1.48% | -5.03% |
| FSV | Service Corp | | Financials | 201.58 | 80 | -0.27% | 13.06% |
| SLW | Silver Wheaton | | Materials | 118.80 | 60 | 0.65% | 0.00% |
| CAE | Cae | | Industrials | 26.62 | 10 | -0.11% | 9.23% |
| To view more stocks, click on Next / Previous arrows or select different range: 0 - 25 , 25 - 50 , 50 - 75 , 75 - 100 , 100 - 125 , 125 - 150 , 150 - 175 , 175 - 200 , 200 - 225 , 225 - 250 | ||
 | Click To Change The Sort Order: By Market Cap or Company Size Performance: Year-to-date, Week and Day |  |
| Detailed Overview Of Canada Stocks |
| Canada Technical Overview, Leaders & Laggards, Top Canada ETF Funds & Detailed Canada Stocks List, Charts, Trends & More |
| Canada: Technical Analysis, Trends & YTD Performance | |
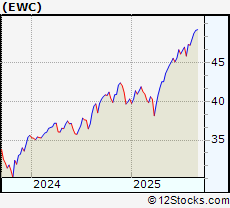
 EWC Weekly Chart |
|
| Long Term Trend: Very Good | |
| Medium Term Trend: Good | |
 EWC Daily Chart |
|
| Short Term Trend: Good | |
| Overall Trend Score: 90 | |
| YTD Performance: 22.6769% | |
| **Trend Scores & Views Are Only For Educational Purposes And Not For Investing | |
| 12Stocks.com: Investing in Canada Index using Exchange Traded Funds | |
|
The following table shows list of key exchange traded funds (ETF) that
help investors play Canada stock market. For detailed view, check out our ETF Funds section of our website. Quick View: Move mouse or cursor over ETF symbol (ticker) to view short-term technical chart and over ETF name to view long term chart. Click on ticker or stock name for detailed view. Click on to add stock symbol to your watchlist and to view watchlist. |
12Stocks.com List of ETFs that track Canada Index
| Ticker | ETF Name | Watchlist | Recent Price | Market Intelligence Score | Change % | Week % | Year-to-date % |
| FCAN | Canada AlphaDEX | | 93.12 | 70 | -0.608389 | 10.3841 | 0% |
| QCAN | Canada StrategicFactors | | 59.03 | 10 | 0 | 0 | 0% |
| 12Stocks.com: Charts, Trends, Fundamental Data and Performances of Canada Stocks | |
|
We now take in-depth look at all Canada stocks including charts, multi-period performances and overall trends (as measured by market intelligence score). One can sort Canada stocks (click link to choose) by Daily, Weekly and by Year-to-Date performances. Also, one can sort by size of the company or by market capitalization. |
| Select Your Default Chart Type: | |||||
| |||||
| Click on stock symbol or name for detailed view. Click on to add stock symbol to your watchlist and to view watchlist. Quick View: Move mouse or cursor over "Daily" to quickly view daily technical stock chart and over "Weekly" to view weekly technical stock chart. | |||||

 | NTR Nutrien Ltd |
| Sector: Materials | |
| SubSector: Agricultural Inputs | |
| MarketCap: 27509.1 Millions | |
| Recent Price: 56.43 Market Intelligence Score: 0 | |
| Day Percent Change: -0.965251% Day Change: 0.57 | |
| Week Change: -2.99123% Year-to-date Change: 27.2% | |
| NTR Links: Profile News Message Board | |
| Charts:- Daily , Weekly | |
| Add NTR to Watchlist: View: Get Complete NTR Trend Analysis ➞ | |
 | KGC Kinross Gold Corp |
| Sector: Materials | |
| SubSector: Gold | |
| MarketCap: 26947.2 Millions | |
| Recent Price: 22.11 Market Intelligence Score: 100 | |
| Day Percent Change: 2.88506% Day Change: 0.43 | |
| Week Change: 9.40129% Year-to-date Change: 124.8% | |
| KGC Links: Profile News Message Board | |
| Charts:- Daily , Weekly | |
| Add KGC to Watchlist: View: Get Complete KGC Trend Analysis ➞ | |
 | TU Telus Corp |
| Sector: Technology | |
| SubSector: Telecom Services | |
| MarketCap: 25269.2 Millions | |
| Recent Price: 16.57 Market Intelligence Score: 60 | |
| Day Percent Change: 0.91352% Day Change: 0 | |
| Week Change: 0.363416% Year-to-date Change: 26.1% | |
| TU Links: Profile News Message Board | |
| Charts:- Daily , Weekly | |
| Add TU to Watchlist: View: Get Complete TU Trend Analysis ➞ | |
 | FTS Fortis Inc |
| Sector: Utilities | |
| SubSector: Utilities - Regulated Electric | |
| MarketCap: 24792.2 Millions | |
| Recent Price: 49.23 Market Intelligence Score: 10 | |
| Day Percent Change: -0.905797% Day Change: -0.08 | |
| Week Change: -1.61871% Year-to-date Change: 21.3% | |
| FTS Links: Profile News Message Board | |
| Charts:- Daily , Weekly | |
| Add FTS to Watchlist: View: Get Complete FTS Trend Analysis ➞ | |
 | BCE BCE Inc |
| Sector: Technology | |
| SubSector: Telecom Services | |
| MarketCap: 22787.6 Millions | |
| Recent Price: 24.72 Market Intelligence Score: 70 | |
| Day Percent Change: 1.02166% Day Change: -0.02 | |
| Week Change: -1.04083% Year-to-date Change: 10.9% | |
| BCE Links: Profile News Message Board | |
| Charts:- Daily , Weekly | |
| Add BCE to Watchlist: View: Get Complete BCE Trend Analysis ➞ | |
 | ABX Barrick Gold Corporation |
| Sector: Materials | |
| SubSector: Gold | |
| MarketCap: 22158.3 Millions | |
| Recent Price: 13.54 Market Intelligence Score: 30 | |
| Day Percent Change: 0% Day Change: -9999 | |
| Week Change: 0% Year-to-date Change: 0.0% | |
| ABX Links: Profile News Message Board | |
| Charts:- Daily , Weekly | |
| Add ABX to Watchlist: View: Get Complete ABX Trend Analysis ➞ | |
 | PBA Pembina Pipeline Corporation |
| Sector: Energy | |
| SubSector: Oil & Gas Midstream | |
| MarketCap: 22063.7 Millions | |
| Recent Price: 37.98 Market Intelligence Score: 90 | |
| Day Percent Change: 0.502779% Day Change: 0.24 | |
| Week Change: 0.822936% Year-to-date Change: 5.0% | |
| PBA Links: Profile News Message Board | |
| Charts:- Daily , Weekly | |
| Add PBA to Watchlist: View: Get Complete PBA Trend Analysis ➞ | |
 | GIB CGI Inc |
| Sector: Technology | |
| SubSector: Information Technology Services | |
| MarketCap: 21345.4 Millions | |
| Recent Price: 96.73 Market Intelligence Score: 50 | |
| Day Percent Change: 1.51118% Day Change: 0.06 | |
| Week Change: 0.259121% Year-to-date Change: -11.2% | |
| GIB Links: Profile News Message Board | |
| Charts:- Daily , Weekly | |
| Add GIB to Watchlist: View: Get Complete GIB Trend Analysis ➞ | |
 | LULU Lululemon Athletica inc |
| Sector: Services & Goods | |
| SubSector: Apparel Retail | |
| MarketCap: 20756.9 Millions | |
| Recent Price: 166.84 Market Intelligence Score: 0 | |
| Day Percent Change: -0.57% Day Change: -0.96 | |
| Week Change: -0.57% Year-to-date Change: -59.7% | |
| LULU Links: Profile News Message Board | |
| Charts:- Daily , Weekly | |
| Add LULU to Watchlist: View: Get Complete LULU Trend Analysis ➞ | |
 | RCI Rogers Communications Inc |
| Sector: Technology | |
| SubSector: Telecom Services | |
| MarketCap: 19388.8 Millions | |
| Recent Price: 35.89 Market Intelligence Score: 90 | |
| Day Percent Change: 0.842933% Day Change: 0.26 | |
| Week Change: 0.307434% Year-to-date Change: 21.3% | |
| RCI Links: Profile News Message Board | |
| Charts:- Daily , Weekly | |
| Add RCI to Watchlist: View: Get Complete RCI Trend Analysis ➞ | |
 | GFL GFL Environmental Inc |
| Sector: Industrials | |
| SubSector: Waste Management | |
| MarketCap: 17404.5 Millions | |
| Recent Price: 47.90 Market Intelligence Score: 0 | |
| Day Percent Change: -0.704809% Day Change: 0.36 | |
| Week Change: -3.48579% Year-to-date Change: 7.5% | |
| GFL Links: Profile News Message Board | |
| Charts:- Daily , Weekly | |
| Add GFL to Watchlist: View: Get Complete GFL Trend Analysis ➞ | |
 | TECK Teck Resources Ltd |
| Sector: Materials | |
| SubSector: Other Industrial Metals & Mining | |
| MarketCap: 16774.2 Millions | |
| Recent Price: 34.31 Market Intelligence Score: 80 | |
| Day Percent Change: 4.69942% Day Change: 0.49 | |
| Week Change: 4.19071% Year-to-date Change: -15.8% | |
| TECK Links: Profile News Message Board | |
| Charts:- Daily , Weekly | |
| Add TECK to Watchlist: View: Get Complete TECK Trend Analysis ➞ | |
 | POT Potash Corporation of Saskatchewan Inc. |
| Sector: Materials | |
| SubSector: Agricultural Chemicals | |
| MarketCap: 14493.6 Millions | |
| Recent Price: 831.27 Market Intelligence Score: 80 | |
| Day Percent Change: 2.10782% Day Change: -9999 | |
| Week Change: 77.1788% Year-to-date Change: 0.0% | |
| POT Links: Profile News Message Board | |
| Charts:- Daily , Weekly | |
| Add POT to Watchlist: View: Get Complete POT Trend Analysis ➞ | |
 | AGI Alamos Gold Inc |
| Sector: Materials | |
| SubSector: Gold | |
| MarketCap: 13533.6 Millions | |
| Recent Price: 32.19 Market Intelligence Score: 90 | |
| Day Percent Change: 2.02853% Day Change: 1.27 | |
| Week Change: 8.3109% Year-to-date Change: 67.5% | |
| AGI Links: Profile News Message Board | |
| Charts:- Daily , Weekly | |
| Add AGI to Watchlist: View: Get Complete AGI Trend Analysis ➞ | |
 | AGU Agrium Inc. |
| Sector: Materials | |
| SubSector: Agricultural Chemicals | |
| MarketCap: 13316.7 Millions | |
| Recent Price: 16.91 Market Intelligence Score: 10 | |
| Day Percent Change: -0.353565% Day Change: -9999 | |
| Week Change: -37.808% Year-to-date Change: 0.0% | |
| AGU Links: Profile News Message Board | |
| Charts:- Daily , Weekly | |
| Add AGU to Watchlist: View: Get Complete AGU Trend Analysis ➞ | |
 | GG Goldcorp Inc. |
| Sector: Materials | |
| SubSector: Gold | |
| MarketCap: 13240.7 Millions | |
| Recent Price: 16.91 Market Intelligence Score: 0 | |
| Day Percent Change: -0.353565% Day Change: -9999 | |
| Week Change: -37.808% Year-to-date Change: 0.0% | |
| GG Links: Profile News Message Board | |
| Charts:- Daily , Weekly | |
| Add GG to Watchlist: View: Get Complete GG Trend Analysis ➞ | |
 | MGA Magna International Inc |
| Sector: Services & Goods | |
| SubSector: Auto Parts | |
| MarketCap: 12928.1 Millions | |
| Recent Price: 45.88 Market Intelligence Score: 80 | |
| Day Percent Change: 1.16869% Day Change: -0.12 | |
| Week Change: -0.88572% Year-to-date Change: 14.2% | |
| MGA Links: Profile News Message Board | |
| Charts:- Daily , Weekly | |
| Add MGA to Watchlist: View: Get Complete MGA Trend Analysis ➞ | |
 | PHYS Sprott Physical Gold Trust |
| Sector: Financials | |
| SubSector: Asset Management | |
| MarketCap: 12808.3 Millions | |
| Recent Price: 27.60 Market Intelligence Score: 100 | |
| Day Percent Change: 1.21012% Day Change: -0.08 | |
| Week Change: 5.90944% Year-to-date Change: 35.0% | |
| PHYS Links: Profile News Message Board | |
| Charts:- Daily , Weekly | |
| Add PHYS to Watchlist: View: Get Complete PHYS Trend Analysis ➞ | |
 | PAAS Pan American Silver Corp |
| Sector: Materials | |
| SubSector: Gold | |
| MarketCap: 12518.3 Millions | |
| Recent Price: 34.60 Market Intelligence Score: 100 | |
| Day Percent Change: 3.03752% Day Change: 0.77 | |
| Week Change: 4.84848% Year-to-date Change: 63.3% | |
| PAAS Links: Profile News Message Board | |
| Charts:- Daily , Weekly | |
| Add PAAS to Watchlist: View: Get Complete PAAS Trend Analysis ➞ | |
 | STN Stantec Inc |
| Sector: Industrials | |
| SubSector: Engineering & Construction | |
| MarketCap: 12325.3 Millions | |
| Recent Price: 108.05 Market Intelligence Score: 10 | |
| Day Percent Change: -1.1346% Day Change: 2.12 | |
| Week Change: -1.26108% Year-to-date Change: 38.0% | |
| STN Links: Profile News Message Board | |
| Charts:- Daily , Weekly | |
| Add STN to Watchlist: View: Get Complete STN Trend Analysis ➞ | |
 | ECA Encana Corporation |
| Sector: Energy | |
| SubSector: Major Integrated Oil & Gas | |
| MarketCap: 10889.6 Millions | |
| Recent Price: 46.90 Market Intelligence Score: 80 | |
| Day Percent Change: 0.0640068% Day Change: -9999 | |
| Week Change: 11.2429% Year-to-date Change: 0.0% | |
| ECA Links: Profile News Message Board | |
| Charts:- Daily , Weekly | |
| Add ECA to Watchlist: View: Get Complete ECA Trend Analysis ➞ | |
 | DSGX Descartes Systems Group Inc |
| Sector: Technology | |
| SubSector: Software - Application | |
| MarketCap: 9246.23 Millions | |
| Recent Price: 107.79 Market Intelligence Score: 90 | |
| Day Percent Change: 1.47806% Day Change: 0.99 | |
| Week Change: 8.11434% Year-to-date Change: -5.0% | |
| DSGX Links: Profile News Message Board | |
| Charts:- Daily , Weekly | |
| Add DSGX to Watchlist: View: Get Complete DSGX Trend Analysis ➞ | |
 | FSV FirstService Corp |
| Sector: Financials | |
| SubSector: Real Estate Services | |
| MarketCap: 9181.97 Millions | |
| Recent Price: 201.58 Market Intelligence Score: 80 | |
| Day Percent Change: -0.267168% Day Change: -1.98 | |
| Week Change: 0.203808% Year-to-date Change: 13.1% | |
| FSV Links: Profile News Message Board | |
| Charts:- Daily , Weekly | |
| Add FSV to Watchlist: View: Get Complete FSV Trend Analysis ➞ | |
 | SLW Silver Wheaton Corp. |
| Sector: Materials | |
| SubSector: Silver | |
| MarketCap: 8631.34 Millions | |
| Recent Price: 118.80 Market Intelligence Score: 60 | |
| Day Percent Change: 0.652377% Day Change: -9999 | |
| Week Change: 84.186% Year-to-date Change: 0.0% | |
| SLW Links: Profile News Message Board | |
| Charts:- Daily , Weekly | |
| Add SLW to Watchlist: View: Get Complete SLW Trend Analysis ➞ | |
 | CAE Cae Inc |
| Sector: Industrials | |
| SubSector: Aerospace & Defense | |
| MarketCap: 8533.31 Millions | |
| Recent Price: 26.62 Market Intelligence Score: 10 | |
| Day Percent Change: -0.11257% Day Change: 0.1 | |
| Week Change: -1.48038% Year-to-date Change: 9.2% | |
| CAE Links: Profile News Message Board | |
| Charts:- Daily , Weekly | |
| Add CAE to Watchlist: View: Get Complete CAE Trend Analysis ➞ | |
| To view more stocks, click on Next / Previous arrows or select different range: 0 - 25 , 25 - 50 , 50 - 75 , 75 - 100 , 100 - 125 , 125 - 150 , 150 - 175 , 175 - 200 , 200 - 225 , 225 - 250 | ||
| Click To Change The Sort Order: By Market Cap or Company Size Performance: Year-to-date, Week and Day | |
| Select Chart Type: | ||
 Best Stocks Today 12Stocks.com |
© 2025 12Stocks.com Terms & Conditions Privacy Contact Us
All Information Provided Only For Education And Not To Be Used For Investing or Trading. See Terms & Conditions


One More Thing ... Get Best Stocks Delivered Daily!
Never Ever Miss A Move With Our Top Ten Stocks Lists
Find Best Stocks In Any Market - Bull or Bear Market
Take A Peek At Our Top Ten Stocks Lists: Daily, Weekly, Year-to-Date & Top Trends
Find Best Stocks In Any Market - Bull or Bear Market
Take A Peek At Our Top Ten Stocks Lists: Daily, Weekly, Year-to-Date & Top Trends
Canada Stocks With Best Up Trends [0-bearish to 100-bullish]: Celestica [100], Equinox Gold[100], Gold Royalty[100], EMX Royalty[100], Iamgold Corp[100], Trilogy Metals[100], Barrick Mining[100], Methanex Corp[100], Eldorado Gold[100], Turquo Hill[100], Denison Mines[100]
Best Canada Stocks Year-to-Date:
Americas Gold[605.128%], Avino Silver[339.322%], Gold Royalty[209.677%], Tower Hill[199.363%], Celestica [160.75%], New Gold[140.458%], EMX Royalty[133.908%], Kinross Gold[124.846%], Sandstorm Gold[102.209%], Agnico Eagle[86.6197%], OR Royalties[85.4636%] Best Canada Stocks This Week:
Crescent Point[4066.17%], Golden Star[1837.95%], Alexco Resource[690.301%], Yamana Gold[625.812%], Novelion [579.167%], Turquo Hill[433.11%], Enerplus [415.601%], Nevsun Resources[402.516%], Bellatrix Exploration[291.621%], Domtar [250.297%], Trillium [203.688%] Best Canada Stocks Daily:
Canadian Solar[15.036%], Celestica [9.64128%], Equinox Gold[9.0301%], Ballard Power[7.56757%], Novelion [7.37813%], Gold Royalty[6.66667%], EMX Royalty[6.5445%], Canopy Growth[5.7971%], Iamgold Corp[4.75687%], Teck Resources[4.69942%], Trilogy Metals[4.54545%]