
 Login Sign Up


| |||||
 |  | ||||

| 12Stocks.com Market Intelligence |
Best Canada Stocks
|
|
| Quick Read: Top Canada Stocks By Performances & Trends: Daily, Weekly, Year-to-Date, Market Cap (Size) & Technical Trends | |||
| Best Canada Views: Quick Browse View, Summary & Slide Show | |||
| 12Stocks.com Canada Stocks Performances & Trends Daily | |||||||||
|
|  The overall market intelligence score is 49 (0-bearish to 100-bullish) which puts Canada index in short term neutral trend. The market intelligence score from previous trading session is 21 and hence an improvement of trend.
| ||||||||
Here are the market intelligence trend scores of the most requested Canada stocks at 12Stocks.com (click stock name for detailed review):
| |||||||||||||||||
| Scroll down this page for most comprehensive review of Canada stocks by performance, trends, technical analysis, charts, fund plays & more | |||||||||||||||||


| 12Stocks.com: Top Performing Canada Index Stocks | ||||||||||||||||||||||||||||||||||||||||||||||||
 The top performing Canada Index stocks year to date are
Now, more recently, over last week, the top performing Canada Index stocks on the move are


|
||||||||||||||||||||||||||||||||||||||||||||||||
| 12Stocks.com: Investing in Canada Index with Stocks | |
|
The following table helps investors and traders sort through current performance and trends (as measured by market intelligence score) of various
stocks in the Canada Index. Quick View: Move mouse or cursor over stock symbol (ticker) to view short-term technical chart and over stock name to view long term chart. Click on  to add stock symbol to your watchlist and to add stock symbol to your watchlist and  to view watchlist. Click on any ticker or stock name for detailed market intelligence report for that stock. to view watchlist. Click on any ticker or stock name for detailed market intelligence report for that stock. |
12Stocks.com Performance of Stocks in Canada Index
| Ticker | Stock Name | Watchlist | Category | Recent Price | Market Intelligence Score | Change % | YTD Change% |
| CVE | Cenovus Energy |   | Energy | 20.63 | 46 | 1.43% | 23.90% |
| PHYS | Sprott Physical | | Financials | 17.84 | 46 | -0.31% | 11.96% |
| BLDP | Ballard Power | | Industrials | 2.66 | 44 | 0.00% | -28.11% |
| BB | BlackBerry | | Technology | 2.86 | 71 | 0.53% | -19.35% |
| CRON | Cronos | | Health Care | 2.69 | 73 | -0.74% | 28.71% |
| CIGI | Colliers | | Financials | 105.69 | 10 | 0.96% | -16.46% |
| ABCL | AbCellera Biologics | | Health Care | 3.70 | 15 | -2.12% | -34.51% |
| AGI | Alamos Gold | | Materials | 15.07 | 60 | 0.70% | 11.84% |
| TFII | TFI | | Transports | 131.98 | 10 | 1.72% | -2.94% |
| SSRM | SSR Mining | | Materials | 5.32 | 68 | -1.12% | -50.56% |
| TAC | TransAlta | | Utilities | 6.74 | 64 | 0.75% | -18.89% |
| TIXT | TEL | | Technology | 8.20 | 17 | -0.85% | -4.09% |
| ZYME | Zymeworks | | Health Care | 8.73 | 49 | -0.34% | -15.98% |
| AUPH | Aurinia | | Health Care | 5.25 | 74 | 1.06% | -41.55% |
| IE | Ivanhoe Electric | | Materials | 10.06 | 43 | -0.69% | -0.74% |
| IAG | IAMGOLD | | Materials | 3.67 | 53 | 1.38% | 45.06% |
| AG | Majestic Silver | | Materials | 6.80 | 53 | 1.04% | 10.57% |
| OR | Osisko Gold | | Materials | 15.35 | 33 | -0.90% | 7.49% |
| EGO | Eldorado Gold | | Materials | 14.59 | 46 | 1.25% | 12.49% |
| LICY | Li-Cycle | | Industrials | 0.68 | 53 | 1.71% | 8.79% |
| CSIQ | Canadian Solar | | Technology | 16.09 | 52 | -1.59% | -38.66% |
| MEOH | Methanex | | Materials | 47.80 | 51 | -0.89% | 0.93% |
| GOOS | Canada Goose | | Consumer Staples | 11.23 | 32 | -0.09% | -5.23% |
| IMAX | IMAX | | Services & Goods | 16.36 | 25 | 1.05% | 8.92% |
| NFGC | New Found | | Materials | 3.57 | 36 | 0.28% | 1.42% |
| To view more stocks, click on Next / Previous arrows or select different range: 0 - 25 , 25 - 50 , 50 - 75 , 75 - 100 , 100 - 125 , 125 - 150 | ||
 | Click To Change The Sort Order: By Market Cap or Company Size Performance: Year-to-date, Week and Day |  |
| Detailed Overview Of Canada Stocks |
| Canada Technical Overview, Leaders & Laggards, Top Canada ETF Funds & Detailed Canada Stocks List, Charts, Trends & More |
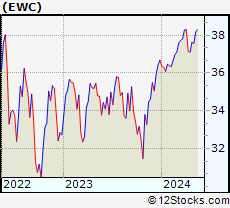
| Canada: Technical Analysis, Trends & YTD Performance | |
 EWC Weekly Chart |
|
| Long Term Trend: Good | |
| Medium Term Trend: Good | |
 EWC Daily Chart |
|
| Short Term Trend: Deteriorating | |
| Overall Trend Score: 49 | |
| YTD Performance: 1.54% | |
| **Trend Scores & Views Are Only For Educational Purposes And Not For Investing | |
| 12Stocks.com: Investing in Canada Index using Exchange Traded Funds | |
|
The following table shows list of key exchange traded funds (ETF) that
help investors play Canada stock market. For detailed view, check out our ETF Funds section of our website. Quick View: Move mouse or cursor over ETF symbol (ticker) to view short-term technical chart and over ETF name to view long term chart. Click on ticker or stock name for detailed view. Click on to add stock symbol to your watchlist and to view watchlist. |
12Stocks.com List of ETFs that track Canada Index
| Ticker | ETF Name | Watchlist | Recent Price | Market Intelligence Score | Change % | Week % | Year-to-date % |
| EWC | Canada | | 37.24 | 49 | 0.83 | -1.02 | 1.54% |
| 12Stocks.com: Charts, Trends, Fundamental Data and Performances of Canada Stocks | |
|
We now take in-depth look at all Canada stocks including charts, multi-period performances and overall trends (as measured by market intelligence score). One can sort Canada stocks (click link to choose) by Daily, Weekly and by Year-to-Date performances. Also, one can sort by size of the company or by market capitalization. |
| Select Your Default Chart Type: | |||||
| |||||
| Click on stock symbol or name for detailed view. Click on to add stock symbol to your watchlist and to view watchlist. Quick View: Move mouse or cursor over "Daily" to quickly view daily technical stock chart and over "Weekly" to view weekly technical stock chart. | |||||

 | CVE Cenovus Energy Inc. |
| Sector: Energy | |
| SubSector: Oil & Gas Drilling & Exploration | |
| MarketCap: 2369.29 Millions | |
| Recent Price: 20.63 Market Intelligence Score: 46 | |
| Day Percent Change: 1.43% Day Change: 0.29 | |
| Week Change: -3.87% Year-to-date Change: 23.9% | |
| CVE Links: Profile News Message Board | |
| Charts:- Daily , Weekly | |
| Add CVE to Watchlist: View: Get Complete CVE Trend Analysis ➞ | |
 | PHYS Sprott Physical Gold Trust |
| Sector: Financials | |
| SubSector: Exchange Traded Fund | |
| MarketCap: 2365.21 Millions | |
| Recent Price: 17.84 Market Intelligence Score: 46 | |
| Day Percent Change: -0.31% Day Change: -0.05 | |
| Week Change: -1.68% Year-to-date Change: 12.0% | |
| PHYS Links: Profile News Message Board | |
| Charts:- Daily , Weekly | |
| Add PHYS to Watchlist: View: Get Complete PHYS Trend Analysis ➞ | |
 | BLDP Ballard Power Systems Inc. |
| Sector: Industrials | |
| SubSector: Industrial Electrical Equipment | |
| MarketCap: 2124.79 Millions | |
| Recent Price: 2.66 Market Intelligence Score: 44 | |
| Day Percent Change: 0.00% Day Change: 0.00 | |
| Week Change: 2.31% Year-to-date Change: -28.1% | |
| BLDP Links: Profile News Message Board | |
| Charts:- Daily , Weekly | |
| Add BLDP to Watchlist: View: Get Complete BLDP Trend Analysis ➞ | |
 | BB BlackBerry Limited |
| Sector: Technology | |
| SubSector: Communication Equipment | |
| MarketCap: 2100.39 Millions | |
| Recent Price: 2.86 Market Intelligence Score: 71 | |
| Day Percent Change: 0.53% Day Change: 0.02 | |
| Week Change: 0.88% Year-to-date Change: -19.4% | |
| BB Links: Profile News Message Board | |
| Charts:- Daily , Weekly | |
| Add BB to Watchlist: View: Get Complete BB Trend Analysis ➞ | |
 | CRON Cronos Group Inc. |
| Sector: Health Care | |
| SubSector: Biotechnology | |
| MarketCap: 1935.95 Millions | |
| Recent Price: 2.69 Market Intelligence Score: 73 | |
| Day Percent Change: -0.74% Day Change: -0.02 | |
| Week Change: 3.86% Year-to-date Change: 28.7% | |
| CRON Links: Profile News Message Board | |
| Charts:- Daily , Weekly | |
| Add CRON to Watchlist: View: Get Complete CRON Trend Analysis ➞ | |
 | CIGI Colliers International Group Inc. |
| Sector: Financials | |
| SubSector: Property Management | |
| MarketCap: 1928.42 Millions | |
| Recent Price: 105.69 Market Intelligence Score: 10 | |
| Day Percent Change: 0.96% Day Change: 1.01 | |
| Week Change: -2.17% Year-to-date Change: -16.5% | |
| CIGI Links: Profile News Message Board | |
| Charts:- Daily , Weekly | |
| Add CIGI to Watchlist: View: Get Complete CIGI Trend Analysis ➞ | |
 | ABCL AbCellera Biologics Inc. |
| Sector: Health Care | |
| SubSector: Biotechnology | |
| MarketCap: 1870 Millions | |
| Recent Price: 3.70 Market Intelligence Score: 15 | |
| Day Percent Change: -2.12% Day Change: -0.08 | |
| Week Change: -1.6% Year-to-date Change: -34.5% | |
| ABCL Links: Profile News Message Board | |
| Charts:- Daily , Weekly | |
| Add ABCL to Watchlist: View: Get Complete ABCL Trend Analysis ➞ | |
 | AGI Alamos Gold Inc. |
| Sector: Materials | |
| SubSector: Gold | |
| MarketCap: 1740.39 Millions | |
| Recent Price: 15.07 Market Intelligence Score: 60 | |
| Day Percent Change: 0.70% Day Change: 0.10 | |
| Week Change: -1.54% Year-to-date Change: 11.8% | |
| AGI Links: Profile News Message Board | |
| Charts:- Daily , Weekly | |
| Add AGI to Watchlist: View: Get Complete AGI Trend Analysis ➞ | |
 | TFII TFI International Inc. |
| Sector: Transports | |
| SubSector: Trucking | |
| MarketCap: 1621.25 Millions | |
| Recent Price: 131.98 Market Intelligence Score: 10 | |
| Day Percent Change: 1.72% Day Change: 2.23 | |
| Week Change: -4.25% Year-to-date Change: -2.9% | |
| TFII Links: Profile News Message Board | |
| Charts:- Daily , Weekly | |
| Add TFII to Watchlist: View: Get Complete TFII Trend Analysis ➞ | |
 | SSRM SSR Mining Inc. |
| Sector: Materials | |
| SubSector: Gold | |
| MarketCap: 1546.09 Millions | |
| Recent Price: 5.32 Market Intelligence Score: 68 | |
| Day Percent Change: -1.12% Day Change: -0.06 | |
| Week Change: -4.49% Year-to-date Change: -50.6% | |
| SSRM Links: Profile News Message Board | |
| Charts:- Daily , Weekly | |
| Add SSRM to Watchlist: View: Get Complete SSRM Trend Analysis ➞ | |
 | TAC TransAlta Corporation |
| Sector: Utilities | |
| SubSector: Diversified Utilities | |
| MarketCap: 1487.8 Millions | |
| Recent Price: 6.74 Market Intelligence Score: 64 | |
| Day Percent Change: 0.75% Day Change: 0.05 | |
| Week Change: 1.66% Year-to-date Change: -18.9% | |
| TAC Links: Profile News Message Board | |
| Charts:- Daily , Weekly | |
| Add TAC to Watchlist: View: Get Complete TAC Trend Analysis ➞ | |
 | TIXT TELUS International (Cda) Inc. |
| Sector: Technology | |
| SubSector: Software - Infrastructure | |
| MarketCap: 1470 Millions | |
| Recent Price: 8.20 Market Intelligence Score: 17 | |
| Day Percent Change: -0.85% Day Change: -0.07 | |
| Week Change: -0.85% Year-to-date Change: -4.1% | |
| TIXT Links: Profile News Message Board | |
| Charts:- Daily , Weekly | |
| Add TIXT to Watchlist: View: Get Complete TIXT Trend Analysis ➞ | |
 | ZYME Zymeworks Inc. |
| Sector: Health Care | |
| SubSector: Biotechnology | |
| MarketCap: 1373.55 Millions | |
| Recent Price: 8.73 Market Intelligence Score: 49 | |
| Day Percent Change: -0.34% Day Change: -0.03 | |
| Week Change: 5.69% Year-to-date Change: -16.0% | |
| ZYME Links: Profile News Message Board | |
| Charts:- Daily , Weekly | |
| Add ZYME to Watchlist: View: Get Complete ZYME Trend Analysis ➞ | |
 | AUPH Aurinia Pharmaceuticals Inc. |
| Sector: Health Care | |
| SubSector: Biotechnology | |
| MarketCap: 1319.75 Millions | |
| Recent Price: 5.25 Market Intelligence Score: 74 | |
| Day Percent Change: 1.06% Day Change: 0.05 | |
| Week Change: 7.03% Year-to-date Change: -41.6% | |
| AUPH Links: Profile News Message Board | |
| Charts:- Daily , Weekly | |
| Add AUPH to Watchlist: View: Get Complete AUPH Trend Analysis ➞ | |
 | IE Ivanhoe Electric Inc. |
| Sector: Materials | |
| SubSector: Copper | |
| MarketCap: 1200 Millions | |
| Recent Price: 10.06 Market Intelligence Score: 43 | |
| Day Percent Change: -0.69% Day Change: -0.07 | |
| Week Change: -5.81% Year-to-date Change: -0.7% | |
| IE Links: Profile News Message Board | |
| Charts:- Daily , Weekly | |
| Add IE to Watchlist: View: Get Complete IE Trend Analysis ➞ | |
 | IAG IAMGOLD Corporation |
| Sector: Materials | |
| SubSector: Gold | |
| MarketCap: 1158.09 Millions | |
| Recent Price: 3.67 Market Intelligence Score: 53 | |
| Day Percent Change: 1.38% Day Change: 0.05 | |
| Week Change: -2.91% Year-to-date Change: 45.1% | |
| IAG Links: Profile News Message Board | |
| Charts:- Daily , Weekly | |
| Add IAG to Watchlist: View: Get Complete IAG Trend Analysis ➞ | |
 | AG First Majestic Silver Corp. |
| Sector: Materials | |
| SubSector: Silver | |
| MarketCap: 1128.56 Millions | |
| Recent Price: 6.80 Market Intelligence Score: 53 | |
| Day Percent Change: 1.04% Day Change: 0.07 | |
| Week Change: -3.41% Year-to-date Change: 10.6% | |
| AG Links: Profile News Message Board | |
| Charts:- Daily , Weekly | |
| Add AG to Watchlist: View: Get Complete AG Trend Analysis ➞ | |
 | OR Osisko Gold Royalties Ltd |
| Sector: Materials | |
| SubSector: Gold | |
| MarketCap: 1025.99 Millions | |
| Recent Price: 15.35 Market Intelligence Score: 33 | |
| Day Percent Change: -0.90% Day Change: -0.14 | |
| Week Change: -4.36% Year-to-date Change: 7.5% | |
| OR Links: Profile News Message Board | |
| Charts:- Daily , Weekly | |
| Add OR to Watchlist: View: Get Complete OR Trend Analysis ➞ | |
 | EGO Eldorado Gold Corporation |
| Sector: Materials | |
| SubSector: Gold | |
| MarketCap: 982.519 Millions | |
| Recent Price: 14.59 Market Intelligence Score: 46 | |
| Day Percent Change: 1.25% Day Change: 0.18 | |
| Week Change: -4.01% Year-to-date Change: 12.5% | |
| EGO Links: Profile News Message Board | |
| Charts:- Daily , Weekly | |
| Add EGO to Watchlist: View: Get Complete EGO Trend Analysis ➞ | |
 | LICY Li-Cycle Holdings Corp. |
| Sector: Industrials | |
| SubSector: Waste Management | |
| MarketCap: 959 Millions | |
| Recent Price: 0.68 Market Intelligence Score: 53 | |
| Day Percent Change: 1.71% Day Change: 0.01 | |
| Week Change: 0.16% Year-to-date Change: 8.8% | |
| LICY Links: Profile News Message Board | |
| Charts:- Daily , Weekly | |
| Add LICY to Watchlist: View: Get Complete LICY Trend Analysis ➞ | |
 | CSIQ Canadian Solar Inc. |
| Sector: Technology | |
| SubSector: Semiconductor - Specialized | |
| MarketCap: 957.96 Millions | |
| Recent Price: 16.09 Market Intelligence Score: 52 | |
| Day Percent Change: -1.59% Day Change: -0.26 | |
| Week Change: 6.2% Year-to-date Change: -38.7% | |
| CSIQ Links: Profile News Message Board | |
| Charts:- Daily , Weekly | |
| Add CSIQ to Watchlist: View: Get Complete CSIQ Trend Analysis ➞ | |
 | MEOH Methanex Corporation |
| Sector: Materials | |
| SubSector: Specialty Chemicals | |
| MarketCap: 894.357 Millions | |
| Recent Price: 47.80 Market Intelligence Score: 51 | |
| Day Percent Change: -0.89% Day Change: -0.43 | |
| Week Change: -0.97% Year-to-date Change: 0.9% | |
| MEOH Links: Profile News Message Board | |
| Charts:- Daily , Weekly | |
| Add MEOH to Watchlist: View: Get Complete MEOH Trend Analysis ➞ | |
 | GOOS Canada Goose Holdings Inc. |
| Sector: Consumer Staples | |
| SubSector: Textile - Apparel Clothing | |
| MarketCap: 881.465 Millions | |
| Recent Price: 11.23 Market Intelligence Score: 32 | |
| Day Percent Change: -0.09% Day Change: -0.01 | |
| Week Change: -0.35% Year-to-date Change: -5.2% | |
| GOOS Links: Profile News Message Board | |
| Charts:- Daily , Weekly | |
| Add GOOS to Watchlist: View: Get Complete GOOS Trend Analysis ➞ | |
 | IMAX IMAX Corporation |
| Sector: Services & Goods | |
| SubSector: Entertainment - Diversified | |
| MarketCap: 874.237 Millions | |
| Recent Price: 16.36 Market Intelligence Score: 25 | |
| Day Percent Change: 1.05% Day Change: 0.17 | |
| Week Change: -4.61% Year-to-date Change: 8.9% | |
| IMAX Links: Profile News Message Board | |
| Charts:- Daily , Weekly | |
| Add IMAX to Watchlist: View: Get Complete IMAX Trend Analysis ➞ | |
 | NFGC New Found Gold Corp. |
| Sector: Materials | |
| SubSector: Gold | |
| MarketCap: 868 Millions | |
| Recent Price: 3.57 Market Intelligence Score: 36 | |
| Day Percent Change: 0.28% Day Change: 0.01 | |
| Week Change: -4.8% Year-to-date Change: 1.4% | |
| NFGC Links: Profile News Message Board | |
| Charts:- Daily , Weekly | |
| Add NFGC to Watchlist: View: Get Complete NFGC Trend Analysis ➞ | |
| To view more stocks, click on Next / Previous arrows or select different range: 0 - 25 , 25 - 50 , 50 - 75 , 75 - 100 , 100 - 125 , 125 - 150 | ||
| Click To Change The Sort Order: By Market Cap or Company Size Performance: Year-to-date, Week and Day | |
| Select Chart Type: | ||
 Best Stocks Today 12Stocks.com |
© 2024 12Stocks.com Terms & Conditions Privacy Contact Us
All Information Provided Only For Education And Not To Be Used For Investing or Trading. See Terms & Conditions


One More Thing ... Get Best Stocks Delivered Daily!
Never Ever Miss A Move With Our Top Ten Stocks Lists
Find Best Stocks In Any Market - Bull or Bear Market
Take A Peek At Our Top Ten Stocks Lists: Daily, Weekly, Year-to-Date & Top Trends
Find Best Stocks In Any Market - Bull or Bear Market
Take A Peek At Our Top Ten Stocks Lists: Daily, Weekly, Year-to-Date & Top Trends
Canada Stocks With Best Up Trends [0-bearish to 100-bullish]: Brookfield Renewable[100], Mercer [100], CAE [100], Algonquin Power[100], Tilray [95], Descartes Systems[95], New Gold[95], Algonquin Power[90], Fortuna Silver[90], Enbridge [88], Sandstorm Gold[88]
Best Canada Stocks Year-to-Date:
Aurora Cannabis[1416.17%], Fusion [123.49%], McEwen Mining[63.66%], D-Wave Quantum[57.28%], OrganiGram [51.91%], Hudbay Minerals[49.82%], IAMGOLD [45.06%], Gold Royalty[40.83%], Endeavour Silver[37.06%], New Gold[29.45%], Cronos [28.71%] Best Canada Stocks This Week:
Tilray [16.85%], Brookfield Renewable[12.42%], Repare [9.53%], Vision Marine[8.51%], Aurora Cannabis[7.76%], Aurinia [7.03%], OrganiGram [6.99%], Canadian Solar[6.2%], Zymeworks [5.69%], Xenon [5.2%], Denison Mines[4.93%] Best Canada Stocks Daily:
Vermilion Energy[6.26%], Repare [6.21%], Denison Mines[4.41%], Cameco [4.05%], OrganiGram [3.92%], Trilogy Metals[3.39%], Vision Marine[3.31%], CGI [3.25%], Tilray [2.97%], Brookfield Renewable[2.96%], Stantec [2.62%]