
 Login Sign Up


| |||||
 |  | ||||

| 12Stocks.com Market Intelligence |
Best Biotech Stocks
|
|
| Quick Read: Best Biotech Stocks List By Performances & Trends: Daily, Weekly, Year-to-Date, Market Cap (Size) & Technical Trends | |||
| Best Biotech Stocks Views: Quick Browse View, Summary & Slide Show View | |||
| 12Stocks.com Biotech Stocks Performances & Trends Daily | |||||||||
|
|  The overall market intelligence score is 100 (0-bearish to 100-bullish) which puts Biotech sector in short term bullish trend. The market intelligence score from previous trading session is 90 and an improvement of trend continues.
| ||||||||
Here are the market intelligence trend scores of the most requested Biotech stocks at 12Stocks.com (click stock name for detailed review):
|


| 12Stocks.com: Investing in Biotech sector with Stocks | |
|
The following table helps investors and traders sort through current performance and trends (as measured by market intelligence score) of various
stocks in the Biotech sector. Quick View: Move mouse or cursor over stock symbol (ticker) to view short-term Technical chart and over stock name to view long term chart. Click on  to add stock symbol to your watchlist and to add stock symbol to your watchlist and  to view watchlist. Click on any ticker or stock name for detailed market intelligence report for that stock. to view watchlist. Click on any ticker or stock name for detailed market intelligence report for that stock. |
12Stocks.com Performance of Stocks in Biotech Sector
| Ticker | Stock Name | Watchlist | Category | Recent Price | Market Intelligence Score | Change % | YTD Change% |
| INSM | Insmed |   | Biotechnology | 152.83 | 90 | 3.77 | 118.49% |
| SGMO | Sangamo | | Biotechnology | 0.70 | 80 | 3.77 | -38.05% |
| XERS | Xeris Biopharma | | Biotechnology | 8.31 | 90 | 3.75 | 140.17% |
| SRRA | Sierra Oncology | | Biotechnology | 14.95 | 30 | 3.68 | 0.00% |
| AIMT | Aimmune | | Biotechnology | 150.75 | 70 | 3.66 | 0.00% |
| TECH | Bio-Techne Corp | | Biotechnology | 62.09 | 100 | 3.62 | -12.89% |
| SPRO | Spero | | Biotechnology | 2.03 | 60 | 3.57 | 87.96% |
| VTYX | Ventyx | | Biotechnology | 3.53 | 54 | 3.52 | 21.00% |
| GNFT | Genfit ADR | | Biotechnology | 3.98 | 60 | 3.51 | 4.05% |
| BMEA | Biomea Fusion | | Biotechnology | 2.09 | 80 | 3.47 | -43.36% |
| PLRX | Pliant | | Biotechnology | 1.50 | 50 | 3.45 | -88.70% |
| HOOK | HOOKIPA Pharma | | Biotechnology | 0.92 | 70 | 3.37 | -52.82% |
| CMPX | Compass | | Biotechnology | 3.47 | 30 | 3.27 | 147.86% |
| PDLI | PDL BioPharma | | Biotechnology | 22.03 | 90 | 3.23 | 0.00% |
| HRTX | Heron | | Biotechnology | 1.29 | 60 | 3.20 | -19.38% |
| INBX | Inhibrx | | Biotechnology | 35.06 | 100 | 3.19 | 129.93% |
| MCRB | Seres | | Biotechnology | 21.15 | 100 | 3.17 | 25.40% |
| ARGX | Argen X | | Biotechnology | 791.59 | 100 | 3.16 | 27.64% |
| ARNA | Arena | | Biotechnology | 2.34 | 20 | 3.08 | 0.00% |
| RARE | Ultragenyx | | Biotechnology | 30.91 | 100 | 3.07 | -24.88% |
| ANNX | Annexon | | Biotechnology | 3.12 | 80 | 2.97 | -43.27% |
| SLN | Silence | | Biotechnology | 5.25 | 30 | 2.94 | -26.98% |
| ACHV | Achieve Life | | Biotechnology | 3.19 | 100 | 2.90 | -13.55% |
| TRIL | Trillium | | Biotechnology | 56.00 | 80 | 2.88 | 0.00% |
| NKTR | Nektar | | Biotechnology | 60.52 | 90 | 2.84 | 319.84% |
| To view more stocks, click on Next / Previous arrows or select different range: 0 - 25 , 25 - 50 , 50 - 75 , 75 - 100 , 100 - 125 , 125 - 150 , 150 - 175 , 175 - 200 , 200 - 225 , 225 - 250 , 250 - 275 , 275 - 300 , 300 - 325 , 325 - 350 , 350 - 375 , 375 - 400 , 400 - 425 , 425 - 450 , 450 - 475 | ||
 | Click To Change The Sort Order: By Market Cap or Company Size Performance: Year-to-date, Week and Day |  |
|
Get the most comprehensive stock market coverage daily at 12Stocks.com ➞ Best Stocks Today ➞ Best Stocks Weekly ➞ Best Stocks Year-to-Date ➞ Best Stocks Trends ➞  Best Stocks Today 12Stocks.com Best Nasdaq Stocks ➞ Best S&P 500 Stocks ➞ Best Tech Stocks ➞ Best Biotech Stocks ➞ |
| Detailed Overview of Biotech Stocks |
| Biotech Technical Overview, Leaders & Laggards, Top Biotech ETF Funds & Detailed Biotech Stocks List, Charts, Trends & More |
| Biotech Sector: Technical Analysis, Trends & YTD Performance | |
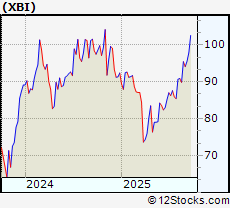
| Biotech sector, as represented by XBI, an exchange-traded fund [ETF] that holds basket of Biotech stocks (e.g, Amgen, Celgene) is up by 12.1001% and is currently underperforming the overall market by -2.6578% year-to-date. Below is a quick view of Technical charts and trends: | |
 XBI Weekly Chart |
|
| Long Term Trend: Very Good | |
| Medium Term Trend: Very Good | |
 XBI Daily Chart |
|
| Short Term Trend: Very Good | |
| Overall Trend Score: 100 | |
| YTD Performance: 12.1001% | |
| **Trend Scores & Views Are Only For Educational Purposes And Not For Investing | |
| 12Stocks.com: Top Performing Biotech Sector Stocks | ||||||||||||||||||||||||||||||||||||||||||||||
 The top performing Biotech sector stocks year to date are
Now, more recently, over last week, the top performing Biotech sector stocks on the move are


|
||||||||||||||||||||||||||||||||||||||||||||||
| 12Stocks.com: Investing in Biotech Sector using Exchange Traded Funds | |
|
The following table shows list of key exchange traded funds (ETF) that
help investors track Biotech Index. For detailed view, check out our ETF Funds section of our website. Quick View: Move mouse or cursor over ETF symbol (ticker) to view short-term Technical chart and over ETF name to view long term chart. Click on ticker or stock name for detailed view. Click on to add stock symbol to your watchlist and to view watchlist. |
12Stocks.com List of ETFs that track Biotech Index
| Ticker | ETF Name | Watchlist | Recent Price | Market Intelligence Score | Change % | Week % | Year-to-date % |
| UBIO | Biotechnology | | 73.34 | 80 | -0.0681292 | 260.748 | 0% |
| HCRF | Edge Multifactor | | 67.14 | 23 | 0 | 9999 | NA |
| SICK | Healthcare Bear 3X | | 37.90 | 36 | 0 | 9999 | NA |
| LABS | Biotech Bear 1X | | 24.18 | 56 | 0 | 9999 | NA |
| BTEC | Principal Healthcare Innovators | | 39.49 | 30 | 0 | 1.02328 | 0% |
| 12Stocks.com: Charts, Trends, Fundamental Data and Performances of Biotech Stocks | |
|
We now take in-depth look at all Biotech stocks including charts, multi-period performances and overall trends (as measured by market intelligence score). One can sort Biotech stocks (click link to choose) by Daily, Weekly and by Year-to-Date performances. Also, one can sort by size of the company or by market capitalization. |
| Select Your Default Chart Type: | |||||
| |||||
| Click on stock symbol or name for detailed view. Click on to add stock symbol to your watchlist and to view watchlist. Quick View: Move mouse or cursor over "Daily" to quickly view daily Technical stock chart and over "Weekly" to view weekly Technical stock chart. | |||||

 | INSM Insmed Inc |
| Sector: Health Care | |
| SubSector: Biotechnology | |
| MarketCap: 30670.5 Millions | |
| Recent Price: 152.83 Market Intelligence Score: 90 | |
| Day Percent Change: 3.76833% Day Change: 3.15 | |
| Week Change: 8.39007% Year-to-date Change: 118.5% | |
| INSM Links: Profile News Message Board | |
| Charts:- Daily , Weekly | |
| Add INSM to Watchlist: View: Get Complete INSM Trend Analysis ➞ | |
 | SGMO Sangamo Therapeutics Inc |
| Sector: Health Care | |
| SubSector: Biotechnology | |
| MarketCap: 165.1 Millions | |
| Recent Price: 0.70 Market Intelligence Score: 80 | |
| Day Percent Change: 3.76519% Day Change: 0.03 | |
| Week Change: 23.9157% Year-to-date Change: -38.1% | |
| SGMO Links: Profile News Message Board | |
| Charts:- Daily , Weekly | |
| Add SGMO to Watchlist: View: Get Complete SGMO Trend Analysis ➞ | |
 | XERS Xeris Biopharma Holdings Inc |
| Sector: Health Care | |
| SubSector: Biotechnology | |
| MarketCap: 1267.62 Millions | |
| Recent Price: 8.31 Market Intelligence Score: 90 | |
| Day Percent Change: 3.74532% Day Change: 0.02 | |
| Week Change: 3.875% Year-to-date Change: 140.2% | |
| XERS Links: Profile News Message Board | |
| Charts:- Daily , Weekly | |
| Add XERS to Watchlist: View: Get Complete XERS Trend Analysis ➞ | |
 | SRRA Sierra Oncology, Inc. |
| Sector: Health Care | |
| SubSector: Biotechnology | |
| MarketCap: 125.185 Millions | |
| Recent Price: 14.95 Market Intelligence Score: 30 | |
| Day Percent Change: 3.67545% Day Change: -9999 | |
| Week Change: -72.8132% Year-to-date Change: 0.0% | |
| SRRA Links: Profile News Message Board | |
| Charts:- Daily , Weekly | |
| Add SRRA to Watchlist: View: Get Complete SRRA Trend Analysis ➞ | |
 | AIMT Aimmune Therapeutics, Inc. |
| Sector: Health Care | |
| SubSector: Biotechnology | |
| MarketCap: 903.485 Millions | |
| Recent Price: 150.75 Market Intelligence Score: 70 | |
| Day Percent Change: 3.65812% Day Change: -9999 | |
| Week Change: -12.7352% Year-to-date Change: 0.0% | |
| AIMT Links: Profile News Message Board | |
| Charts:- Daily , Weekly | |
| Add AIMT to Watchlist: View: Get Complete AIMT Trend Analysis ➞ | |
 | TECH Bio-Techne Corp |
| Sector: Health Care | |
| SubSector: Biotechnology | |
| MarketCap: 8463.45 Millions | |
| Recent Price: 62.09 Market Intelligence Score: 100 | |
| Day Percent Change: 3.6215% Day Change: 2.48 | |
| Week Change: 21.2222% Year-to-date Change: -12.9% | |
| TECH Links: Profile News Message Board | |
| Charts:- Daily , Weekly | |
| Add TECH to Watchlist: View: Get Complete TECH Trend Analysis ➞ | |
 | SPRO Spero Therapeutics Inc |
| Sector: Health Care | |
| SubSector: Biotechnology | |
| MarketCap: 120.99 Millions | |
| Recent Price: 2.03 Market Intelligence Score: 60 | |
| Day Percent Change: 3.57143% Day Change: 0.03 | |
| Week Change: 3.04569% Year-to-date Change: 88.0% | |
| SPRO Links: Profile News Message Board | |
| Charts:- Daily , Weekly | |
| Add SPRO to Watchlist: View: Get Complete SPRO Trend Analysis ➞ | |
 | VTYX Ventyx Biosciences Inc |
| Sector: Health Care | |
| SubSector: Biotechnology | |
| MarketCap: 179.7 Millions | |
| Recent Price: 3.53 Market Intelligence Score: 54 | |
| Day Percent Change: 3.52% Day Change: 0.09 | |
| Week Change: -11.67% Year-to-date Change: 21.0% | |
| VTYX Links: Profile News Message Board | |
| Charts:- Daily , Weekly | |
| Add VTYX to Watchlist: View: Get Complete VTYX Trend Analysis ➞ | |
 | GNFT Genfit ADR |
| Sector: Health Care | |
| SubSector: Biotechnology | |
| MarketCap: 196.21 Millions | |
| Recent Price: 3.98 Market Intelligence Score: 60 | |
| Day Percent Change: 3.50649% Day Change: -0.2 | |
| Week Change: -9.07017% Year-to-date Change: 4.0% | |
| GNFT Links: Profile News Message Board | |
| Charts:- Daily , Weekly | |
| Add GNFT to Watchlist: View: Get Complete GNFT Trend Analysis ➞ | |
 | BMEA Biomea Fusion Inc |
| Sector: Health Care | |
| SubSector: Biotechnology | |
| MarketCap: 114.26 Millions | |
| Recent Price: 2.09 Market Intelligence Score: 80 | |
| Day Percent Change: 3.46535% Day Change: 0.01 | |
| Week Change: 5.02513% Year-to-date Change: -43.4% | |
| BMEA Links: Profile News Message Board | |
| Charts:- Daily , Weekly | |
| Add BMEA to Watchlist: View: Get Complete BMEA Trend Analysis ➞ | |
 | PLRX Pliant Therapeutics Inc |
| Sector: Health Care | |
| SubSector: Biotechnology | |
| MarketCap: 114.18 Millions | |
| Recent Price: 1.50 Market Intelligence Score: 50 | |
| Day Percent Change: 3.44828% Day Change: 0.02 | |
| Week Change: 2.73973% Year-to-date Change: -88.7% | |
| PLRX Links: Profile News Message Board | |
| Charts:- Daily , Weekly | |
| Add PLRX to Watchlist: View: Get Complete PLRX Trend Analysis ➞ | |
 | HOOK HOOKIPA Pharma Inc. |
| Sector: Health Care | |
| SubSector: Biotechnology | |
| MarketCap: 294.785 Millions | |
| Recent Price: 0.92 Market Intelligence Score: 70 | |
| Day Percent Change: 3.37079% Day Change: 0 | |
| Week Change: 0.987925% Year-to-date Change: -52.8% | |
| HOOK Links: Profile News Message Board | |
| Charts:- Daily , Weekly | |
| Add HOOK to Watchlist: View: Get Complete HOOK Trend Analysis ➞ | |
 | CMPX Compass Therapeutics Inc |
| Sector: Health Care | |
| SubSector: Biotechnology | |
| MarketCap: 590.21 Millions | |
| Recent Price: 3.47 Market Intelligence Score: 30 | |
| Day Percent Change: 3.27381% Day Change: 0.02 | |
| Week Change: -0.573066% Year-to-date Change: 147.9% | |
| CMPX Links: Profile News Message Board | |
| Charts:- Daily , Weekly | |
| Add CMPX to Watchlist: View: Get Complete CMPX Trend Analysis ➞ | |
 | PDLI PDL BioPharma, Inc. |
| Sector: Health Care | |
| SubSector: Biotechnology | |
| MarketCap: 310.085 Millions | |
| Recent Price: 22.03 Market Intelligence Score: 90 | |
| Day Percent Change: 3.23336% Day Change: -9999 | |
| Week Change: 112.645% Year-to-date Change: 0.0% | |
| PDLI Links: Profile News Message Board | |
| Charts:- Daily , Weekly | |
| Add PDLI to Watchlist: View: Get Complete PDLI Trend Analysis ➞ | |
 | HRTX Heron Therapeutics Inc |
| Sector: Health Care | |
| SubSector: Biotechnology | |
| MarketCap: 200.81 Millions | |
| Recent Price: 1.29 Market Intelligence Score: 60 | |
| Day Percent Change: 3.2% Day Change: 0.02 | |
| Week Change: 3.2% Year-to-date Change: -19.4% | |
| HRTX Links: Profile News Message Board | |
| Charts:- Daily , Weekly | |
| Add HRTX to Watchlist: View: Get Complete HRTX Trend Analysis ➞ | |
 | INBX Inhibrx Biosciences Inc |
| Sector: Health Care | |
| SubSector: Biotechnology | |
| MarketCap: 408.2 Millions | |
| Recent Price: 35.06 Market Intelligence Score: 100 | |
| Day Percent Change: 3.19305% Day Change: -0.25 | |
| Week Change: 18.064% Year-to-date Change: 129.9% | |
| INBX Links: Profile News Message Board | |
| Charts:- Daily , Weekly | |
| Add INBX to Watchlist: View: Get Complete INBX Trend Analysis ➞ | |
 | MCRB Seres Therapeutics Inc |
| Sector: Health Care | |
| SubSector: Biotechnology | |
| MarketCap: 169.49 Millions | |
| Recent Price: 21.15 Market Intelligence Score: 100 | |
| Day Percent Change: 3.17073% Day Change: 0.38 | |
| Week Change: 9.07684% Year-to-date Change: 25.4% | |
| MCRB Links: Profile News Message Board | |
| Charts:- Daily , Weekly | |
| Add MCRB to Watchlist: View: Get Complete MCRB Trend Analysis ➞ | |
 | ARGX Argen X SE ADR |
| Sector: Health Care | |
| SubSector: Biotechnology | |
| MarketCap: 45947.7 Millions | |
| Recent Price: 791.59 Market Intelligence Score: 100 | |
| Day Percent Change: 3.16161% Day Change: 14.32 | |
| Week Change: 8.47265% Year-to-date Change: 27.6% | |
| ARGX Links: Profile News Message Board | |
| Charts:- Daily , Weekly | |
| Add ARGX to Watchlist: View: Get Complete ARGX Trend Analysis ➞ | |
 | ARNA Arena Pharmaceuticals, Inc. |
| Sector: Health Care | |
| SubSector: Biotechnology | |
| MarketCap: 1936.25 Millions | |
| Recent Price: 2.34 Market Intelligence Score: 20 | |
| Day Percent Change: 3.0837% Day Change: -9999 | |
| Week Change: -97.6598% Year-to-date Change: 0.0% | |
| ARNA Links: Profile News Message Board | |
| Charts:- Daily , Weekly | |
| Add ARNA to Watchlist: View: Get Complete ARNA Trend Analysis ➞ | |
 | RARE Ultragenyx Pharmaceutical Inc |
| Sector: Health Care | |
| SubSector: Biotechnology | |
| MarketCap: 3066.55 Millions | |
| Recent Price: 30.91 Market Intelligence Score: 100 | |
| Day Percent Change: 3.06769% Day Change: 0.75 | |
| Week Change: 7.47566% Year-to-date Change: -24.9% | |
| RARE Links: Profile News Message Board | |
| Charts:- Daily , Weekly | |
| Add RARE to Watchlist: View: Get Complete RARE Trend Analysis ➞ | |
 | ANNX Annexon Inc |
| Sector: Health Care | |
| SubSector: Biotechnology | |
| MarketCap: 238.45 Millions | |
| Recent Price: 3.12 Market Intelligence Score: 80 | |
| Day Percent Change: 2.9703% Day Change: 0.03 | |
| Week Change: 10.6383% Year-to-date Change: -43.3% | |
| ANNX Links: Profile News Message Board | |
| Charts:- Daily , Weekly | |
| Add ANNX to Watchlist: View: Get Complete ANNX Trend Analysis ➞ | |
 | SLN Silence Therapeutics Plc ADR |
| Sector: Health Care | |
| SubSector: Biotechnology | |
| MarketCap: 268.74 Millions | |
| Recent Price: 5.25 Market Intelligence Score: 30 | |
| Day Percent Change: 2.94118% Day Change: 0.13 | |
| Week Change: 2.14008% Year-to-date Change: -27.0% | |
| SLN Links: Profile News Message Board | |
| Charts:- Daily , Weekly | |
| Add SLN to Watchlist: View: Get Complete SLN Trend Analysis ➞ | |
 | ACHV Achieve Life Sciences Inc |
| Sector: Health Care | |
| SubSector: Biotechnology | |
| MarketCap: 144.63 Millions | |
| Recent Price: 3.19 Market Intelligence Score: 100 | |
| Day Percent Change: 2.90323% Day Change: 0.31 | |
| Week Change: 3.57143% Year-to-date Change: -13.6% | |
| ACHV Links: Profile News Message Board | |
| Charts:- Daily , Weekly | |
| Add ACHV to Watchlist: View: Get Complete ACHV Trend Analysis ➞ | |
 | TRIL Trillium Therapeutics Inc. |
| Sector: Health Care | |
| SubSector: Biotechnology | |
| MarketCap: 250.885 Millions | |
| Recent Price: 56.00 Market Intelligence Score: 80 | |
| Day Percent Change: 2.88444% Day Change: -9999 | |
| Week Change: 203.688% Year-to-date Change: 0.0% | |
| TRIL Links: Profile News Message Board | |
| Charts:- Daily , Weekly | |
| Add TRIL to Watchlist: View: Get Complete TRIL Trend Analysis ➞ | |
 | NKTR Nektar Therapeutics |
| Sector: Health Care | |
| SubSector: Biotechnology | |
| MarketCap: 764.17 Millions | |
| Recent Price: 60.52 Market Intelligence Score: 90 | |
| Day Percent Change: 2.83772% Day Change: 1.05 | |
| Week Change: 0.314935% Year-to-date Change: 319.8% | |
| NKTR Links: Profile News Message Board | |
| Charts:- Daily , Weekly | |
| Add NKTR to Watchlist: View: Get Complete NKTR Trend Analysis ➞ | |
| To view more stocks, click on Next / Previous arrows or select different range: 0 - 25 , 25 - 50 , 50 - 75 , 75 - 100 , 100 - 125 , 125 - 150 , 150 - 175 , 175 - 200 , 200 - 225 , 225 - 250 , 250 - 275 , 275 - 300 , 300 - 325 , 325 - 350 , 350 - 375 , 375 - 400 , 400 - 425 , 425 - 450 , 450 - 475 | ||
| Click To Change The Sort Order: By Market Cap or Company Size Performance: Year-to-date, Week and Day | |
| Select Chart Type: | ||
|
Best Stocks Today 12Stocks.com |
© 2025 12Stocks.com Terms & Conditions Privacy Contact Us
All Information Provided Only For Education And Not To Be Used For Investing or Trading. See Terms & Conditions


One More Thing ... Get Best Stocks Delivered Daily!
Never Ever Miss A Move With Our Top Ten Stocks Lists
Find Best Stocks In Any Market - Bull or Bear Market
Take A Peek At Our Top Ten Stocks Lists: Daily, Weekly, Year-to-Date & Top Trends
Find Best Stocks In Any Market - Bull or Bear Market
Take A Peek At Our Top Ten Stocks Lists: Daily, Weekly, Year-to-Date & Top Trends
Biotech Stocks With Best Up Trends [0-bearish to 100-bullish]: Taysha Gene[100], DBV Technologies[100], Valneva SE[100], Prime Medicine[100], AlloVir [100], Sarepta [100], Monopar [100], Cara [100], Absci Corp[100], Spruce [100], Cabaletta Bio[100]
Best Biotech Stocks Year-to-Date:
Kaleido [9900%], Vor Biopharma[3175%], Nanobiotix ADR[581.379%], I-Mab ADR[357.506%], Monopar [337.489%], Nektar [319.84%], DBV Technologies[276.923%], Celcuity [276.39%], Galectin [263.248%], Cidara [260.806%], Lineage Cell[233.981%] Best Biotech Stocks This Week:
Athersys [193287%], VBI Vaccines[86898.5%], ContraFect [47677.8%], Clovis Oncology[39610.5%], NanoString Technologies[17224.7%], Neptune Wellness[14100%], Achillion [10033.3%], Kaleido [9900%], Nymox [8258.49%], Epizyme [5739.46%], Portola [4717.55%] Best Biotech Stocks Daily:
Kaleido [9900%], Neoleukin [332.665%], Syros [226.23%], Athenex [103.333%], Taysha Gene[53.4591%], DBV Technologies[21.6485%], Valneva SE[20.197%], Prime Medicine[19.4097%], Aptose [17.5439%], AlloVir [16.9215%], Sarepta [15.6832%]