
 Login Sign Up


| |||||
 |  | ||||

| 12Stocks.com Market Intelligence |
Best Biotech Stocks
|
|
| Quick Read: Best Biotech Stocks List By Performances & Trends: Daily, Weekly, Year-to-Date, Market Cap (Size) & Technical Trends | |||
| Best Biotech Stocks Views: Quick Browse View, Summary & Slide Show View | |||
| 12Stocks.com Biotech Stocks Performances & Trends Daily | |||||||||
|
|  The overall market intelligence score is 80 (0-bearish to 100-bullish) which puts Biotech sector in short term neutral to bullish trend. The market intelligence score from previous trading session is 60 and hence an improvement of trend.
| ||||||||
Here are the market intelligence trend scores of the most requested Biotech stocks at 12Stocks.com (click stock name for detailed review):
|


| 12Stocks.com: Investing in Biotech sector with Stocks | |
|
The following table helps investors and traders sort through current performance and trends (as measured by market intelligence score) of various
stocks in the Biotech sector. Quick View: Move mouse or cursor over stock symbol (ticker) to view short-term Technical chart and over stock name to view long term chart. Click on  to add stock symbol to your watchlist and to add stock symbol to your watchlist and  to view watchlist. Click on any ticker or stock name for detailed market intelligence report for that stock. to view watchlist. Click on any ticker or stock name for detailed market intelligence report for that stock. |
12Stocks.com Performance of Stocks in Biotech Sector
| Ticker | Stock Name | Watchlist | Category | Recent Price | Market Intelligence Score | Change % | YTD Change% |
| NVCT | Nuvectis Pharma |   | Biotechnology | 6.19 | 46 | -3.06 | 17.19% |
| KURA | Kura Oncology | | Biotechnology | 8.09 | 50 | -3.11 | -6.80% |
| OSIR | Osiris | | Biotechnology | 0.62 | 10 | -3.13 | 0.00% |
| ACIU | AC Immune | | Biotechnology | 2.46 | 90 | -3.15 | -13.68% |
| TNYA | Tenaya | | Biotechnology | 1.22 | 80 | -3.17 | -14.08% |
| VOR | Vor Biopharma | | Biotechnology | 1.52 | 0 | -3.18 | 35.71% |
| ADRO | Aduro | | Biotechnology | 73.83 | 0 | -3.29 | 0.00% |
| RNA | Avidity | | Biotechnology | 40.06 | 30 | -3.33 | 28.48% |
| MESO | Mesoblast | | Biotechnology | 15.07 | 50 | -3.40 | -26.88% |
| PROK | ProKidney Corp | | Biotechnology | 2.53 | 70 | -3.44 | 46.24% |
| CRSP | CRISPR | | Biotechnology | 59.07 | 90 | -3.46 | 42.58% |
| IOVA | Iovance Bio | | Biotechnology | 2.22 | 20 | -3.48 | -71.50% |
| ORIC | ORIC | | Biotechnology | 10.52 | 50 | -3.49 | 27.36% |
| CABA | Cabaletta Bio | | Biotechnology | 1.92 | 90 | -3.52 | -17.60% |
| HOOK | HOOKIPA Pharma | | Biotechnology | 0.90 | 60 | -3.53 | -54.07% |
| ARDX | Ardelyx | | Biotechnology | 6.19 | 30 | -3.58 | 20.90% |
| AUTL | Autolus | | Biotechnology | 1.27 | 0 | -3.79 | -51.71% |
| EDIT | Editas Medicine | | Biotechnology | 2.72 | 70 | -3.89 | 107.63% |
| ACHV | Achieve Life | | Biotechnology | 2.96 | 40 | -3.90 | -19.78% |
| MLTX | MoonLake Immuno | | Biotechnology | 51.18 | 30 | -3.91 | -4.46% |
| LQDA | Liquidia Corp | | Biotechnology | 25.00 | 30 | -3.96 | 106.61% |
| PBYI | Puma nology | | Biotechnology | 4.34 | 30 | -3.98 | 39.10% |
| CRMD | CorMedix | | Biotechnology | 11.12 | 10 | -4.06 | 35.28% |
| ABCL | AbCellera Biologics | | Biotechnology | 4.57 | 70 | -4.19 | 50.83% |
| ALLO | Allogene | | Biotechnology | 1.13 | 20 | -4.24 | -48.64% |
| To view more stocks, click on Next / Previous arrows or select different range: 0 - 25 , 25 - 50 , 50 - 75 , 75 - 100 , 100 - 125 , 125 - 150 , 150 - 175 , 175 - 200 , 200 - 225 , 225 - 250 , 250 - 275 , 275 - 300 , 300 - 325 , 325 - 350 , 350 - 375 , 375 - 400 , 400 - 425 , 425 - 450 , 450 - 475 | ||
 | Click To Change The Sort Order: By Market Cap or Company Size Performance: Year-to-date, Week and Day |  |
|
Get the most comprehensive stock market coverage daily at 12Stocks.com ➞ Best Stocks Today ➞ Best Stocks Weekly ➞ Best Stocks Year-to-Date ➞ Best Stocks Trends ➞  Best Stocks Today 12Stocks.com Best Nasdaq Stocks ➞ Best S&P 500 Stocks ➞ Best Tech Stocks ➞ Best Biotech Stocks ➞ |
| Detailed Overview of Biotech Stocks |
| Biotech Technical Overview, Leaders & Laggards, Top Biotech ETF Funds & Detailed Biotech Stocks List, Charts, Trends & More |
| Biotech Sector: Technical Analysis, Trends & YTD Performance | |
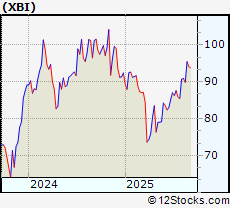
| Biotech sector, as represented by XBI, an exchange-traded fund [ETF] that holds basket of Biotech stocks (e.g, Amgen, Celgene) is up by 4.23268% and is currently underperforming the overall market by -9.35602% year-to-date. Below is a quick view of Technical charts and trends: | |
 XBI Weekly Chart |
|
| Long Term Trend: Very Good | |
| Medium Term Trend: Very Good | |
 XBI Daily Chart |
|
| Short Term Trend: Very Good | |
| Overall Trend Score: 80 | |
| YTD Performance: 4.23268% | |
| **Trend Scores & Views Are Only For Educational Purposes And Not For Investing | |
| 12Stocks.com: Top Performing Biotech Sector Stocks | ||||||||||||||||||||||||||||||||||||||||||||||
 The top performing Biotech sector stocks year to date are
Now, more recently, over last week, the top performing Biotech sector stocks on the move are


|
||||||||||||||||||||||||||||||||||||||||||||||
| 12Stocks.com: Investing in Biotech Sector using Exchange Traded Funds | |
|
The following table shows list of key exchange traded funds (ETF) that
help investors track Biotech Index. For detailed view, check out our ETF Funds section of our website. Quick View: Move mouse or cursor over ETF symbol (ticker) to view short-term Technical chart and over ETF name to view long term chart. Click on ticker or stock name for detailed view. Click on to add stock symbol to your watchlist and to view watchlist. |
12Stocks.com List of ETFs that track Biotech Index
| Ticker | ETF Name | Watchlist | Recent Price | Market Intelligence Score | Change % | Week % | Year-to-date % |
| UBIO | Biotechnology | | 73.34 | 80 | -0.0681292 | 260.748 | 0% |
| HCRF | Edge Multifactor | | 67.14 | 23 | 0 | 9999 | NA |
| SICK | Healthcare Bear 3X | | 37.90 | 36 | 0 | 9999 | NA |
| LABS | Biotech Bear 1X | | 24.18 | 56 | 0 | 9999 | NA |
| BTEC | Principal Healthcare Innovators | | 39.49 | 30 | 0 | 1.02328 | 0% |
| 12Stocks.com: Charts, Trends, Fundamental Data and Performances of Biotech Stocks | |
|
We now take in-depth look at all Biotech stocks including charts, multi-period performances and overall trends (as measured by market intelligence score). One can sort Biotech stocks (click link to choose) by Daily, Weekly and by Year-to-Date performances. Also, one can sort by size of the company or by market capitalization. |
| Select Your Default Chart Type: | |||||
| |||||
| Click on stock symbol or name for detailed view. Click on to add stock symbol to your watchlist and to view watchlist. Quick View: Move mouse or cursor over "Daily" to quickly view daily Technical stock chart and over "Weekly" to view weekly Technical stock chart. | |||||

 | NVCT Nuvectis Pharma Inc |
| Sector: Health Care | |
| SubSector: Biotechnology | |
| MarketCap: 170.05 Millions | |
| Recent Price: 6.19 Market Intelligence Score: 46 | |
| Day Percent Change: -3.06% Day Change: -0.2 | |
| Week Change: -1.4% Year-to-date Change: 17.2% | |
| NVCT Links: Profile News Message Board | |
| Charts:- Daily , Weekly | |
| Add NVCT to Watchlist: View: Get Complete NVCT Trend Analysis ➞ | |
 | KURA Kura Oncology Inc |
| Sector: Health Care | |
| SubSector: Biotechnology | |
| MarketCap: 713.47 Millions | |
| Recent Price: 8.09 Market Intelligence Score: 50 | |
| Day Percent Change: -3.11377% Day Change: 0.39 | |
| Week Change: 0.998752% Year-to-date Change: -6.8% | |
| KURA Links: Profile News Message Board | |
| Charts:- Daily , Weekly | |
| Add KURA to Watchlist: View: Get Complete KURA Trend Analysis ➞ | |
 | OSIR Osiris Therapeutics, Inc. |
| Sector: Health Care | |
| SubSector: Biotechnology | |
| MarketCap: 103.36 Millions | |
| Recent Price: 0.62 Market Intelligence Score: 10 | |
| Day Percent Change: -3.125% Day Change: -9999 | |
| Week Change: -47.8992% Year-to-date Change: 0.0% | |
| OSIR Links: Profile News Message Board | |
| Charts:- Daily , Weekly | |
| Add OSIR to Watchlist: View: Get Complete OSIR Trend Analysis ➞ | |
 | ACIU AC Immune SA |
| Sector: Health Care | |
| SubSector: Biotechnology | |
| MarketCap: 225.59 Millions | |
| Recent Price: 2.46 Market Intelligence Score: 90 | |
| Day Percent Change: -3.14961% Day Change: -0.04 | |
| Week Change: 11.8182% Year-to-date Change: -13.7% | |
| ACIU Links: Profile News Message Board | |
| Charts:- Daily , Weekly | |
| Add ACIU to Watchlist: View: Get Complete ACIU Trend Analysis ➞ | |
 | TNYA Tenaya Therapeutics Inc |
| Sector: Health Care | |
| SubSector: Biotechnology | |
| MarketCap: 220.02 Millions | |
| Recent Price: 1.22 Market Intelligence Score: 80 | |
| Day Percent Change: -3.1746% Day Change: -0.08 | |
| Week Change: -6.15385% Year-to-date Change: -14.1% | |
| TNYA Links: Profile News Message Board | |
| Charts:- Daily , Weekly | |
| Add TNYA to Watchlist: View: Get Complete TNYA Trend Analysis ➞ | |
 | VOR Vor Biopharma Inc |
| Sector: Health Care | |
| SubSector: Biotechnology | |
| MarketCap: 248.3 Millions | |
| Recent Price: 1.52 Market Intelligence Score: 0 | |
| Day Percent Change: -3.18471% Day Change: -0.03 | |
| Week Change: -24.3781% Year-to-date Change: 35.7% | |
| VOR Links: Profile News Message Board | |
| Charts:- Daily , Weekly | |
| Add VOR to Watchlist: View: Get Complete VOR Trend Analysis ➞ | |
 | ADRO Aduro BioTech, Inc. |
| Sector: Health Care | |
| SubSector: Biotechnology | |
| MarketCap: 195.285 Millions | |
| Recent Price: 73.83 Market Intelligence Score: 0 | |
| Day Percent Change: -3.28792% Day Change: -9999 | |
| Week Change: -21.424% Year-to-date Change: 0.0% | |
| ADRO Links: Profile News Message Board | |
| Charts:- Daily , Weekly | |
| Add ADRO to Watchlist: View: Get Complete ADRO Trend Analysis ➞ | |
 | RNA Avidity Biosciences Inc |
| Sector: Health Care | |
| SubSector: Biotechnology | |
| MarketCap: 6478.98 Millions | |
| Recent Price: 40.06 Market Intelligence Score: 30 | |
| Day Percent Change: -3.33012% Day Change: 0.32 | |
| Week Change: -14.0712% Year-to-date Change: 28.5% | |
| RNA Links: Profile News Message Board | |
| Charts:- Daily , Weekly | |
| Add RNA to Watchlist: View: Get Complete RNA Trend Analysis ➞ | |
 | MESO Mesoblast Ltd ADR |
| Sector: Health Care | |
| SubSector: Biotechnology | |
| MarketCap: 1839.62 Millions | |
| Recent Price: 15.07 Market Intelligence Score: 50 | |
| Day Percent Change: -3.39744% Day Change: 0.16 | |
| Week Change: 0.466667% Year-to-date Change: -26.9% | |
| MESO Links: Profile News Message Board | |
| Charts:- Daily , Weekly | |
| Add MESO to Watchlist: View: Get Complete MESO Trend Analysis ➞ | |
 | PROK ProKidney Corp |
| Sector: Health Care | |
| SubSector: Biotechnology | |
| MarketCap: 662.14 Millions | |
| Recent Price: 2.53 Market Intelligence Score: 70 | |
| Day Percent Change: -3.43511% Day Change: 0.04 | |
| Week Change: 14.4796% Year-to-date Change: 46.2% | |
| PROK Links: Profile News Message Board | |
| Charts:- Daily , Weekly | |
| Add PROK to Watchlist: View: Get Complete PROK Trend Analysis ➞ | |
 | CRSP CRISPR Therapeutics AG |
| Sector: Health Care | |
| SubSector: Biotechnology | |
| MarketCap: 4989.54 Millions | |
| Recent Price: 59.07 Market Intelligence Score: 90 | |
| Day Percent Change: -3.46462% Day Change: -0.25 | |
| Week Change: 10.0205% Year-to-date Change: 42.6% | |
| CRSP Links: Profile News Message Board | |
| Charts:- Daily , Weekly | |
| Add CRSP to Watchlist: View: Get Complete CRSP Trend Analysis ➞ | |
 | IOVA Iovance Biotherapeutics Inc |
| Sector: Health Care | |
| SubSector: Biotechnology | |
| MarketCap: 901.02 Millions | |
| Recent Price: 2.22 Market Intelligence Score: 20 | |
| Day Percent Change: -3.47826% Day Change: 0.01 | |
| Week Change: -6.32911% Year-to-date Change: -71.5% | |
| IOVA Links: Profile News Message Board | |
| Charts:- Daily , Weekly | |
| Add IOVA to Watchlist: View: Get Complete IOVA Trend Analysis ➞ | |
 | ORIC ORIC Pharmaceuticals Inc |
| Sector: Health Care | |
| SubSector: Biotechnology | |
| MarketCap: 1056.7 Millions | |
| Recent Price: 10.52 Market Intelligence Score: 50 | |
| Day Percent Change: -3.48624% Day Change: 0.18 | |
| Week Change: -3.5747% Year-to-date Change: 27.4% | |
| ORIC Links: Profile News Message Board | |
| Charts:- Daily , Weekly | |
| Add ORIC to Watchlist: View: Get Complete ORIC Trend Analysis ➞ | |
 | CABA Cabaletta Bio Inc |
| Sector: Health Care | |
| SubSector: Biotechnology | |
| MarketCap: 155.49 Millions | |
| Recent Price: 1.92 Market Intelligence Score: 90 | |
| Day Percent Change: -3.51759% Day Change: 0.02 | |
| Week Change: 17.0732% Year-to-date Change: -17.6% | |
| CABA Links: Profile News Message Board | |
| Charts:- Daily , Weekly | |
| Add CABA to Watchlist: View: Get Complete CABA Trend Analysis ➞ | |
 | HOOK HOOKIPA Pharma Inc. |
| Sector: Health Care | |
| SubSector: Biotechnology | |
| MarketCap: 294.785 Millions | |
| Recent Price: 0.90 Market Intelligence Score: 60 | |
| Day Percent Change: -3.53296% Day Change: 0 | |
| Week Change: -5.67667% Year-to-date Change: -54.1% | |
| HOOK Links: Profile News Message Board | |
| Charts:- Daily , Weekly | |
| Add HOOK to Watchlist: View: Get Complete HOOK Trend Analysis ➞ | |
 | ARDX Ardelyx Inc |
| Sector: Health Care | |
| SubSector: Biotechnology | |
| MarketCap: 1571.21 Millions | |
| Recent Price: 6.19 Market Intelligence Score: 30 | |
| Day Percent Change: -3.58255% Day Change: 0.12 | |
| Week Change: -5.64024% Year-to-date Change: 20.9% | |
| ARDX Links: Profile News Message Board | |
| Charts:- Daily , Weekly | |
| Add ARDX to Watchlist: View: Get Complete ARDX Trend Analysis ➞ | |
 | AUTL Autolus Therapeutics plc ADR |
| Sector: Health Care | |
| SubSector: Biotechnology | |
| MarketCap: 388.56 Millions | |
| Recent Price: 1.27 Market Intelligence Score: 0 | |
| Day Percent Change: -3.78788% Day Change: 0.02 | |
| Week Change: -7.29927% Year-to-date Change: -51.7% | |
| AUTL Links: Profile News Message Board | |
| Charts:- Daily , Weekly | |
| Add AUTL to Watchlist: View: Get Complete AUTL Trend Analysis ➞ | |
 | EDIT Editas Medicine Inc |
| Sector: Health Care | |
| SubSector: Biotechnology | |
| MarketCap: 248.18 Millions | |
| Recent Price: 2.72 Market Intelligence Score: 70 | |
| Day Percent Change: -3.88693% Day Change: 0.06 | |
| Week Change: -1.44928% Year-to-date Change: 107.6% | |
| EDIT Links: Profile News Message Board | |
| Charts:- Daily , Weekly | |
| Add EDIT to Watchlist: View: Get Complete EDIT Trend Analysis ➞ | |
 | ACHV Achieve Life Sciences Inc |
| Sector: Health Care | |
| SubSector: Biotechnology | |
| MarketCap: 144.63 Millions | |
| Recent Price: 2.96 Market Intelligence Score: 40 | |
| Day Percent Change: -3.8961% Day Change: 0.31 | |
| Week Change: -5.12821% Year-to-date Change: -19.8% | |
| ACHV Links: Profile News Message Board | |
| Charts:- Daily , Weekly | |
| Add ACHV to Watchlist: View: Get Complete ACHV Trend Analysis ➞ | |
 | MLTX MoonLake Immunotherapeutics |
| Sector: Health Care | |
| SubSector: Biotechnology | |
| MarketCap: 3817.87 Millions | |
| Recent Price: 51.18 Market Intelligence Score: 30 | |
| Day Percent Change: -3.90537% Day Change: 0.03 | |
| Week Change: -10.2105% Year-to-date Change: -4.5% | |
| MLTX Links: Profile News Message Board | |
| Charts:- Daily , Weekly | |
| Add MLTX to Watchlist: View: Get Complete MLTX Trend Analysis ➞ | |
 | LQDA Liquidia Corp |
| Sector: Health Care | |
| SubSector: Biotechnology | |
| MarketCap: 2483.74 Millions | |
| Recent Price: 25.00 Market Intelligence Score: 30 | |
| Day Percent Change: -3.95697% Day Change: -0.05 | |
| Week Change: -10.0719% Year-to-date Change: 106.6% | |
| LQDA Links: Profile News Message Board | |
| Charts:- Daily , Weekly | |
| Add LQDA to Watchlist: View: Get Complete LQDA Trend Analysis ➞ | |
 | PBYI Puma Biotechnology Inc |
| Sector: Health Care | |
| SubSector: Biotechnology | |
| MarketCap: 253.36 Millions | |
| Recent Price: 4.34 Market Intelligence Score: 30 | |
| Day Percent Change: -3.9823% Day Change: 0.11 | |
| Week Change: -7.85563% Year-to-date Change: 39.1% | |
| PBYI Links: Profile News Message Board | |
| Charts:- Daily , Weekly | |
| Add PBYI to Watchlist: View: Get Complete PBYI Trend Analysis ➞ | |
 | CRMD CorMedix Inc |
| Sector: Health Care | |
| SubSector: Biotechnology | |
| MarketCap: 925.65 Millions | |
| Recent Price: 11.12 Market Intelligence Score: 10 | |
| Day Percent Change: -4.05522% Day Change: 0.04 | |
| Week Change: -14.6585% Year-to-date Change: 35.3% | |
| CRMD Links: Profile News Message Board | |
| Charts:- Daily , Weekly | |
| Add CRMD to Watchlist: View: Get Complete CRMD Trend Analysis ➞ | |
 | ABCL AbCellera Biologics Inc |
| Sector: Health Care | |
| SubSector: Biotechnology | |
| MarketCap: 1261.07 Millions | |
| Recent Price: 4.57 Market Intelligence Score: 70 | |
| Day Percent Change: -4.19287% Day Change: 0.13 | |
| Week Change: 7.78302% Year-to-date Change: 50.8% | |
| ABCL Links: Profile News Message Board | |
| Charts:- Daily , Weekly | |
| Add ABCL to Watchlist: View: Get Complete ABCL Trend Analysis ➞ | |
 | ALLO Allogene Therapeutics Inc |
| Sector: Health Care | |
| SubSector: Biotechnology | |
| MarketCap: 255.16 Millions | |
| Recent Price: 1.13 Market Intelligence Score: 20 | |
| Day Percent Change: -4.23729% Day Change: 0.06 | |
| Week Change: -0.877193% Year-to-date Change: -48.6% | |
| ALLO Links: Profile News Message Board | |
| Charts:- Daily , Weekly | |
| Add ALLO to Watchlist: View: Get Complete ALLO Trend Analysis ➞ | |
| To view more stocks, click on Next / Previous arrows or select different range: 0 - 25 , 25 - 50 , 50 - 75 , 75 - 100 , 100 - 125 , 125 - 150 , 150 - 175 , 175 - 200 , 200 - 225 , 225 - 250 , 250 - 275 , 275 - 300 , 300 - 325 , 325 - 350 , 350 - 375 , 375 - 400 , 400 - 425 , 425 - 450 , 450 - 475 | ||
| Click To Change The Sort Order: By Market Cap or Company Size Performance: Year-to-date, Week and Day | |
| Select Chart Type: | ||
|
Best Stocks Today 12Stocks.com |
© 2025 12Stocks.com Terms & Conditions Privacy Contact Us
All Information Provided Only For Education And Not To Be Used For Investing or Trading. See Terms & Conditions


One More Thing ... Get Best Stocks Delivered Daily!
Never Ever Miss A Move With Our Top Ten Stocks Lists
Find Best Stocks In Any Market - Bull or Bear Market
Take A Peek At Our Top Ten Stocks Lists: Daily, Weekly, Year-to-Date & Top Trends
Find Best Stocks In Any Market - Bull or Bear Market
Take A Peek At Our Top Ten Stocks Lists: Daily, Weekly, Year-to-Date & Top Trends
Biotech Stocks With Best Up Trends [0-bearish to 100-bullish]: AlloVir [100], Monopar [100], Cara [100], Corbus [100], Ocugen [100], Spruce [100], Roivant [100], Xencor [100], Oncolytics [100], Tango [100], Arcus [100]
Best Biotech Stocks Year-to-Date:
Kaleido [9900%], Celcuity [315.842%], I-Mab ADR[307.285%], Galectin [292.308%], Immuneering Corp[265.158%], Nektar [254.284%], Precigen [253.704%], Nanobiotix ADR[251.814%], Gossamer Bio[208.247%], DBV Technologies[202.769%], Monopar [199.91%] Best Biotech Stocks This Week:
Athersys [193287%], VBI Vaccines[86898.5%], ContraFect [47677.8%], Clovis Oncology[39610.5%], NanoString Technologies[17224.7%], Neptune Wellness[14100%], Achillion [10033.3%], Kaleido [9900%], Nymox [8258.49%], Epizyme [5739.46%], Portola [4717.55%] Best Biotech Stocks Daily:
Kaleido [9900%], Neoleukin [332.665%], Syros [226.23%], Athenex [103.333%], Aptose [17.5439%], AlloVir [16.9215%], Monopar [16.9123%], Cara [14.3396%], Tyra [14.26%], Zura Bio[13.71%], Corbus [13.1451%]