
 Login Sign Up


| |||||
 |  | ||||

| 12Stocks.com Market Intelligence |
Best Biotech Stocks
|
|
| Quick Read: Best Biotech Stocks List By Performances & Trends: Daily, Weekly, Year-to-Date, Market Cap (Size) & Technical Trends | |||
| Best Biotech Stocks Views: Quick Browse View, Summary & Slide Show View | |||
| 12Stocks.com Biotech Stocks Performances & Trends Daily | |||||||||
|
|  The overall market intelligence score is 100 (0-bearish to 100-bullish) which puts Biotech sector in short term bullish trend. The market intelligence score from previous trading session is 90 and an improvement of trend continues.
| ||||||||
Here are the market intelligence trend scores of the most requested Biotech stocks at 12Stocks.com (click stock name for detailed review):
|


| 12Stocks.com: Investing in Biotech sector with Stocks | |
|
The following table helps investors and traders sort through current performance and trends (as measured by market intelligence score) of various
stocks in the Biotech sector. Quick View: Move mouse or cursor over stock symbol (ticker) to view short-term Technical chart and over stock name to view long term chart. Click on  to add stock symbol to your watchlist and to add stock symbol to your watchlist and  to view watchlist. Click on any ticker or stock name for detailed market intelligence report for that stock. to view watchlist. Click on any ticker or stock name for detailed market intelligence report for that stock. |
12Stocks.com Performance of Stocks in Biotech Sector
| Ticker | Stock Name | Watchlist | Category | Recent Price | Market Intelligence Score | Change % | Weekly Change% |
| AGEN | Agenus |   | Biotechnology | 3.94 | 20 | 1.03% | -7.73% |
| FHTX | Foghorn | | Biotechnology | 4.53 | 0 | -8.11% | -7.74% |
| SLDB | Solid | | Biotechnology | 5.73 | 20 | -2.39% | -8.17% |
| IPHA | Innate Pharma | | Biotechnology | 1.78 | 10 | -2.20% | -8.25% |
| CELC | Celcuity | | Biotechnology | 49.42 | 30 | 9.29% | -8.45% |
| CCCC | C4 | | Biotechnology | 2.21 | 40 | 2.79% | -8.68% |
| SGEN | Seattle Genetics | | Biotechnology | 202.14 | 30 | 1.63% | -8.78% |
| OBSV | ObsEva SA | | Biotechnology | 0.08 | 20 | 1.20% | -8.79% |
| GNFT | Genfit ADR | | Biotechnology | 3.98 | 60 | 3.51% | -9.07% |
| KALV | KalVista | | Biotechnology | 11.75 | 10 | -2.49% | -9.13% |
| EWTX | Edgewise | | Biotechnology | 15.00 | 50 | -2.85% | -9.58% |
| SLNO | Soleno | | Biotechnology | 57.98 | 30 | -3.56% | -10.11% |
| GALT | Galectin | | Biotechnology | 4.25 | 50 | 1.67% | -10.53% |
| VTYX | Ventyx | | Biotechnology | 3.53 | 54 | 3.52% | -11.67% |
| OCUL | Ocular Therapeutix | | Biotechnology | 11.06 | 0 | 0.18% | -11.94% |
| AUPH | Aurinia | | Biotechnology | 11.26 | 40 | -1.23% | -12.58% |
| LBIO | Lion nologies | | Biotechnology | 38.34 | 30 | 0.08% | -12.65% |
| AIMT | Aimmune | | Biotechnology | 150.75 | 70 | 3.66% | -12.74% |
| BFRA | Biofrontera AG | | Biotechnology | 1.94 | 10 | -5.37% | -12.81% |
| KOD | Kodiak | | Biotechnology | 13.43 | 50 | -14.82% | -13.33% |
| PGEN | Precigen | | Biotechnology | 3.33 | 30 | -0.30% | -13.73% |
| REPH | Recro Pharma | | Biotechnology | 0.79 | 10 | 1.28% | -14.50% |
| ARDX | Ardelyx | | Biotechnology | 5.25 | 20 | -2.05% | -14.63% |
| GOSS | Gossamer Bio | | Biotechnology | 2.48 | 20 | -0.40% | -17.06% |
| AST | Asterias Bio | | Biotechnology | 14.23 | 40 | 0.49% | -19.60% |
| To view more stocks, click on Next / Previous arrows or select different range: 0 - 25 , 25 - 50 , 50 - 75 , 75 - 100 , 100 - 125 , 125 - 150 , 150 - 175 , 175 - 200 , 200 - 225 , 225 - 250 , 250 - 275 , 275 - 300 , 300 - 325 , 325 - 350 , 350 - 375 , 375 - 400 , 400 - 425 , 425 - 450 , 450 - 475 | ||
 | Click To Change The Sort Order: By Market Cap or Company Size Performance: Year-to-date, Week and Day |  |
|
Get the most comprehensive stock market coverage daily at 12Stocks.com ➞ Best Stocks Today ➞ Best Stocks Weekly ➞ Best Stocks Year-to-Date ➞ Best Stocks Trends ➞  Best Stocks Today 12Stocks.com Best Nasdaq Stocks ➞ Best S&P 500 Stocks ➞ Best Tech Stocks ➞ Best Biotech Stocks ➞ |
| Detailed Overview of Biotech Stocks |
| Biotech Technical Overview, Leaders & Laggards, Top Biotech ETF Funds & Detailed Biotech Stocks List, Charts, Trends & More |
| Biotech Sector: Technical Analysis, Trends & YTD Performance | |
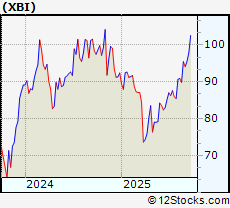
| Biotech sector, as represented by XBI, an exchange-traded fund [ETF] that holds basket of Biotech stocks (e.g, Amgen, Celgene) is up by 12.1001% and is currently underperforming the overall market by -2.6578% year-to-date. Below is a quick view of Technical charts and trends: | |
 XBI Weekly Chart |
|
| Long Term Trend: Very Good | |
| Medium Term Trend: Very Good | |
 XBI Daily Chart |
|
| Short Term Trend: Very Good | |
| Overall Trend Score: 100 | |
| YTD Performance: 12.1001% | |
| **Trend Scores & Views Are Only For Educational Purposes And Not For Investing | |
| 12Stocks.com: Top Performing Biotech Sector Stocks | ||||||||||||||||||||||||||||||||||||||||||||||
 The top performing Biotech sector stocks year to date are
Now, more recently, over last week, the top performing Biotech sector stocks on the move are


|
||||||||||||||||||||||||||||||||||||||||||||||
| 12Stocks.com: Investing in Biotech Sector using Exchange Traded Funds | |
|
The following table shows list of key exchange traded funds (ETF) that
help investors track Biotech Index. For detailed view, check out our ETF Funds section of our website. Quick View: Move mouse or cursor over ETF symbol (ticker) to view short-term Technical chart and over ETF name to view long term chart. Click on ticker or stock name for detailed view. Click on to add stock symbol to your watchlist and to view watchlist. |
12Stocks.com List of ETFs that track Biotech Index
| Ticker | ETF Name | Watchlist | Recent Price | Market Intelligence Score | Change % | Week % | Year-to-date % |
| UBIO | Biotechnology | | 73.34 | 80 | -0.0681292 | 260.748 | 0% |
| HCRF | Edge Multifactor | | 67.14 | 23 | 0 | 9999 | NA |
| SICK | Healthcare Bear 3X | | 37.90 | 36 | 0 | 9999 | NA |
| LABS | Biotech Bear 1X | | 24.18 | 56 | 0 | 9999 | NA |
| BTEC | Principal Healthcare Innovators | | 39.49 | 30 | 0 | 1.02328 | 0% |
| 12Stocks.com: Charts, Trends, Fundamental Data and Performances of Biotech Stocks | |
|
We now take in-depth look at all Biotech stocks including charts, multi-period performances and overall trends (as measured by market intelligence score). One can sort Biotech stocks (click link to choose) by Daily, Weekly and by Year-to-Date performances. Also, one can sort by size of the company or by market capitalization. |
| Select Your Default Chart Type: | |||||
| |||||
| Click on stock symbol or name for detailed view. Click on to add stock symbol to your watchlist and to view watchlist. Quick View: Move mouse or cursor over "Daily" to quickly view daily Technical stock chart and over "Weekly" to view weekly Technical stock chart. | |||||

 | AGEN Agenus Inc |
| Sector: Health Care | |
| SubSector: Biotechnology | |
| MarketCap: 137.97 Millions | |
| Recent Price: 3.94 Market Intelligence Score: 20 | |
| Day Percent Change: 1.02564% Day Change: 0.06 | |
| Week Change: -7.72834% Year-to-date Change: 27.5% | |
| AGEN Links: Profile News Message Board | |
| Charts:- Daily , Weekly | |
| Add AGEN to Watchlist: View: Get Complete AGEN Trend Analysis ➞ | |
 | FHTX Foghorn Therapeutics Inc |
| Sector: Health Care | |
| SubSector: Biotechnology | |
| MarketCap: 326.18 Millions | |
| Recent Price: 4.53 Market Intelligence Score: 0 | |
| Day Percent Change: -8.11359% Day Change: -0.22 | |
| Week Change: -7.73931% Year-to-date Change: -1.3% | |
| FHTX Links: Profile News Message Board | |
| Charts:- Daily , Weekly | |
| Add FHTX to Watchlist: View: Get Complete FHTX Trend Analysis ➞ | |
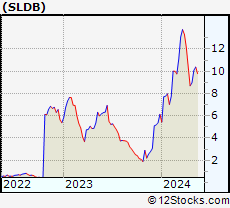 | SLDB Solid Biosciences Inc |
| Sector: Health Care | |
| SubSector: Biotechnology | |
| MarketCap: 428.28 Millions | |
| Recent Price: 5.73 Market Intelligence Score: 20 | |
| Day Percent Change: -2.38501% Day Change: 0 | |
| Week Change: -8.17308% Year-to-date Change: 46.9% | |
| SLDB Links: Profile News Message Board | |
| Charts:- Daily , Weekly | |
| Add SLDB to Watchlist: View: Get Complete SLDB Trend Analysis ➞ | |
 | IPHA Innate Pharma ADR |
| Sector: Health Care | |
| SubSector: Biotechnology | |
| MarketCap: 188.92 Millions | |
| Recent Price: 1.78 Market Intelligence Score: 10 | |
| Day Percent Change: -2.1978% Day Change: 0 | |
| Week Change: -8.24742% Year-to-date Change: -4.8% | |
| IPHA Links: Profile News Message Board | |
| Charts:- Daily , Weekly | |
| Add IPHA to Watchlist: View: Get Complete IPHA Trend Analysis ➞ | |
 | CELC Celcuity Inc |
| Sector: Health Care | |
| SubSector: Biotechnology | |
| MarketCap: 2362.53 Millions | |
| Recent Price: 49.42 Market Intelligence Score: 30 | |
| Day Percent Change: 9.28793% Day Change: 1.61 | |
| Week Change: -8.44757% Year-to-date Change: 276.4% | |
| CELC Links: Profile News Message Board | |
| Charts:- Daily , Weekly | |
| Add CELC to Watchlist: View: Get Complete CELC Trend Analysis ➞ | |
 | CCCC C4 Therapeutics Inc |
| Sector: Health Care | |
| SubSector: Biotechnology | |
| MarketCap: 193.58 Millions | |
| Recent Price: 2.21 Market Intelligence Score: 40 | |
| Day Percent Change: 2.7907% Day Change: 0.01 | |
| Week Change: -8.67769% Year-to-date Change: -39.6% | |
| CCCC Links: Profile News Message Board | |
| Charts:- Daily , Weekly | |
| Add CCCC to Watchlist: View: Get Complete CCCC Trend Analysis ➞ | |
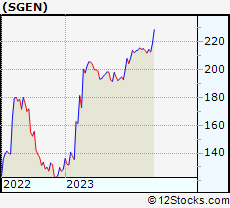 | SGEN Seattle Genetics, Inc. |
| Sector: Health Care | |
| SubSector: Biotechnology | |
| MarketCap: 18532 Millions | |
| Recent Price: 202.14 Market Intelligence Score: 30 | |
| Day Percent Change: 1.63407% Day Change: -9999 | |
| Week Change: -8.78159% Year-to-date Change: 0.0% | |
| SGEN Links: Profile News Message Board | |
| Charts:- Daily , Weekly | |
| Add SGEN to Watchlist: View: Get Complete SGEN Trend Analysis ➞ | |
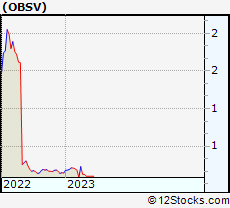 | OBSV ObsEva SA |
| Sector: Health Care | |
| SubSector: Biotechnology | |
| MarketCap: 123.585 Millions | |
| Recent Price: 0.08 Market Intelligence Score: 20 | |
| Day Percent Change: 1.20482% Day Change: -9999 | |
| Week Change: -8.79479% Year-to-date Change: 0.0% | |
| OBSV Links: Profile News Message Board | |
| Charts:- Daily , Weekly | |
| Add OBSV to Watchlist: View: Get Complete OBSV Trend Analysis ➞ | |
 | GNFT Genfit ADR |
| Sector: Health Care | |
| SubSector: Biotechnology | |
| MarketCap: 196.21 Millions | |
| Recent Price: 3.98 Market Intelligence Score: 60 | |
| Day Percent Change: 3.50649% Day Change: -0.2 | |
| Week Change: -9.07017% Year-to-date Change: 4.0% | |
| GNFT Links: Profile News Message Board | |
| Charts:- Daily , Weekly | |
| Add GNFT to Watchlist: View: Get Complete GNFT Trend Analysis ➞ | |
 | KALV KalVista Pharmaceuticals Inc |
| Sector: Health Care | |
| SubSector: Biotechnology | |
| MarketCap: 790.27 Millions | |
| Recent Price: 11.75 Market Intelligence Score: 10 | |
| Day Percent Change: -2.48963% Day Change: 0.05 | |
| Week Change: -9.12606% Year-to-date Change: 32.6% | |
| KALV Links: Profile News Message Board | |
| Charts:- Daily , Weekly | |
| Add KALV to Watchlist: View: Get Complete KALV Trend Analysis ➞ | |
 | EWTX Edgewise Therapeutics Inc |
| Sector: Health Care | |
| SubSector: Biotechnology | |
| MarketCap: 1640.23 Millions | |
| Recent Price: 15.00 Market Intelligence Score: 50 | |
| Day Percent Change: -2.84974% Day Change: 0.78 | |
| Week Change: -9.58409% Year-to-date Change: -44.5% | |
| EWTX Links: Profile News Message Board | |
| Charts:- Daily , Weekly | |
| Add EWTX to Watchlist: View: Get Complete EWTX Trend Analysis ➞ | |
 | SLNO Soleno Therapeutics Inc |
| Sector: Health Care | |
| SubSector: Biotechnology | |
| MarketCap: 3707.93 Millions | |
| Recent Price: 57.98 Market Intelligence Score: 30 | |
| Day Percent Change: -3.55955% Day Change: 0.86 | |
| Week Change: -10.1085% Year-to-date Change: 26.8% | |
| SLNO Links: Profile News Message Board | |
| Charts:- Daily , Weekly | |
| Add SLNO to Watchlist: View: Get Complete SLNO Trend Analysis ➞ | |
 | GALT Galectin Therapeutics Inc |
| Sector: Health Care | |
| SubSector: Biotechnology | |
| MarketCap: 294.68 Millions | |
| Recent Price: 4.25 Market Intelligence Score: 50 | |
| Day Percent Change: 1.67464% Day Change: -0.02 | |
| Week Change: -10.5263% Year-to-date Change: 263.2% | |
| GALT Links: Profile News Message Board | |
| Charts:- Daily , Weekly | |
| Add GALT to Watchlist: View: Get Complete GALT Trend Analysis ➞ | |
 | VTYX Ventyx Biosciences Inc |
| Sector: Health Care | |
| SubSector: Biotechnology | |
| MarketCap: 179.7 Millions | |
| Recent Price: 3.53 Market Intelligence Score: 54 | |
| Day Percent Change: 3.52% Day Change: 0.09 | |
| Week Change: -11.67% Year-to-date Change: 21.0% | |
| VTYX Links: Profile News Message Board | |
| Charts:- Daily , Weekly | |
| Add VTYX to Watchlist: View: Get Complete VTYX Trend Analysis ➞ | |
 | OCUL Ocular Therapeutix Inc |
| Sector: Health Care | |
| SubSector: Biotechnology | |
| MarketCap: 2366.34 Millions | |
| Recent Price: 11.06 Market Intelligence Score: 0 | |
| Day Percent Change: 0.181159% Day Change: 0.17 | |
| Week Change: -11.9427% Year-to-date Change: 26.5% | |
| OCUL Links: Profile News Message Board | |
| Charts:- Daily , Weekly | |
| Add OCUL to Watchlist: View: Get Complete OCUL Trend Analysis ➞ | |
 | AUPH Aurinia Pharmaceuticals Inc |
| Sector: Health Care | |
| SubSector: Biotechnology | |
| MarketCap: 1632.21 Millions | |
| Recent Price: 11.26 Market Intelligence Score: 40 | |
| Day Percent Change: -1.22807% Day Change: 0.07 | |
| Week Change: -12.5776% Year-to-date Change: 28.4% | |
| AUPH Links: Profile News Message Board | |
| Charts:- Daily , Weekly | |
| Add AUPH to Watchlist: View: Get Complete AUPH Trend Analysis ➞ | |
 | LBIO Lion Biotechnologies, Inc. |
| Sector: Health Care | |
| SubSector: Biotechnology | |
| MarketCap: 471.93 Millions | |
| Recent Price: 38.34 Market Intelligence Score: 30 | |
| Day Percent Change: 0.0783085% Day Change: -9999 | |
| Week Change: -12.6452% Year-to-date Change: 0.0% | |
| LBIO Links: Profile News Message Board | |
| Charts:- Daily , Weekly | |
| Add LBIO to Watchlist: View: Get Complete LBIO Trend Analysis ➞ | |
 | AIMT Aimmune Therapeutics, Inc. |
| Sector: Health Care | |
| SubSector: Biotechnology | |
| MarketCap: 903.485 Millions | |
| Recent Price: 150.75 Market Intelligence Score: 70 | |
| Day Percent Change: 3.65812% Day Change: -9999 | |
| Week Change: -12.7352% Year-to-date Change: 0.0% | |
| AIMT Links: Profile News Message Board | |
| Charts:- Daily , Weekly | |
| Add AIMT to Watchlist: View: Get Complete AIMT Trend Analysis ➞ | |
 | BFRA Biofrontera AG |
| Sector: Health Care | |
| SubSector: Biotechnology | |
| MarketCap: 166.685 Millions | |
| Recent Price: 1.94 Market Intelligence Score: 10 | |
| Day Percent Change: -5.36585% Day Change: -9999 | |
| Week Change: -12.809% Year-to-date Change: 0.0% | |
| BFRA Links: Profile News Message Board | |
| Charts:- Daily , Weekly | |
| Add BFRA to Watchlist: View: Get Complete BFRA Trend Analysis ➞ | |
 | KOD Kodiak Sciences Inc |
| Sector: Health Care | |
| SubSector: Biotechnology | |
| MarketCap: 555.68 Millions | |
| Recent Price: 13.43 Market Intelligence Score: 50 | |
| Day Percent Change: -14.816% Day Change: 0.21 | |
| Week Change: -13.3312% Year-to-date Change: 55.7% | |
| KOD Links: Profile News Message Board | |
| Charts:- Daily , Weekly | |
| Add KOD to Watchlist: View: Get Complete KOD Trend Analysis ➞ | |
 | PGEN Precigen Inc |
| Sector: Health Care | |
| SubSector: Biotechnology | |
| MarketCap: 1299.16 Millions | |
| Recent Price: 3.33 Market Intelligence Score: 30 | |
| Day Percent Change: -0.299401% Day Change: 0.43 | |
| Week Change: -13.7306% Year-to-date Change: 208.3% | |
| PGEN Links: Profile News Message Board | |
| Charts:- Daily , Weekly | |
| Add PGEN to Watchlist: View: Get Complete PGEN Trend Analysis ➞ | |
 | REPH Recro Pharma, Inc. |
| Sector: Health Care | |
| SubSector: Biotechnology | |
| MarketCap: 188.985 Millions | |
| Recent Price: 0.79 Market Intelligence Score: 10 | |
| Day Percent Change: 1.28205% Day Change: -9999 | |
| Week Change: -14.5022% Year-to-date Change: 0.0% | |
| REPH Links: Profile News Message Board | |
| Charts:- Daily , Weekly | |
| Add REPH to Watchlist: View: Get Complete REPH Trend Analysis ➞ | |
 | ARDX Ardelyx Inc |
| Sector: Health Care | |
| SubSector: Biotechnology | |
| MarketCap: 1571.21 Millions | |
| Recent Price: 5.25 Market Intelligence Score: 20 | |
| Day Percent Change: -2.05224% Day Change: 0.12 | |
| Week Change: -14.6341% Year-to-date Change: 2.5% | |
| ARDX Links: Profile News Message Board | |
| Charts:- Daily , Weekly | |
| Add ARDX to Watchlist: View: Get Complete ARDX Trend Analysis ➞ | |
 | GOSS Gossamer Bio Inc |
| Sector: Health Care | |
| SubSector: Biotechnology | |
| MarketCap: 668.5 Millions | |
| Recent Price: 2.48 Market Intelligence Score: 20 | |
| Day Percent Change: -0.401606% Day Change: 0.22 | |
| Week Change: -17.0569% Year-to-date Change: 155.7% | |
| GOSS Links: Profile News Message Board | |
| Charts:- Daily , Weekly | |
| Add GOSS to Watchlist: View: Get Complete GOSS Trend Analysis ➞ | |
 | AST Asterias Biotherapeutics, Inc. |
| Sector: Health Care | |
| SubSector: Biotechnology | |
| MarketCap: 148.51 Millions | |
| Recent Price: 14.23 Market Intelligence Score: 40 | |
| Day Percent Change: 0.49435% Day Change: -9999 | |
| Week Change: -19.6045% Year-to-date Change: 0.0% | |
| AST Links: Profile News Message Board | |
| Charts:- Daily , Weekly | |
| Add AST to Watchlist: View: Get Complete AST Trend Analysis ➞ | |
| To view more stocks, click on Next / Previous arrows or select different range: 0 - 25 , 25 - 50 , 50 - 75 , 75 - 100 , 100 - 125 , 125 - 150 , 150 - 175 , 175 - 200 , 200 - 225 , 225 - 250 , 250 - 275 , 275 - 300 , 300 - 325 , 325 - 350 , 350 - 375 , 375 - 400 , 400 - 425 , 425 - 450 , 450 - 475 | ||
| Click To Change The Sort Order: By Market Cap or Company Size Performance: Year-to-date, Week and Day | |
| Select Chart Type: | ||
|
Best Stocks Today 12Stocks.com |
© 2025 12Stocks.com Terms & Conditions Privacy Contact Us
All Information Provided Only For Education And Not To Be Used For Investing or Trading. See Terms & Conditions


One More Thing ... Get Best Stocks Delivered Daily!
Never Ever Miss A Move With Our Top Ten Stocks Lists
Find Best Stocks In Any Market - Bull or Bear Market
Take A Peek At Our Top Ten Stocks Lists: Daily, Weekly, Year-to-Date & Top Trends
Find Best Stocks In Any Market - Bull or Bear Market
Take A Peek At Our Top Ten Stocks Lists: Daily, Weekly, Year-to-Date & Top Trends
Biotech Stocks With Best Up Trends [0-bearish to 100-bullish]: Taysha Gene[100], DBV Technologies[100], Valneva SE[100], Prime Medicine[100], AlloVir [100], Sarepta [100], Monopar [100], Cara [100], Absci Corp[100], Spruce [100], Cabaletta Bio[100]
Best Biotech Stocks Year-to-Date:
Kaleido [9900%], Vor Biopharma[3175%], Nanobiotix ADR[581.379%], I-Mab ADR[357.506%], Monopar [337.489%], Nektar [319.84%], DBV Technologies[276.923%], Celcuity [276.39%], Galectin [263.248%], Cidara [260.806%], Lineage Cell[233.981%] Best Biotech Stocks This Week:
Athersys [193287%], VBI Vaccines[86898.5%], ContraFect [47677.8%], Clovis Oncology[39610.5%], NanoString Technologies[17224.7%], Neptune Wellness[14100%], Achillion [10033.3%], Kaleido [9900%], Nymox [8258.49%], Epizyme [5739.46%], Portola [4717.55%] Best Biotech Stocks Daily:
Kaleido [9900%], Neoleukin [332.665%], Syros [226.23%], Athenex [103.333%], Taysha Gene[53.4591%], DBV Technologies[21.6485%], Valneva SE[20.197%], Prime Medicine[19.4097%], Aptose [17.5439%], AlloVir [16.9215%], Sarepta [15.6832%]