
 Login Sign Up


| |||||
 |  | ||||

| 12Stocks.com Market Intelligence |
Best MidCap Stocks
|
| In a hurry? Mid Cap Stocks Lists: Performance Trends Table, Stock Charts
Sort midcap stocks: Daily, Weekly, Year-to-Date, Market Cap & Trends. Filter midcap stocks list by sector: Show all, Tech, Finance, Energy, Staples, Retail, Industrial, Materials, Utilities and HealthCare Filter midcap stocks list by size:All MidCap Large Mid-Range Small |
| 12Stocks.com Mid Cap Stocks Performances & Trends Daily | |||||||||
|
|  The overall Smart Investing & Trading Score is 70 (0-bearish to 100-bullish) which puts Mid Cap index in short term neutral to bullish trend. The Smart Investing & Trading Score from previous trading session is 56 and hence an improvement of trend.
| ||||||||
Here are the Smart Investing & Trading Scores of the most requested mid cap stocks at 12Stocks.com (click stock name for detailed review):
|


| 12Stocks.com: Top Performing Mid Cap Index Stocks | ||||||||||||||||||||||||||||||||||||||||||||||||
 The top performing Mid Cap Index stocks year to date are
Now, more recently, over last week, the top performing Mid Cap Index stocks on the move are


|
||||||||||||||||||||||||||||||||||||||||||||||||
| 12Stocks.com: Investing in Midcap Index with Stocks | |
|
The following table helps investors and traders sort through current performance and trends (as measured by Smart Investing & Trading Score) of various
stocks in the Midcap Index. Quick View: Move mouse or cursor over stock symbol (ticker) to view short-term technical chart and over stock name to view long term chart. Click on  to add stock symbol to your watchlist and to add stock symbol to your watchlist and  to view watchlist. Click on any ticker or stock name for detailed market intelligence report for that stock. to view watchlist. Click on any ticker or stock name for detailed market intelligence report for that stock. |
12Stocks.com Performance of Stocks in Midcap Index
| Ticker | Stock Name | Watchlist | Category | Recent Price | Smart Investing & Trading Score | Change % | YTD Change% |
| COO | Cooper |   | Health Care | 89.89 | 18 | 1.18% | -4.99% |
| WRB | W. R. | | Financials | 77.38 | 18 | 0.95% | 9.42% |
| EFX | Equifax | | Financials | 225.52 | 18 | 0.94% | -8.80% |
| MCW | Mister Car | | Services & Goods | 6.76 | 18 | -1.89% | -21.53% |
| CMA | Comerica | | Financials | 51.42 | 18 | -1.25% | -7.87% |
| WBS | Webster Financial | | Financials | 44.89 | 18 | -0.31% | -11.56% |
| CAH | Cardinal Health | | Services & Goods | 102.91 | 18 | -0.29% | 2.09% |
| IT | Gartner | | Technology | 448.65 | 18 | -0.03% | -0.55% |
| WHR | Whirlpool | | Consumer Staples | 96.90 | 17 | 2.43% | -20.42% |
| HE | Hawaiian Electric | | Utilities | 10.03 | 17 | 1.52% | -29.32% |
| EGP | East Properties | | Financials | 157.82 | 17 | 1.22% | -14.01% |
| SAM | Boston Beer | | Consumer Staples | 285.63 | 17 | 0.86% | -17.35% |
| RPRX | Royalty Pharma | | Health Care | 28.10 | 17 | 0.36% | 0.04% |
| JBHT | J.B. Hunt | | Transports | 162.16 | 17 | 0.09% | -18.81% |
| PCOR | Procore Technologies | | Technology | 70.11 | 17 | 0.03% | 0.33% |
| KMX | CarMax | | Services & Goods | 69.35 | 17 | -0.34% | -9.63% |
| EXAS | Exact Sciences | | Health Care | 58.78 | 17 | -0.12% | -20.55% |
| FAF | First American | | Financials | 54.18 | 17 | -0.07% | -15.92% |
| ODFL | Old Dominion | | Transports | 184.24 | 15 | 1.00% | -54.55% |
| SNV | Synovus Financial | | Financials | 36.49 | 15 | -0.98% | -3.08% |
| GTLB | GitLab | | Technology | 55.35 | 15 | -0.20% | -12.66% |
| HTZ | Hertz Global | | Industrials | 4.77 | 10 | 7.92% | -54.09% |
| ROKU | Roku | | Technology | 58.52 | 10 | 3.86% | -36.15% |
| FICO | Fair Isaac | | Technology | 1143.06 | 10 | 2.90% | -1.80% |
| MGM | MGM Resorts | | Services & Goods | 41.61 | 10 | 1.27% | -6.87% |
| For chart view version of above stock list: Chart View ➞ 0 - 25 , 25 - 50 , 50 - 75 , 75 - 100 , 100 - 125 , 125 - 150 , 150 - 175 , 175 - 200 , 200 - 225 , 225 - 250 , 250 - 275 , 275 - 300 , 300 - 325 , 325 - 350 , 350 - 375 , 375 - 400 , 400 - 425 , 425 - 450 , 450 - 475 , 475 - 500 , 500 - 525 , 525 - 550 , 550 - 575 , 575 - 600 , 600 - 625 , 625 - 650 , 650 - 675 , 675 - 700 , 700 - 725 , 725 - 750 , 750 - 775 | ||
 | Click To Change The Sort Order: By Market Cap or Company Size Performance: Year-to-date, Week and Day |  |
|
Get the most comprehensive stock market coverage daily at 12Stocks.com ➞ Best Stocks Today ➞ Best Stocks Weekly ➞ Best Stocks Year-to-Date ➞ Best Stocks Trends ➞  Best Stocks Today 12Stocks.com Best Nasdaq Stocks ➞ Best S&P 500 Stocks ➞ Best Tech Stocks ➞ Best Biotech Stocks ➞ |
| Detailed Overview of Midcap Stocks |
| Midcap Technical Overview, Leaders & Laggards, Top Midcap ETF Funds & Detailed Midcap Stocks List, Charts, Trends & More |
| Midcap: Technical Analysis, Trends & YTD Performance | |
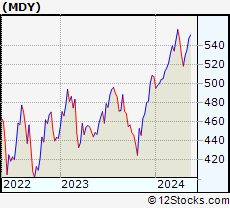
| MidCap segment as represented by
MDY, an exchange-traded fund [ETF], holds basket of about four hundred midcap stocks from across all major sectors of the US stock market. The midcap index (contains stocks like Green Mountain Coffee Roasters and Tractor Supply Company) is up by 4.91% and is currently underperforming the overall market by -1.65% year-to-date. Below is a quick view of technical charts and trends: | |
 MDY Weekly Chart |
|
| Long Term Trend: Very Good | |
| Medium Term Trend: Good | |
 MDY Daily Chart |
|
| Short Term Trend: Very Good | |
| Overall Trend Score: 70 | |
| YTD Performance: 4.91% | |
| **Trend Scores & Views Are Only For Educational Purposes And Not For Investing | |
| 12Stocks.com: Investing in Midcap Index using Exchange Traded Funds | |
|
The following table shows list of key exchange traded funds (ETF) that
help investors track Midcap index. The following list also includes leveraged ETF funds that track twice or thrice the daily returns of Midcap indices. Short or inverse ETF funds move in the opposite direction to the index they track and are useful during market pullbacks or during bear markets. Quick View: Move mouse or cursor over ETF symbol (ticker) to view short-term technical chart and over ETF name to view long term chart. Click on ticker or stock name for detailed view. Click on to add stock symbol to your watchlist and to view watchlist. |
12Stocks.com List of ETFs that track Midcap Index
| Ticker | ETF Name | Watchlist | Recent Price | Smart Investing & Trading Score | Change % | Week % | Year-to-date % |
| IJH | iShares Core S&P Mid-Cap | | 58.17 | 75 | 0.61 | 0.61 | 4.94% |
| IWR | iShares Russell Mid-Cap | | 80.98 | 75 | 0.57 | 0.57 | 4.18% |
| IWP | iShares Russell Mid-Cap Growth | | 109.47 | 78 | 0.45 | 0.45 | 4.8% |
| MDY | SPDR S&P MidCap 400 ETF | | 532.28 | 70 | 0.55 | 0.55 | 4.91% |
| IWS | iShares Russell Mid-Cap Value | | 120.76 | 75 | 0.64 | 0.64 | 3.84% |
| IJK | iShares S&P Mid-Cap 400 Growth | | 87.51 | 70 | 0.59 | 0.59 | 10.46% |
| IJJ | iShares S&P Mid-Cap 400 Value | | 112.85 | 88 | 0.55 | 0.55 | -1.04% |
| XMLV | PowerShares S&P MidCap Low Volatil ETF | | 54.94 | 83 | 0.53 | 0.53 | 3.31% |
| UMDD | ProShares UltraPro MidCap400 | | 24.32 | 71 | 1.50 | 1.5 | 8.96% |
| SMDD | ProShares UltraPro Short MidCap400 | | 11.62 | 10 | -1.78 | -1.78 | -13.69% |
| MYY | ProShares Short MidCap400 | | 20.69 | 18 | -0.48 | -0.48 | -3.56% |
| MZZ | ProShares UltraShort MidCap400 | | 11.59 | 20 | -0.77 | -0.77 | -7.8% |
| MVV | ProShares Ultra MidCap400 | | 61.81 | 83 | 0.61 | 0.61 | 6.76% |
| 12Stocks.com: Charts, Trends, Fundamental Data and Performances of MidCap Stocks | |
|
We now take in-depth look at all MidCap stocks including charts, multi-period performances and overall trends (as measured by Smart Investing & Trading Score). One can sort MidCap stocks (click link to choose) by Daily, Weekly and by Year-to-Date performances. Also, one can sort by size of the company or by market capitalization. |
| Select Your Default Chart Type: | |||||
| |||||
| Click on stock symbol or name for detailed view. Click on to add stock symbol to your watchlist and to view watchlist. Quick View: Move mouse or cursor over "Daily" to quickly view daily technical stock chart and over "Weekly" to view weekly technical stock chart. | |||||

 | COO The Cooper Companies, Inc. |
| Sector: Health Care | |
| SubSector: Medical Instruments & Supplies | |
| MarketCap: 15460 Millions | |
| Recent Price: 89.89 Smart Investing & Trading Score: 18 | |
| Day Percent Change: 1.18% Day Change: 1.05 | |
| Week Change: 1.18% Year-to-date Change: -5.0% | |
| COO Links: Profile News Message Board | |
| Charts:- Daily , Weekly | |
| Add COO to Watchlist: View: Get Complete COO Trend Analysis ➞ | |
 | WRB W. R. Berkley Corporation |
| Sector: Financials | |
| SubSector: Property & Casualty Insurance | |
| MarketCap: 9863.82 Millions | |
| Recent Price: 77.38 Smart Investing & Trading Score: 18 | |
| Day Percent Change: 0.95% Day Change: 0.73 | |
| Week Change: 0.95% Year-to-date Change: 9.4% | |
| WRB Links: Profile News Message Board | |
| Charts:- Daily , Weekly | |
| Add WRB to Watchlist: View: Get Complete WRB Trend Analysis ➞ | |
 | EFX Equifax Inc. |
| Sector: Financials | |
| SubSector: Credit Services | |
| MarketCap: 13754.6 Millions | |
| Recent Price: 225.52 Smart Investing & Trading Score: 18 | |
| Day Percent Change: 0.94% Day Change: 2.10 | |
| Week Change: 0.94% Year-to-date Change: -8.8% | |
| EFX Links: Profile News Message Board | |
| Charts:- Daily , Weekly | |
| Add EFX to Watchlist: View: Get Complete EFX Trend Analysis ➞ | |
 | MCW Mister Car Wash, Inc. |
| Sector: Services & Goods | |
| SubSector: Personal Services | |
| MarketCap: 2790 Millions | |
| Recent Price: 6.76 Smart Investing & Trading Score: 18 | |
| Day Percent Change: -1.89% Day Change: -0.13 | |
| Week Change: -1.89% Year-to-date Change: -21.5% | |
| MCW Links: Profile News Message Board | |
| Charts:- Daily , Weekly | |
| Add MCW to Watchlist: View: Get Complete MCW Trend Analysis ➞ | |
 | CMA Comerica Incorporated |
| Sector: Financials | |
| SubSector: Money Center Banks | |
| MarketCap: 4449.49 Millions | |
| Recent Price: 51.42 Smart Investing & Trading Score: 18 | |
| Day Percent Change: -1.25% Day Change: -0.65 | |
| Week Change: -1.25% Year-to-date Change: -7.9% | |
| CMA Links: Profile News Message Board | |
| Charts:- Daily , Weekly | |
| Add CMA to Watchlist: View: Get Complete CMA Trend Analysis ➞ | |
 | WBS Webster Financial Corporation |
| Sector: Financials | |
| SubSector: Regional - Northeast Banks | |
| MarketCap: 2111.59 Millions | |
| Recent Price: 44.89 Smart Investing & Trading Score: 18 | |
| Day Percent Change: -0.31% Day Change: -0.14 | |
| Week Change: -0.31% Year-to-date Change: -11.6% | |
| WBS Links: Profile News Message Board | |
| Charts:- Daily , Weekly | |
| Add WBS to Watchlist: View: Get Complete WBS Trend Analysis ➞ | |
 | CAH Cardinal Health, Inc. |
| Sector: Services & Goods | |
| SubSector: Drugs Wholesale | |
| MarketCap: 14509.9 Millions | |
| Recent Price: 102.91 Smart Investing & Trading Score: 18 | |
| Day Percent Change: -0.29% Day Change: -0.30 | |
| Week Change: -0.29% Year-to-date Change: 2.1% | |
| CAH Links: Profile News Message Board | |
| Charts:- Daily , Weekly | |
| Add CAH to Watchlist: View: Get Complete CAH Trend Analysis ➞ | |
 | IT Gartner, Inc. |
| Sector: Technology | |
| SubSector: Information Technology Services | |
| MarketCap: 7767.98 Millions | |
| Recent Price: 448.65 Smart Investing & Trading Score: 18 | |
| Day Percent Change: -0.03% Day Change: -0.13 | |
| Week Change: -0.03% Year-to-date Change: -0.6% | |
| IT Links: Profile News Message Board | |
| Charts:- Daily , Weekly | |
| Add IT to Watchlist: View: Get Complete IT Trend Analysis ➞ | |
 | WHR Whirlpool Corporation |
| Sector: Consumer Staples | |
| SubSector: Appliances | |
| MarketCap: 5015.08 Millions | |
| Recent Price: 96.90 Smart Investing & Trading Score: 17 | |
| Day Percent Change: 2.43% Day Change: 2.30 | |
| Week Change: 2.43% Year-to-date Change: -20.4% | |
| WHR Links: Profile News Message Board | |
| Charts:- Daily , Weekly | |
| Add WHR to Watchlist: View: Get Complete WHR Trend Analysis ➞ | |
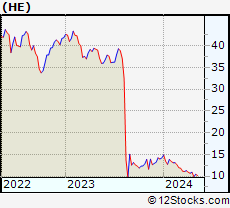 | HE Hawaiian Electric Industries, Inc. |
| Sector: Utilities | |
| SubSector: Electric Utilities | |
| MarketCap: 4527.64 Millions | |
| Recent Price: 10.03 Smart Investing & Trading Score: 17 | |
| Day Percent Change: 1.52% Day Change: 0.15 | |
| Week Change: 1.52% Year-to-date Change: -29.3% | |
| HE Links: Profile News Message Board | |
| Charts:- Daily , Weekly | |
| Add HE to Watchlist: View: Get Complete HE Trend Analysis ➞ | |
 | EGP EastGroup Properties, Inc. |
| Sector: Financials | |
| SubSector: REIT - Industrial | |
| MarketCap: 4034.29 Millions | |
| Recent Price: 157.82 Smart Investing & Trading Score: 17 | |
| Day Percent Change: 1.22% Day Change: 1.90 | |
| Week Change: 1.22% Year-to-date Change: -14.0% | |
| EGP Links: Profile News Message Board | |
| Charts:- Daily , Weekly | |
| Add EGP to Watchlist: View: Get Complete EGP Trend Analysis ➞ | |
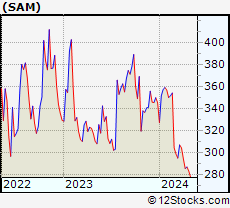 | SAM The Boston Beer Company, Inc. |
| Sector: Consumer Staples | |
| SubSector: Beverages - Brewers | |
| MarketCap: 4063.67 Millions | |
| Recent Price: 285.63 Smart Investing & Trading Score: 17 | |
| Day Percent Change: 0.86% Day Change: 2.43 | |
| Week Change: 0.86% Year-to-date Change: -17.4% | |
| SAM Links: Profile News Message Board | |
| Charts:- Daily , Weekly | |
| Add SAM to Watchlist: View: Get Complete SAM Trend Analysis ➞ | |
 | RPRX Royalty Pharma plc |
| Sector: Health Care | |
| SubSector: Biotechnology | |
| MarketCap: 28457 Millions | |
| Recent Price: 28.10 Smart Investing & Trading Score: 17 | |
| Day Percent Change: 0.36% Day Change: 0.10 | |
| Week Change: 0.36% Year-to-date Change: 0.0% | |
| RPRX Links: Profile News Message Board | |
| Charts:- Daily , Weekly | |
| Add RPRX to Watchlist: View: Get Complete RPRX Trend Analysis ➞ | |
 | JBHT J.B. Hunt Transport Services, Inc. |
| Sector: Transports | |
| SubSector: Trucking | |
| MarketCap: 9074 Millions | |
| Recent Price: 162.16 Smart Investing & Trading Score: 17 | |
| Day Percent Change: 0.09% Day Change: 0.15 | |
| Week Change: 0.09% Year-to-date Change: -18.8% | |
| JBHT Links: Profile News Message Board | |
| Charts:- Daily , Weekly | |
| Add JBHT to Watchlist: View: Get Complete JBHT Trend Analysis ➞ | |
 | PCOR Procore Technologies, Inc. |
| Sector: Technology | |
| SubSector: Software - Application | |
| MarketCap: 9180 Millions | |
| Recent Price: 70.11 Smart Investing & Trading Score: 17 | |
| Day Percent Change: 0.03% Day Change: 0.02 | |
| Week Change: 0.03% Year-to-date Change: 0.3% | |
| PCOR Links: Profile News Message Board | |
| Charts:- Daily , Weekly | |
| Add PCOR to Watchlist: View: Get Complete PCOR Trend Analysis ➞ | |
 | KMX CarMax, Inc. |
| Sector: Services & Goods | |
| SubSector: Auto Dealerships | |
| MarketCap: 8121.71 Millions | |
| Recent Price: 69.35 Smart Investing & Trading Score: 17 | |
| Day Percent Change: -0.34% Day Change: -0.24 | |
| Week Change: -0.34% Year-to-date Change: -9.6% | |
| KMX Links: Profile News Message Board | |
| Charts:- Daily , Weekly | |
| Add KMX to Watchlist: View: Get Complete KMX Trend Analysis ➞ | |
 | EXAS Exact Sciences Corporation |
| Sector: Health Care | |
| SubSector: Medical Laboratories & Research | |
| MarketCap: 8572 Millions | |
| Recent Price: 58.78 Smart Investing & Trading Score: 17 | |
| Day Percent Change: -0.12% Day Change: -0.07 | |
| Week Change: -0.12% Year-to-date Change: -20.6% | |
| EXAS Links: Profile News Message Board | |
| Charts:- Daily , Weekly | |
| Add EXAS to Watchlist: View: Get Complete EXAS Trend Analysis ➞ | |
 | FAF First American Financial Corporation |
| Sector: Financials | |
| SubSector: Property & Casualty Insurance | |
| MarketCap: 4163.82 Millions | |
| Recent Price: 54.18 Smart Investing & Trading Score: 17 | |
| Day Percent Change: -0.07% Day Change: -0.04 | |
| Week Change: -0.07% Year-to-date Change: -15.9% | |
| FAF Links: Profile News Message Board | |
| Charts:- Daily , Weekly | |
| Add FAF to Watchlist: View: Get Complete FAF Trend Analysis ➞ | |
 | ODFL Old Dominion Freight Line, Inc. |
| Sector: Transports | |
| SubSector: Trucking | |
| MarketCap: 14457.5 Millions | |
| Recent Price: 184.24 Smart Investing & Trading Score: 15 | |
| Day Percent Change: 1.00% Day Change: 1.82 | |
| Week Change: 1% Year-to-date Change: -54.6% | |
| ODFL Links: Profile News Message Board | |
| Charts:- Daily , Weekly | |
| Add ODFL to Watchlist: View: Get Complete ODFL Trend Analysis ➞ | |
 | SNV Synovus Financial Corp. |
| Sector: Financials | |
| SubSector: Regional - Mid-Atlantic Banks | |
| MarketCap: 2697.29 Millions | |
| Recent Price: 36.49 Smart Investing & Trading Score: 15 | |
| Day Percent Change: -0.98% Day Change: -0.36 | |
| Week Change: -0.98% Year-to-date Change: -3.1% | |
| SNV Links: Profile News Message Board | |
| Charts:- Daily , Weekly | |
| Add SNV to Watchlist: View: Get Complete SNV Trend Analysis ➞ | |
 | GTLB GitLab Inc. |
| Sector: Technology | |
| SubSector: Software - Application | |
| MarketCap: 7840 Millions | |
| Recent Price: 55.35 Smart Investing & Trading Score: 15 | |
| Day Percent Change: -0.20% Day Change: -0.11 | |
| Week Change: -0.2% Year-to-date Change: -12.7% | |
| GTLB Links: Profile News Message Board | |
| Charts:- Daily , Weekly | |
| Add GTLB to Watchlist: View: Get Complete GTLB Trend Analysis ➞ | |
 | HTZ Hertz Global Holdings, Inc. |
| Sector: Industrials | |
| SubSector: Rental & Leasing Services | |
| MarketCap: 5830 Millions | |
| Recent Price: 4.77 Smart Investing & Trading Score: 10 | |
| Day Percent Change: 7.92% Day Change: 0.35 | |
| Week Change: 7.92% Year-to-date Change: -54.1% | |
| HTZ Links: Profile News Message Board | |
| Charts:- Daily , Weekly | |
| Add HTZ to Watchlist: View: Get Complete HTZ Trend Analysis ➞ | |
 | ROKU Roku, Inc. |
| Sector: Technology | |
| SubSector: CATV Systems | |
| MarketCap: 10503.6 Millions | |
| Recent Price: 58.52 Smart Investing & Trading Score: 10 | |
| Day Percent Change: 3.86% Day Change: 2.17 | |
| Week Change: 3.86% Year-to-date Change: -36.2% | |
| ROKU Links: Profile News Message Board | |
| Charts:- Daily , Weekly | |
| Add ROKU to Watchlist: View: Get Complete ROKU Trend Analysis ➞ | |
 | FICO Fair Isaac Corporation |
| Sector: Technology | |
| SubSector: Business Software & Services | |
| MarketCap: 7930.98 Millions | |
| Recent Price: 1143.06 Smart Investing & Trading Score: 10 | |
| Day Percent Change: 2.90% Day Change: 32.21 | |
| Week Change: 2.9% Year-to-date Change: -1.8% | |
| FICO Links: Profile News Message Board | |
| Charts:- Daily , Weekly | |
| Add FICO to Watchlist: View: Get Complete FICO Trend Analysis ➞ | |
 | MGM MGM Resorts International |
| Sector: Services & Goods | |
| SubSector: Resorts & Casinos | |
| MarketCap: 5315.04 Millions | |
| Recent Price: 41.61 Smart Investing & Trading Score: 10 | |
| Day Percent Change: 1.27% Day Change: 0.52 | |
| Week Change: 1.27% Year-to-date Change: -6.9% | |
| MGM Links: Profile News Message Board | |
| Charts:- Daily , Weekly | |
| Add MGM to Watchlist: View: Get Complete MGM Trend Analysis ➞ | |
| For tabular summary view of above stock list: Summary View ➞ 0 - 25 , 25 - 50 , 50 - 75 , 75 - 100 , 100 - 125 , 125 - 150 , 150 - 175 , 175 - 200 , 200 - 225 , 225 - 250 , 250 - 275 , 275 - 300 , 300 - 325 , 325 - 350 , 350 - 375 , 375 - 400 , 400 - 425 , 425 - 450 , 450 - 475 , 475 - 500 , 500 - 525 , 525 - 550 , 550 - 575 , 575 - 600 , 600 - 625 , 625 - 650 , 650 - 675 , 675 - 700 , 700 - 725 , 725 - 750 , 750 - 775 | ||
| Click To Change The Sort Order: By Market Cap or Company Size Performance: Year-to-date, Week and Day | |
| Select Chart Type: | ||
|
Best Stocks Today 12Stocks.com |
© 2024 12Stocks.com Terms & Conditions Privacy Contact Us
All Information Provided Only For Education And Not To Be Used For Investing or Trading. See Terms & Conditions


One More Thing ... Get Best Stocks Delivered Daily!
Never Ever Miss A Move With Our Top Ten Stocks Lists
Find Best Stocks In Any Market - Bull or Bear Market
Take A Peek At Our Top Ten Stocks Lists: Daily, Weekly, Year-to-Date & Top Trends
Find Best Stocks In Any Market - Bull or Bear Market
Take A Peek At Our Top Ten Stocks Lists: Daily, Weekly, Year-to-Date & Top Trends
Midcap Stocks With Best Up Trends [0-bearish to 100-bullish]: Albemarle [100], Domino s[100], Tandem Diabetes[100], Quest Diagnostics[100], AES [100], Carrier Global[100], Teradyne [100], DaVita [100], Skyworks Solutions[100], LPL Financial[100], Perrigo [100]
Best Midcap Stocks Year-to-Date:
Vistra Energy[102.39%], AppLovin [83.42%], ShockWave Medical[72.92%], EMCOR [68.8%], CAVA [62.35%], Constellation Energy[61.05%], Spotify [53.34%], Antero Resources[51.23%], Natera [50.13%], Wingstop [49.98%], Pure Storage[47.03%] Best Midcap Stocks This Week:
Ginkgo Bioworks[15.08%], Hertz Global[7.92%], Albemarle [7.57%], Vistra Energy[7.24%], Medical Properties[5.99%], Domino s[5.62%], Liberty SiriusXM[5.49%], Liberty SiriusXM[5.27%], Tandem Diabetes[5.19%], Sirius XM[4.97%], Peloton Interactive[4.43%] Best Midcap Stocks Daily:
Ginkgo Bioworks[15.08%], Hertz Global[7.92%], Albemarle [7.57%], Vistra Energy[7.24%], Medical Properties[5.99%], Domino s[5.62%], Liberty SiriusXM[5.49%], Liberty SiriusXM[5.27%], Tandem Diabetes[5.19%], Sirius XM[4.97%], Peloton Interactive[4.43%]