
 Login Sign Up


| |||||
 |  | ||||

| 12Stocks.com Market Intelligence |
Best MidCap Stocks
|
| In a hurry? Mid Cap Stocks Lists: Performance Trends Table, Stock Charts
Sort midcap stocks: Daily, Weekly, Year-to-Date, Market Cap & Trends. Filter midcap stocks list by sector: Show all, Tech, Finance, Energy, Staples, Retail, Industrial, Materials, Utilities and HealthCare Filter midcap stocks list by size:All MidCap Large Mid-Range Small |
| 12Stocks.com Mid Cap Stocks Performances & Trends Daily | |||||||||
|
|  The overall Smart Investing & Trading Score is 85 (0-bearish to 100-bullish) which puts Mid Cap index in short term bullish trend. The Smart Investing & Trading Score from previous trading session is 45 and hence an improvement of trend.
| ||||||||
Here are the Smart Investing & Trading Scores of the most requested mid cap stocks at 12Stocks.com (click stock name for detailed review):
|


| 12Stocks.com: Top Performing Mid Cap Index Stocks | ||||||||||||||||||||||||||||||||||||||||||||||||
 The top performing Mid Cap Index stocks year to date are
Now, more recently, over last week, the top performing Mid Cap Index stocks on the move are


|
||||||||||||||||||||||||||||||||||||||||||||||||
| 12Stocks.com: Investing in Midcap Index with Stocks | |
|
The following table helps investors and traders sort through current performance and trends (as measured by Smart Investing & Trading Score) of various
stocks in the Midcap Index. Quick View: Move mouse or cursor over stock symbol (ticker) to view short-term technical chart and over stock name to view long term chart. Click on  to add stock symbol to your watchlist and to add stock symbol to your watchlist and  to view watchlist. Click on any ticker or stock name for detailed market intelligence report for that stock. to view watchlist. Click on any ticker or stock name for detailed market intelligence report for that stock. |
12Stocks.com Performance of Stocks in Midcap Index
| Ticker | Stock Name | Watchlist | Category | Recent Price | Smart Investing & Trading Score | Change % | YTD Change% |
| DRI | Darden Restaurants |   | Services & Goods | 149.25 | 0 | 0.94% | -9.16% |
| PENN | Penn National | | Services & Goods | 15.13 | 0 | 0.83% | -41.87% |
| GPN | Global Payments | | Services & Goods | 111.37 | 0 | 0.75% | -12.31% |
| IQV | IQVIA | | Health Care | 223.37 | 0 | 0.55% | -3.46% |
| HII | Huntington Ingalls | | Industrials | 246.23 | 0 | 0.42% | -5.16% |
| CF | CF Industries | | Materials | 74.09 | 0 | 0.30% | -6.81% |
| QRVO | Qorvo | | Technology | 95.95 | 0 | 0.29% | -14.79% |
| APA | Apache | | Energy | 29.26 | 0 | 0.27% | -18.45% |
| TRMB | Trimble | | Technology | 55.93 | 0 | -6.92% | 5.13% |
| IR | Ingersoll Rand | | Industrials | 86.72 | 0 | -6.60% | 12.13% |
| CAH | Cardinal Health | | Services & Goods | 98.91 | 0 | -3.95% | -1.88% |
| OWL | Blue Owl | | Financials | 17.96 | 0 | -3.26% | 20.62% |
| SCI | Service | | Services & Goods | 67.59 | 0 | -2.89% | -1.26% |
| VNT | Vontier | | Technology | 39.44 | 0 | -2.26% | 14.15% |
| NET | Cloudflare | | Technology | 74.40 | 0 | -16.38% | -10.64% |
| EXPE | Expedia | | Services & Goods | 115.33 | 0 | -15.25% | -24.02% |
| HSIC | Henry Schein | | Services & Goods | 67.78 | 0 | -1.20% | -10.47% |
| CLX | Clorox | | Consumer Staples | 138.23 | 0 | -1.03% | -3.06% |
| MUSA | Murphy USA | | Services & Goods | 392.44 | 0 | -0.99% | 10.06% |
| DDOG | Datadog | | Technology | 124.27 | 0 | -0.95% | 2.38% |
| ACHC | Acadia | | Health Care | 66.12 | 0 | -0.91% | -14.97% |
| YUM | Yum! | | Services & Goods | 134.34 | 0 | -0.54% | 2.82% |
| DASH | DoorDash | | Technology | 113.82 | 0 | -0.43% | 15.19% |
| XRAY | DENTSPLY SIRONA | | Health Care | 28.29 | 0 | -0.32% | -20.51% |
| BRKR | Bruker | | Health Care | 70.05 | 0 | -0.06% | -4.67% |
| For chart view version of above stock list: Chart View ➞ 0 - 25 , 25 - 50 , 50 - 75 , 75 - 100 , 100 - 125 , 125 - 150 , 150 - 175 , 175 - 200 , 200 - 225 , 225 - 250 , 250 - 275 , 275 - 300 , 300 - 325 , 325 - 350 , 350 - 375 , 375 - 400 , 400 - 425 , 425 - 450 , 450 - 475 , 475 - 500 , 500 - 525 , 525 - 550 , 550 - 575 , 575 - 600 , 600 - 625 , 625 - 650 , 650 - 675 , 675 - 700 , 700 - 725 , 725 - 750 , 750 - 775 | ||
 | Click To Change The Sort Order: By Market Cap or Company Size Performance: Year-to-date, Week and Day |  |
|
Get the most comprehensive stock market coverage daily at 12Stocks.com ➞ Best Stocks Today ➞ Best Stocks Weekly ➞ Best Stocks Year-to-Date ➞ Best Stocks Trends ➞  Best Stocks Today 12Stocks.com Best Nasdaq Stocks ➞ Best S&P 500 Stocks ➞ Best Tech Stocks ➞ Best Biotech Stocks ➞ |
| Detailed Overview of Midcap Stocks |
| Midcap Technical Overview, Leaders & Laggards, Top Midcap ETF Funds & Detailed Midcap Stocks List, Charts, Trends & More |
| Midcap: Technical Analysis, Trends & YTD Performance | |
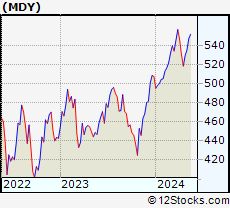
| MidCap segment as represented by
MDY, an exchange-traded fund [ETF], holds basket of about four hundred midcap stocks from across all major sectors of the US stock market. The midcap index (contains stocks like Green Mountain Coffee Roasters and Tractor Supply Company) is up by 5.52% and is currently underperforming the overall market by -1.36% year-to-date. Below is a quick view of technical charts and trends: | |
 MDY Weekly Chart |
|
| Long Term Trend: Good | |
| Medium Term Trend: Good | |
 MDY Daily Chart |
|
| Short Term Trend: Very Good | |
| Overall Trend Score: 85 | |
| YTD Performance: 5.52% | |
| **Trend Scores & Views Are Only For Educational Purposes And Not For Investing | |
| 12Stocks.com: Investing in Midcap Index using Exchange Traded Funds | |
|
The following table shows list of key exchange traded funds (ETF) that
help investors track Midcap index. The following list also includes leveraged ETF funds that track twice or thrice the daily returns of Midcap indices. Short or inverse ETF funds move in the opposite direction to the index they track and are useful during market pullbacks or during bear markets. Quick View: Move mouse or cursor over ETF symbol (ticker) to view short-term technical chart and over ETF name to view long term chart. Click on ticker or stock name for detailed view. Click on to add stock symbol to your watchlist and to view watchlist. |
12Stocks.com List of ETFs that track Midcap Index
| Ticker | ETF Name | Watchlist | Recent Price | Smart Investing & Trading Score | Change % | Week % | Year-to-date % |
| IJH | iShares Core S&P Mid-Cap | | 58.53 | 85 | 1.05 | 1.23 | 5.59% |
| IWR | iShares Russell Mid-Cap | | 80.78 | 60 | 0.72 | 0.32 | 3.92% |
| MDY | SPDR S&P MidCap 400 ETF | | 535.41 | 85 | 1.01 | 1.14 | 5.52% |
| IWP | iShares Russell Mid-Cap Growth | | 108.75 | 39 | 0.54 | -0.21 | 4.11% |
| IJK | iShares S&P Mid-Cap 400 Growth | | 87.89 | 78 | 1.02 | 1.02 | 10.94% |
| IWS | iShares Russell Mid-Cap Value | | 120.70 | 78 | 0.80 | 0.59 | 3.79% |
| IJJ | iShares S&P Mid-Cap 400 Value | | 113.77 | 90 | 0.96 | 1.37 | -0.24% |
| XMLV | PowerShares S&P MidCap Low Volatil ETF | | 55.50 | 100 | 0.62 | 1.56 | 4.36% |
| SMDD | ProShares UltraPro Short MidCap400 | | 11.45 | 10 | -2.82 | -3.23 | -14.97% |
| MVV | ProShares Ultra MidCap400 | | 62.72 | 85 | 2.37 | 2.1 | 8.34% |
| UMDD | ProShares UltraPro MidCap400 | | 24.68 | 85 | 3.08 | 3 | 10.56% |
| MYY | ProShares Short MidCap400 | | 20.57 | 28 | -0.76 | -1.04 | -4.11% |
| MZZ | ProShares UltraShort MidCap400 | | 11.46 | 20 | -2.05 | -1.88 | -8.84% |
| 12Stocks.com: Charts, Trends, Fundamental Data and Performances of MidCap Stocks | |
|
We now take in-depth look at all MidCap stocks including charts, multi-period performances and overall trends (as measured by Smart Investing & Trading Score). One can sort MidCap stocks (click link to choose) by Daily, Weekly and by Year-to-Date performances. Also, one can sort by size of the company or by market capitalization. |
| Select Your Default Chart Type: | |||||
| |||||
| Click on stock symbol or name for detailed view. Click on to add stock symbol to your watchlist and to view watchlist. Quick View: Move mouse or cursor over "Daily" to quickly view daily technical stock chart and over "Weekly" to view weekly technical stock chart. | |||||

 | DRI Darden Restaurants, Inc. |
| Sector: Services & Goods | |
| SubSector: Restaurants | |
| MarketCap: 5623.1 Millions | |
| Recent Price: 149.25 Smart Investing & Trading Score: 0 | |
| Day Percent Change: 0.94% Day Change: 1.39 | |
| Week Change: -4.39% Year-to-date Change: -9.2% | |
| DRI Links: Profile News Message Board | |
| Charts:- Daily , Weekly | |
| Add DRI to Watchlist: View: Get Complete DRI Trend Analysis ➞ | |
 | PENN Penn National Gaming, Inc. |
| Sector: Services & Goods | |
| SubSector: Resorts & Casinos | |
| MarketCap: 1183.84 Millions | |
| Recent Price: 15.13 Smart Investing & Trading Score: 0 | |
| Day Percent Change: 0.83% Day Change: 0.13 | |
| Week Change: -10.29% Year-to-date Change: -41.9% | |
| PENN Links: Profile News Message Board | |
| Charts:- Daily , Weekly | |
| Add PENN to Watchlist: View: Get Complete PENN Trend Analysis ➞ | |
 | GPN Global Payments Inc. |
| Sector: Services & Goods | |
| SubSector: Business Services | |
| MarketCap: 39068.8 Millions | |
| Recent Price: 111.37 Smart Investing & Trading Score: 0 | |
| Day Percent Change: 0.75% Day Change: 0.83 | |
| Week Change: -10.6% Year-to-date Change: -12.3% | |
| GPN Links: Profile News Message Board | |
| Charts:- Daily , Weekly | |
| Add GPN to Watchlist: View: Get Complete GPN Trend Analysis ➞ | |
 | IQV IQVIA Holdings Inc. |
| Sector: Health Care | |
| SubSector: Medical Laboratories & Research | |
| MarketCap: 19616.5 Millions | |
| Recent Price: 223.37 Smart Investing & Trading Score: 0 | |
| Day Percent Change: 0.55% Day Change: 1.23 | |
| Week Change: -4.9% Year-to-date Change: -3.5% | |
| IQV Links: Profile News Message Board | |
| Charts:- Daily , Weekly | |
| Add IQV to Watchlist: View: Get Complete IQV Trend Analysis ➞ | |
 | HII Huntington Ingalls Industries, Inc. |
| Sector: Industrials | |
| SubSector: Aerospace/Defense Products & Services | |
| MarketCap: 7276.11 Millions | |
| Recent Price: 246.23 Smart Investing & Trading Score: 0 | |
| Day Percent Change: 0.42% Day Change: 1.04 | |
| Week Change: -11.1% Year-to-date Change: -5.2% | |
| HII Links: Profile News Message Board | |
| Charts:- Daily , Weekly | |
| Add HII to Watchlist: View: Get Complete HII Trend Analysis ➞ | |
 | CF CF Industries Holdings, Inc. |
| Sector: Materials | |
| SubSector: Agricultural Chemicals | |
| MarketCap: 5581.89 Millions | |
| Recent Price: 74.09 Smart Investing & Trading Score: 0 | |
| Day Percent Change: 0.30% Day Change: 0.22 | |
| Week Change: -7.39% Year-to-date Change: -6.8% | |
| CF Links: Profile News Message Board | |
| Charts:- Daily , Weekly | |
| Add CF to Watchlist: View: Get Complete CF Trend Analysis ➞ | |
 | QRVO Qorvo, Inc. |
| Sector: Technology | |
| SubSector: Semiconductor - Broad Line | |
| MarketCap: 9524.32 Millions | |
| Recent Price: 95.95 Smart Investing & Trading Score: 0 | |
| Day Percent Change: 0.29% Day Change: 0.28 | |
| Week Change: -17.82% Year-to-date Change: -14.8% | |
| QRVO Links: Profile News Message Board | |
| Charts:- Daily , Weekly | |
| Add QRVO to Watchlist: View: Get Complete QRVO Trend Analysis ➞ | |
 | APA Apache Corporation |
| Sector: Energy | |
| SubSector: Independent Oil & Gas | |
| MarketCap: 1937.53 Millions | |
| Recent Price: 29.26 Smart Investing & Trading Score: 0 | |
| Day Percent Change: 0.27% Day Change: 0.08 | |
| Week Change: -9.94% Year-to-date Change: -18.5% | |
| APA Links: Profile News Message Board | |
| Charts:- Daily , Weekly | |
| Add APA to Watchlist: View: Get Complete APA Trend Analysis ➞ | |
 | TRMB Trimble Inc. |
| Sector: Technology | |
| SubSector: Scientific & Technical Instruments | |
| MarketCap: 7990.33 Millions | |
| Recent Price: 55.93 Smart Investing & Trading Score: 0 | |
| Day Percent Change: -6.92% Day Change: -4.16 | |
| Week Change: -7.02% Year-to-date Change: 5.1% | |
| TRMB Links: Profile News Message Board | |
| Charts:- Daily , Weekly | |
| Add TRMB to Watchlist: View: Get Complete TRMB Trend Analysis ➞ | |
 | IR Ingersoll Rand Inc. |
| Sector: Industrials | |
| SubSector: Diversified Machinery | |
| MarketCap: 8970.56 Millions | |
| Recent Price: 86.72 Smart Investing & Trading Score: 0 | |
| Day Percent Change: -6.60% Day Change: -6.13 | |
| Week Change: -7.25% Year-to-date Change: 12.1% | |
| IR Links: Profile News Message Board | |
| Charts:- Daily , Weekly | |
| Add IR to Watchlist: View: Get Complete IR Trend Analysis ➞ | |
 | CAH Cardinal Health, Inc. |
| Sector: Services & Goods | |
| SubSector: Drugs Wholesale | |
| MarketCap: 14509.9 Millions | |
| Recent Price: 98.91 Smart Investing & Trading Score: 0 | |
| Day Percent Change: -3.95% Day Change: -4.07 | |
| Week Change: -4.17% Year-to-date Change: -1.9% | |
| CAH Links: Profile News Message Board | |
| Charts:- Daily , Weekly | |
| Add CAH to Watchlist: View: Get Complete CAH Trend Analysis ➞ | |
 | OWL Blue Owl Capital Inc. |
| Sector: Financials | |
| SubSector: Asset Management | |
| MarketCap: 16240 Millions | |
| Recent Price: 17.96 Smart Investing & Trading Score: 0 | |
| Day Percent Change: -3.26% Day Change: -0.61 | |
| Week Change: -4.42% Year-to-date Change: 20.6% | |
| OWL Links: Profile News Message Board | |
| Charts:- Daily , Weekly | |
| Add OWL to Watchlist: View: Get Complete OWL Trend Analysis ➞ | |
 | SCI Service Corporation International |
| Sector: Services & Goods | |
| SubSector: Personal Services | |
| MarketCap: 7216.05 Millions | |
| Recent Price: 67.59 Smart Investing & Trading Score: 0 | |
| Day Percent Change: -2.89% Day Change: -2.01 | |
| Week Change: -5.78% Year-to-date Change: -1.3% | |
| SCI Links: Profile News Message Board | |
| Charts:- Daily , Weekly | |
| Add SCI to Watchlist: View: Get Complete SCI Trend Analysis ➞ | |
 | VNT Vontier Corporation |
| Sector: Technology | |
| SubSector: Scientific & Technical Instruments | |
| MarketCap: 53787 Millions | |
| Recent Price: 39.44 Smart Investing & Trading Score: 0 | |
| Day Percent Change: -2.26% Day Change: -0.91 | |
| Week Change: -4.32% Year-to-date Change: 14.2% | |
| VNT Links: Profile News Message Board | |
| Charts:- Daily , Weekly | |
| Add VNT to Watchlist: View: Get Complete VNT Trend Analysis ➞ | |
 | NET Cloudflare, Inc. |
| Sector: Technology | |
| SubSector: Application Software | |
| MarketCap: 7063.72 Millions | |
| Recent Price: 74.40 Smart Investing & Trading Score: 0 | |
| Day Percent Change: -16.38% Day Change: -14.57 | |
| Week Change: -15.46% Year-to-date Change: -10.6% | |
| NET Links: Profile News Message Board | |
| Charts:- Daily , Weekly | |
| Add NET to Watchlist: View: Get Complete NET Trend Analysis ➞ | |
 | EXPE Expedia Group, Inc. |
| Sector: Services & Goods | |
| SubSector: Lodging | |
| MarketCap: 8052.96 Millions | |
| Recent Price: 115.33 Smart Investing & Trading Score: 0 | |
| Day Percent Change: -15.25% Day Change: -20.76 | |
| Week Change: -15.01% Year-to-date Change: -24.0% | |
| EXPE Links: Profile News Message Board | |
| Charts:- Daily , Weekly | |
| Add EXPE to Watchlist: View: Get Complete EXPE Trend Analysis ➞ | |
 | HSIC Henry Schein, Inc. |
| Sector: Services & Goods | |
| SubSector: Medical Equipment Wholesale | |
| MarketCap: 6760.9 Millions | |
| Recent Price: 67.78 Smart Investing & Trading Score: 0 | |
| Day Percent Change: -1.20% Day Change: -0.82 | |
| Week Change: -7.32% Year-to-date Change: -10.5% | |
| HSIC Links: Profile News Message Board | |
| Charts:- Daily , Weekly | |
| Add HSIC to Watchlist: View: Get Complete HSIC Trend Analysis ➞ | |
 | CLX The Clorox Company |
| Sector: Consumer Staples | |
| SubSector: Housewares & Accessories | |
| MarketCap: 23688.3 Millions | |
| Recent Price: 138.23 Smart Investing & Trading Score: 0 | |
| Day Percent Change: -1.03% Day Change: -1.44 | |
| Week Change: -5.63% Year-to-date Change: -3.1% | |
| CLX Links: Profile News Message Board | |
| Charts:- Daily , Weekly | |
| Add CLX to Watchlist: View: Get Complete CLX Trend Analysis ➞ | |
 | MUSA Murphy USA Inc. |
| Sector: Services & Goods | |
| SubSector: Specialty Retail, Other | |
| MarketCap: 3133.14 Millions | |
| Recent Price: 392.44 Smart Investing & Trading Score: 0 | |
| Day Percent Change: -0.99% Day Change: -3.92 | |
| Week Change: -6.86% Year-to-date Change: 10.1% | |
| MUSA Links: Profile News Message Board | |
| Charts:- Daily , Weekly | |
| Add MUSA to Watchlist: View: Get Complete MUSA Trend Analysis ➞ | |
 | DDOG Datadog, Inc. |
| Sector: Technology | |
| SubSector: Application Software | |
| MarketCap: 10653.2 Millions | |
| Recent Price: 124.27 Smart Investing & Trading Score: 0 | |
| Day Percent Change: -0.95% Day Change: -1.19 | |
| Week Change: -5.46% Year-to-date Change: 2.4% | |
| DDOG Links: Profile News Message Board | |
| Charts:- Daily , Weekly | |
| Add DDOG to Watchlist: View: Get Complete DDOG Trend Analysis ➞ | |
 | ACHC Acadia Healthcare Company, Inc. |
| Sector: Health Care | |
| SubSector: Specialized Health Services | |
| MarketCap: 1331.56 Millions | |
| Recent Price: 66.12 Smart Investing & Trading Score: 0 | |
| Day Percent Change: -0.91% Day Change: -0.61 | |
| Week Change: -10.15% Year-to-date Change: -15.0% | |
| ACHC Links: Profile News Message Board | |
| Charts:- Daily , Weekly | |
| Add ACHC to Watchlist: View: Get Complete ACHC Trend Analysis ➞ | |
 | YUM Yum! Brands, Inc. |
| Sector: Services & Goods | |
| SubSector: Restaurants | |
| MarketCap: 18033.3 Millions | |
| Recent Price: 134.34 Smart Investing & Trading Score: 0 | |
| Day Percent Change: -0.54% Day Change: -0.73 | |
| Week Change: -5.24% Year-to-date Change: 2.8% | |
| YUM Links: Profile News Message Board | |
| Charts:- Daily , Weekly | |
| Add YUM to Watchlist: View: Get Complete YUM Trend Analysis ➞ | |
 | DASH DoorDash, Inc. |
| Sector: Technology | |
| SubSector: Internet Content & Information | |
| MarketCap: 59087 Millions | |
| Recent Price: 113.82 Smart Investing & Trading Score: 0 | |
| Day Percent Change: -0.43% Day Change: -0.49 | |
| Week Change: -13.84% Year-to-date Change: 15.2% | |
| DASH Links: Profile News Message Board | |
| Charts:- Daily , Weekly | |
| Add DASH to Watchlist: View: Get Complete DASH Trend Analysis ➞ | |
 | XRAY DENTSPLY SIRONA Inc. |
| Sector: Health Care | |
| SubSector: Medical Instruments & Supplies | |
| MarketCap: 7746.1 Millions | |
| Recent Price: 28.29 Smart Investing & Trading Score: 0 | |
| Day Percent Change: -0.32% Day Change: -0.09 | |
| Week Change: -7.46% Year-to-date Change: -20.5% | |
| XRAY Links: Profile News Message Board | |
| Charts:- Daily , Weekly | |
| Add XRAY to Watchlist: View: Get Complete XRAY Trend Analysis ➞ | |
 | BRKR Bruker Corporation |
| Sector: Health Care | |
| SubSector: Medical Laboratories & Research | |
| MarketCap: 5932 Millions | |
| Recent Price: 70.05 Smart Investing & Trading Score: 0 | |
| Day Percent Change: -0.06% Day Change: -0.05 | |
| Week Change: -13.49% Year-to-date Change: -4.7% | |
| BRKR Links: Profile News Message Board | |
| Charts:- Daily , Weekly | |
| Add BRKR to Watchlist: View: Get Complete BRKR Trend Analysis ➞ | |
| For tabular summary view of above stock list: Summary View ➞ 0 - 25 , 25 - 50 , 50 - 75 , 75 - 100 , 100 - 125 , 125 - 150 , 150 - 175 , 175 - 200 , 200 - 225 , 225 - 250 , 250 - 275 , 275 - 300 , 300 - 325 , 325 - 350 , 350 - 375 , 375 - 400 , 400 - 425 , 425 - 450 , 450 - 475 , 475 - 500 , 500 - 525 , 525 - 550 , 550 - 575 , 575 - 600 , 600 - 625 , 625 - 650 , 650 - 675 , 675 - 700 , 700 - 725 , 725 - 750 , 750 - 775 | ||
| Click To Change The Sort Order: By Market Cap or Company Size Performance: Year-to-date, Week and Day | |
| Select Chart Type: | ||
|
Best Stocks Today 12Stocks.com |
© 2024 12Stocks.com Terms & Conditions Privacy Contact Us
All Information Provided Only For Education And Not To Be Used For Investing or Trading. See Terms & Conditions


One More Thing ... Get Best Stocks Delivered Daily!
Never Ever Miss A Move With Our Top Ten Stocks Lists
Find Best Stocks In Any Market - Bull or Bear Market
Take A Peek At Our Top Ten Stocks Lists: Daily, Weekly, Year-to-Date & Top Trends
Find Best Stocks In Any Market - Bull or Bear Market
Take A Peek At Our Top Ten Stocks Lists: Daily, Weekly, Year-to-Date & Top Trends
Midcap Stocks With Best Up Trends [0-bearish to 100-bullish]: GameStop [100], Tandem Diabetes[100], MasTec [100], Frontier [100], Organon [100], First Solar[100], Reinsurance [100], Brookfield Renewable[100], Camden Property[100], Aptiv [100], Texas Roadhouse[100]
Best Midcap Stocks Year-to-Date:
Vistra Energy[111.55%], AppLovin [88.57%], ShockWave Medical[73.37%], EMCOR [68.86%], Constellation Energy[66.35%], CAVA [65.92%], Tenet [59.16%], Spotify [57.56%], Natera [54.82%], Wingstop [51.43%], Tandem Diabetes[51.18%] Best Midcap Stocks This Week:
GameStop [38.4%], Tandem Diabetes[26.9%], Tenet [25.12%], Wayfair [22.26%], Brookfield Renewable[21.71%], Bio-Techne [20.65%], Pinterest [18.99%], New York[18.86%], Olaplex [18.28%], Valmont Industries[17.25%], NovoCure [16.98%] Best Midcap Stocks Daily:
GameStop [29.08%], Tandem Diabetes[22.32%], Ginkgo Bioworks[12.33%], Paylocity Holding[12.05%], MasTec [11.87%], Plug Power[11.84%], Peloton Interactive[9.42%], Universal Display[9.28%], Sunrun [8.68%], Frontier [8.66%], Wayfair [8.44%]