
 Login Sign Up


| |||||
 |  | ||||

| 12Stocks.com Market Intelligence |
Best MidCap Stocks
|
| In a hurry? Mid Cap Stocks Lists: Performance Trends Table, Stock Charts
Sort midcap stocks: Daily, Weekly, Year-to-Date, Market Cap & Trends. Filter midcap stocks list by sector: Show all, Tech, Finance, Energy, Staples, Retail, Industrial, Materials, Utilities and HealthCare Filter midcap stocks list by size:All MidCap Large Mid-Range Small |
| 12Stocks.com Mid Cap Stocks Performances & Trends Daily | |||||||||
|
|  The overall Smart Investing & Trading Score is 7 (0-bearish to 100-bullish) which puts Mid Cap index in short term bearish trend. The Smart Investing & Trading Score from previous trading session is 38 and hence a deterioration of trend.
| ||||||||
Here are the Smart Investing & Trading Scores of the most requested mid cap stocks at 12Stocks.com (click stock name for detailed review):
|


| 12Stocks.com: Top Performing Mid Cap Index Stocks | ||||||||||||||||||||||||||||||||||||||||||||||||
 The top performing Mid Cap Index stocks year to date are
Now, more recently, over last week, the top performing Mid Cap Index stocks on the move are


|
||||||||||||||||||||||||||||||||||||||||||||||||
| 12Stocks.com: Investing in Midcap Index with Stocks | |
|
The following table helps investors and traders sort through current performance and trends (as measured by Smart Investing & Trading Score) of various
stocks in the Midcap Index. Quick View: Move mouse or cursor over stock symbol (ticker) to view short-term technical chart and over stock name to view long term chart. Click on  to add stock symbol to your watchlist and to add stock symbol to your watchlist and  to view watchlist. Click on any ticker or stock name for detailed market intelligence report for that stock. to view watchlist. Click on any ticker or stock name for detailed market intelligence report for that stock. |
12Stocks.com Performance of Stocks in Midcap Index
| Ticker | Stock Name | Watchlist | Category | Recent Price | Smart Investing & Trading Score | Change % | YTD Change% |
| NSA | National Storage |   | Financials | 35.55 | 62 | 1.46% | -14.28% |
| SON | Sonoco Products | | Consumer Staples | 56.71 | 62 | 1.18% | 1.50% |
| ICUI | ICU Medical | | Health Care | 98.29 | 62 | 0.38% | -1.45% |
| CMA | Comerica | | Financials | 51.21 | 61 | 2.07% | -8.24% |
| A | Agilent Technologies | | Health Care | 138.69 | 61 | 1.20% | -0.24% |
| FSLR | First Solar | | Technology | 177.58 | 61 | 0.73% | 3.08% |
| HOLX | Hologic | | Health Care | 76.28 | 61 | 0.67% | 6.76% |
| TXRH | Texas Roadhouse | | Services & Goods | 157.06 | 61 | -2.31% | 28.50% |
| OWL | Blue Owl | | Financials | 18.72 | 61 | -0.90% | 25.72% |
| EHC | Encompass Health | | Health Care | 82.88 | 61 | -0.60% | 24.22% |
| ZI | ZoomInfo Technologies | | Technology | 16.36 | 60 | 3.15% | -11.52% |
| IRM | Iron Mountain | | Technology | 78.10 | 60 | 0.75% | 11.60% |
| AVY | Avery Dennison | | Consumer Staples | 217.83 | 60 | 0.25% | 7.75% |
| EXR | Extra Space | | Financials | 138.70 | 59 | 3.29% | -13.49% |
| LBRDK | Liberty Broadband | | Services & Goods | 50.92 | 59 | 2.39% | -36.82% |
| INCY | yte | | Health Care | 52.94 | 59 | 1.71% | -15.69% |
| OLPX | Olaplex | | Services & Goods | 1.40 | 59 | 1.45% | -45.31% |
| ILMN | Illumina | | Health Care | 124.68 | 59 | 1.32% | -10.46% |
| REG | Regency Centers | | Financials | 59.11 | 59 | -0.19% | -11.78% |
| WTFC | Wintrust Financial | | Financials | 98.12 | 58 | 1.53% | 5.79% |
| CNXC | Concentrix | | Technology | 55.30 | 58 | 1.15% | -43.69% |
| EXAS | Exact Sciences | | Health Care | 60.01 | 58 | 1.11% | -18.88% |
| TOL | Toll Brothers | | Industrials | 119.52 | 58 | 0.34% | 16.28% |
| ROL | Rollins | | Services & Goods | 44.68 | 58 | 0.27% | 2.31% |
| AL | Air Lease | | Transports | 50.29 | 58 | 0.10% | 19.91% |
| For chart view version of above stock list: Chart View ➞ 0 - 25 , 25 - 50 , 50 - 75 , 75 - 100 , 100 - 125 , 125 - 150 , 150 - 175 , 175 - 200 , 200 - 225 , 225 - 250 , 250 - 275 , 275 - 300 , 300 - 325 , 325 - 350 , 350 - 375 , 375 - 400 , 400 - 425 , 425 - 450 , 450 - 475 , 475 - 500 , 500 - 525 , 525 - 550 , 550 - 575 , 575 - 600 , 600 - 625 , 625 - 650 , 650 - 675 , 675 - 700 , 700 - 725 , 725 - 750 , 750 - 775 | ||
 | Click To Change The Sort Order: By Market Cap or Company Size Performance: Year-to-date, Week and Day |  |
|
Get the most comprehensive stock market coverage daily at 12Stocks.com ➞ Best Stocks Today ➞ Best Stocks Weekly ➞ Best Stocks Year-to-Date ➞ Best Stocks Trends ➞  Best Stocks Today 12Stocks.com Best Nasdaq Stocks ➞ Best S&P 500 Stocks ➞ Best Tech Stocks ➞ Best Biotech Stocks ➞ |
| Detailed Overview of Midcap Stocks |
| Midcap Technical Overview, Leaders & Laggards, Top Midcap ETF Funds & Detailed Midcap Stocks List, Charts, Trends & More |
| Midcap: Technical Analysis, Trends & YTD Performance | |
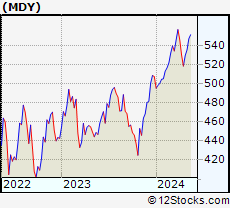
| MidCap segment as represented by
MDY, an exchange-traded fund [ETF], holds basket of about four hundred midcap stocks from across all major sectors of the US stock market. The midcap index (contains stocks like Green Mountain Coffee Roasters and Tractor Supply Company) is up by 3.12% and is currently underperforming the overall market by -1.42% year-to-date. Below is a quick view of technical charts and trends: | |
 MDY Weekly Chart |
|
| Long Term Trend: Not Good | |
| Medium Term Trend: Not Good | |
 MDY Daily Chart |
|
| Short Term Trend: Not Good | |
| Overall Trend Score: 7 | |
| YTD Performance: 3.12% | |
| **Trend Scores & Views Are Only For Educational Purposes And Not For Investing | |
| 12Stocks.com: Investing in Midcap Index using Exchange Traded Funds | |
|
The following table shows list of key exchange traded funds (ETF) that
help investors track Midcap index. The following list also includes leveraged ETF funds that track twice or thrice the daily returns of Midcap indices. Short or inverse ETF funds move in the opposite direction to the index they track and are useful during market pullbacks or during bear markets. Quick View: Move mouse or cursor over ETF symbol (ticker) to view short-term technical chart and over ETF name to view long term chart. Click on ticker or stock name for detailed view. Click on to add stock symbol to your watchlist and to view watchlist. |
12Stocks.com List of ETFs that track Midcap Index
| Ticker | ETF Name | Watchlist | Recent Price | Smart Investing & Trading Score | Change % | Week % | Year-to-date % |
| IJH | iShares Core S&P Mid-Cap | | 57.16 | 7 | 0.05 | -1.14 | 3.12% |
| MDY | SPDR S&P MidCap 400 ETF | | 523.21 | 7 | 0.09 | -1.17 | 3.12% |
| IWR | iShares Russell Mid-Cap | | 79.48 | 7 | -0.18 | -1.29 | 2.25% |
| IWP | iShares Russell Mid-Cap Growth | | 107.46 | 7 | 0.02 | -1.39 | 2.87% |
| IWS | iShares Russell Mid-Cap Value | | 118.77 | 7 | -0.08 | -1.02 | 2.13% |
| IJK | iShares S&P Mid-Cap 400 Growth | | 85.83 | 7 | -0.01 | -1.34 | 8.34% |
| IJJ | iShares S&P Mid-Cap 400 Value | | 111.28 | 22 | 0.20 | -0.85 | -2.42% |
| XMLV | PowerShares S&P MidCap Low Volatil ETF | | 54.70 | 47 | 0.48 | 0.09 | 2.86% |
| MVV | ProShares Ultra MidCap400 | | 59.96 | 17 | 0.12 | -2.39 | 3.58% |
| SMDD | ProShares UltraPro Short MidCap400 | | 12.18 | 88 | -0.21 | 2.99 | -9.5% |
| UMDD | ProShares UltraPro MidCap400 | | 23.14 | 0 | -0.50 | -3.41 | 3.69% |
| MZZ | ProShares UltraShort MidCap400 | | 11.96 | 53 | 1.18 | 2.4 | -4.86% |
| MYY | ProShares Short MidCap400 | | 21.00 | 48 | 0.45 | 1.03 | -2.1% |
| 12Stocks.com: Charts, Trends, Fundamental Data and Performances of MidCap Stocks | |
|
We now take in-depth look at all MidCap stocks including charts, multi-period performances and overall trends (as measured by Smart Investing & Trading Score). One can sort MidCap stocks (click link to choose) by Daily, Weekly and by Year-to-Date performances. Also, one can sort by size of the company or by market capitalization. |
| Select Your Default Chart Type: | |||||
| |||||
| Click on stock symbol or name for detailed view. Click on to add stock symbol to your watchlist and to view watchlist. Quick View: Move mouse or cursor over "Daily" to quickly view daily technical stock chart and over "Weekly" to view weekly technical stock chart. | |||||

 | NSA National Storage Affiliates Trust |
| Sector: Financials | |
| SubSector: REIT - Industrial | |
| MarketCap: 1623.99 Millions | |
| Recent Price: 35.55 Smart Investing & Trading Score: 62 | |
| Day Percent Change: 1.46% Day Change: 0.51 | |
| Week Change: 1.8% Year-to-date Change: -14.3% | |
| NSA Links: Profile News Message Board | |
| Charts:- Daily , Weekly | |
| Add NSA to Watchlist: View: Get Complete NSA Trend Analysis ➞ | |
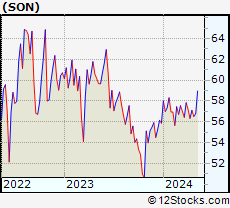 | SON Sonoco Products Company |
| Sector: Consumer Staples | |
| SubSector: Packaging & Containers | |
| MarketCap: 4564.33 Millions | |
| Recent Price: 56.71 Smart Investing & Trading Score: 62 | |
| Day Percent Change: 1.18% Day Change: 0.66 | |
| Week Change: 0.35% Year-to-date Change: 1.5% | |
| SON Links: Profile News Message Board | |
| Charts:- Daily , Weekly | |
| Add SON to Watchlist: View: Get Complete SON Trend Analysis ➞ | |
 | ICUI ICU Medical, Inc. |
| Sector: Health Care | |
| SubSector: Medical Instruments & Supplies | |
| MarketCap: 3640.7 Millions | |
| Recent Price: 98.29 Smart Investing & Trading Score: 62 | |
| Day Percent Change: 0.38% Day Change: 0.37 | |
| Week Change: 3.64% Year-to-date Change: -1.5% | |
| ICUI Links: Profile News Message Board | |
| Charts:- Daily , Weekly | |
| Add ICUI to Watchlist: View: Get Complete ICUI Trend Analysis ➞ | |
 | CMA Comerica Incorporated |
| Sector: Financials | |
| SubSector: Money Center Banks | |
| MarketCap: 4449.49 Millions | |
| Recent Price: 51.21 Smart Investing & Trading Score: 61 | |
| Day Percent Change: 2.07% Day Change: 1.04 | |
| Week Change: -1.65% Year-to-date Change: -8.2% | |
| CMA Links: Profile News Message Board | |
| Charts:- Daily , Weekly | |
| Add CMA to Watchlist: View: Get Complete CMA Trend Analysis ➞ | |
 | A Agilent Technologies, Inc. |
| Sector: Health Care | |
| SubSector: Medical Laboratories & Research | |
| MarketCap: 22337.9 Millions | |
| Recent Price: 138.69 Smart Investing & Trading Score: 61 | |
| Day Percent Change: 1.20% Day Change: 1.65 | |
| Week Change: 0.69% Year-to-date Change: -0.2% | |
| A Links: Profile News Message Board | |
| Charts:- Daily , Weekly | |
| Add A to Watchlist: View: Get Complete A Trend Analysis ➞ | |
 | FSLR First Solar, Inc. |
| Sector: Technology | |
| SubSector: Semiconductor - Specialized | |
| MarketCap: 3617.9 Millions | |
| Recent Price: 177.58 Smart Investing & Trading Score: 61 | |
| Day Percent Change: 0.73% Day Change: 1.28 | |
| Week Change: -0.64% Year-to-date Change: 3.1% | |
| FSLR Links: Profile News Message Board | |
| Charts:- Daily , Weekly | |
| Add FSLR to Watchlist: View: Get Complete FSLR Trend Analysis ➞ | |
 | HOLX Hologic, Inc. |
| Sector: Health Care | |
| SubSector: Medical Instruments & Supplies | |
| MarketCap: 9075.2 Millions | |
| Recent Price: 76.28 Smart Investing & Trading Score: 61 | |
| Day Percent Change: 0.67% Day Change: 0.51 | |
| Week Change: 0.39% Year-to-date Change: 6.8% | |
| HOLX Links: Profile News Message Board | |
| Charts:- Daily , Weekly | |
| Add HOLX to Watchlist: View: Get Complete HOLX Trend Analysis ➞ | |
 | TXRH Texas Roadhouse, Inc. |
| Sector: Services & Goods | |
| SubSector: Restaurants | |
| MarketCap: 2569.4 Millions | |
| Recent Price: 157.06 Smart Investing & Trading Score: 61 | |
| Day Percent Change: -2.31% Day Change: -3.72 | |
| Week Change: -0.25% Year-to-date Change: 28.5% | |
| TXRH Links: Profile News Message Board | |
| Charts:- Daily , Weekly | |
| Add TXRH to Watchlist: View: Get Complete TXRH Trend Analysis ➞ | |
 | OWL Blue Owl Capital Inc. |
| Sector: Financials | |
| SubSector: Asset Management | |
| MarketCap: 16240 Millions | |
| Recent Price: 18.72 Smart Investing & Trading Score: 61 | |
| Day Percent Change: -0.90% Day Change: -0.17 | |
| Week Change: -0.37% Year-to-date Change: 25.7% | |
| OWL Links: Profile News Message Board | |
| Charts:- Daily , Weekly | |
| Add OWL to Watchlist: View: Get Complete OWL Trend Analysis ➞ | |
 | EHC Encompass Health Corporation |
| Sector: Health Care | |
| SubSector: Hospitals | |
| MarketCap: 5384.06 Millions | |
| Recent Price: 82.88 Smart Investing & Trading Score: 61 | |
| Day Percent Change: -0.60% Day Change: -0.50 | |
| Week Change: 0.5% Year-to-date Change: 24.2% | |
| EHC Links: Profile News Message Board | |
| Charts:- Daily , Weekly | |
| Add EHC to Watchlist: View: Get Complete EHC Trend Analysis ➞ | |
 | ZI ZoomInfo Technologies Inc. |
| Sector: Technology | |
| SubSector: Software Application | |
| MarketCap: 15937 Millions | |
| Recent Price: 16.36 Smart Investing & Trading Score: 60 | |
| Day Percent Change: 3.15% Day Change: 0.50 | |
| Week Change: -0.06% Year-to-date Change: -11.5% | |
| ZI Links: Profile News Message Board | |
| Charts:- Daily , Weekly | |
| Add ZI to Watchlist: View: Get Complete ZI Trend Analysis ➞ | |
 | IRM Iron Mountain Incorporated |
| Sector: Technology | |
| SubSector: Business Software & Services | |
| MarketCap: 7339.18 Millions | |
| Recent Price: 78.10 Smart Investing & Trading Score: 60 | |
| Day Percent Change: 0.75% Day Change: 0.58 | |
| Week Change: 0.75% Year-to-date Change: 11.6% | |
| IRM Links: Profile News Message Board | |
| Charts:- Daily , Weekly | |
| Add IRM to Watchlist: View: Get Complete IRM Trend Analysis ➞ | |
 | AVY Avery Dennison Corporation |
| Sector: Consumer Staples | |
| SubSector: Business Equipment | |
| MarketCap: 8051.27 Millions | |
| Recent Price: 217.83 Smart Investing & Trading Score: 60 | |
| Day Percent Change: 0.25% Day Change: 0.55 | |
| Week Change: -0.55% Year-to-date Change: 7.8% | |
| AVY Links: Profile News Message Board | |
| Charts:- Daily , Weekly | |
| Add AVY to Watchlist: View: Get Complete AVY Trend Analysis ➞ | |
 | EXR Extra Space Storage Inc. |
| Sector: Financials | |
| SubSector: REIT - Industrial | |
| MarketCap: 11203.9 Millions | |
| Recent Price: 138.70 Smart Investing & Trading Score: 59 | |
| Day Percent Change: 3.29% Day Change: 4.42 | |
| Week Change: 3.92% Year-to-date Change: -13.5% | |
| EXR Links: Profile News Message Board | |
| Charts:- Daily , Weekly | |
| Add EXR to Watchlist: View: Get Complete EXR Trend Analysis ➞ | |
 | LBRDK Liberty Broadband Corporation |
| Sector: Services & Goods | |
| SubSector: Broadcasting - TV | |
| MarketCap: 13847.3 Millions | |
| Recent Price: 50.92 Smart Investing & Trading Score: 59 | |
| Day Percent Change: 2.39% Day Change: 1.19 | |
| Week Change: 3.39% Year-to-date Change: -36.8% | |
| LBRDK Links: Profile News Message Board | |
| Charts:- Daily , Weekly | |
| Add LBRDK to Watchlist: View: Get Complete LBRDK Trend Analysis ➞ | |
 | INCY Incyte Corporation |
| Sector: Health Care | |
| SubSector: Biotechnology | |
| MarketCap: 15343.2 Millions | |
| Recent Price: 52.94 Smart Investing & Trading Score: 59 | |
| Day Percent Change: 1.71% Day Change: 0.89 | |
| Week Change: 2.44% Year-to-date Change: -15.7% | |
| INCY Links: Profile News Message Board | |
| Charts:- Daily , Weekly | |
| Add INCY to Watchlist: View: Get Complete INCY Trend Analysis ➞ | |
 | OLPX Olaplex Holdings, Inc. |
| Sector: Services & Goods | |
| SubSector: Specialty Retail | |
| MarketCap: 2340 Millions | |
| Recent Price: 1.40 Smart Investing & Trading Score: 59 | |
| Day Percent Change: 1.45% Day Change: 0.02 | |
| Week Change: 4.48% Year-to-date Change: -45.3% | |
| OLPX Links: Profile News Message Board | |
| Charts:- Daily , Weekly | |
| Add OLPX to Watchlist: View: Get Complete OLPX Trend Analysis ➞ | |
 | ILMN Illumina, Inc. |
| Sector: Health Care | |
| SubSector: Biotechnology | |
| MarketCap: 39194.3 Millions | |
| Recent Price: 124.68 Smart Investing & Trading Score: 59 | |
| Day Percent Change: 1.32% Day Change: 1.63 | |
| Week Change: 1.96% Year-to-date Change: -10.5% | |
| ILMN Links: Profile News Message Board | |
| Charts:- Daily , Weekly | |
| Add ILMN to Watchlist: View: Get Complete ILMN Trend Analysis ➞ | |
 | REG Regency Centers Corporation |
| Sector: Financials | |
| SubSector: REIT - Retail | |
| MarketCap: 6345.84 Millions | |
| Recent Price: 59.11 Smart Investing & Trading Score: 59 | |
| Day Percent Change: -0.19% Day Change: -0.11 | |
| Week Change: 1.42% Year-to-date Change: -11.8% | |
| REG Links: Profile News Message Board | |
| Charts:- Daily , Weekly | |
| Add REG to Watchlist: View: Get Complete REG Trend Analysis ➞ | |
 | WTFC Wintrust Financial Corporation |
| Sector: Financials | |
| SubSector: Regional - Midwest Banks | |
| MarketCap: 1942.6 Millions | |
| Recent Price: 98.12 Smart Investing & Trading Score: 58 | |
| Day Percent Change: 1.53% Day Change: 1.48 | |
| Week Change: -0.9% Year-to-date Change: 5.8% | |
| WTFC Links: Profile News Message Board | |
| Charts:- Daily , Weekly | |
| Add WTFC to Watchlist: View: Get Complete WTFC Trend Analysis ➞ | |
 | CNXC Concentrix Corporation |
| Sector: Technology | |
| SubSector: Information Technology Services | |
| MarketCap: 51987 Millions | |
| Recent Price: 55.30 Smart Investing & Trading Score: 58 | |
| Day Percent Change: 1.15% Day Change: 0.63 | |
| Week Change: 0.53% Year-to-date Change: -43.7% | |
| CNXC Links: Profile News Message Board | |
| Charts:- Daily , Weekly | |
| Add CNXC to Watchlist: View: Get Complete CNXC Trend Analysis ➞ | |
 | EXAS Exact Sciences Corporation |
| Sector: Health Care | |
| SubSector: Medical Laboratories & Research | |
| MarketCap: 8572 Millions | |
| Recent Price: 60.01 Smart Investing & Trading Score: 58 | |
| Day Percent Change: 1.11% Day Change: 0.66 | |
| Week Change: 1.97% Year-to-date Change: -18.9% | |
| EXAS Links: Profile News Message Board | |
| Charts:- Daily , Weekly | |
| Add EXAS to Watchlist: View: Get Complete EXAS Trend Analysis ➞ | |
 | TOL Toll Brothers, Inc. |
| Sector: Industrials | |
| SubSector: Residential Construction | |
| MarketCap: 2278.26 Millions | |
| Recent Price: 119.52 Smart Investing & Trading Score: 58 | |
| Day Percent Change: 0.34% Day Change: 0.41 | |
| Week Change: -0.58% Year-to-date Change: 16.3% | |
| TOL Links: Profile News Message Board | |
| Charts:- Daily , Weekly | |
| Add TOL to Watchlist: View: Get Complete TOL Trend Analysis ➞ | |
 | ROL Rollins, Inc. |
| Sector: Services & Goods | |
| SubSector: Business Services | |
| MarketCap: 12827.4 Millions | |
| Recent Price: 44.68 Smart Investing & Trading Score: 58 | |
| Day Percent Change: 0.27% Day Change: 0.12 | |
| Week Change: -0.49% Year-to-date Change: 2.3% | |
| ROL Links: Profile News Message Board | |
| Charts:- Daily , Weekly | |
| Add ROL to Watchlist: View: Get Complete ROL Trend Analysis ➞ | |
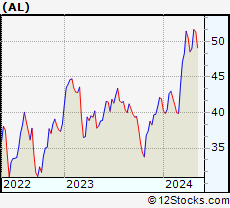 | AL Air Lease Corporation |
| Sector: Transports | |
| SubSector: Rental & Leasing Services | |
| MarketCap: 2586.44 Millions | |
| Recent Price: 50.29 Smart Investing & Trading Score: 58 | |
| Day Percent Change: 0.10% Day Change: 0.05 | |
| Week Change: -2.65% Year-to-date Change: 19.9% | |
| AL Links: Profile News Message Board | |
| Charts:- Daily , Weekly | |
| Add AL to Watchlist: View: Get Complete AL Trend Analysis ➞ | |
| For tabular summary view of above stock list: Summary View ➞ 0 - 25 , 25 - 50 , 50 - 75 , 75 - 100 , 100 - 125 , 125 - 150 , 150 - 175 , 175 - 200 , 200 - 225 , 225 - 250 , 250 - 275 , 275 - 300 , 300 - 325 , 325 - 350 , 350 - 375 , 375 - 400 , 400 - 425 , 425 - 450 , 450 - 475 , 475 - 500 , 500 - 525 , 525 - 550 , 550 - 575 , 575 - 600 , 600 - 625 , 625 - 650 , 650 - 675 , 675 - 700 , 700 - 725 , 725 - 750 , 750 - 775 | ||
| Click To Change The Sort Order: By Market Cap or Company Size Performance: Year-to-date, Week and Day | |
| Select Chart Type: | ||
|
Best Stocks Today 12Stocks.com |
© 2024 12Stocks.com Terms & Conditions Privacy Contact Us
All Information Provided Only For Education And Not To Be Used For Investing or Trading. See Terms & Conditions


One More Thing ... Get Best Stocks Delivered Daily!
Never Ever Miss A Move With Our Top Ten Stocks Lists
Find Best Stocks In Any Market - Bull or Bear Market
Take A Peek At Our Top Ten Stocks Lists: Daily, Weekly, Year-to-Date & Top Trends
Find Best Stocks In Any Market - Bull or Bear Market
Take A Peek At Our Top Ten Stocks Lists: Daily, Weekly, Year-to-Date & Top Trends
Midcap Stocks With Best Up Trends [0-bearish to 100-bullish]: Pinterest [100], Garmin [100], Brookfield Renewable[100], Amcor [100], United [100], Axalta Coating[100], DuPont de[100], Clean Harbors[100], Equitable [100], Columbia Banking[100], Playtika Holding[100]
Best Midcap Stocks Year-to-Date:
Vistra Energy[99.53%], AppLovin [76.53%], ShockWave Medical[73.09%], EMCOR [64.9%], Constellation Energy[57.66%], CAVA [56.42%], Tenet [53.43%], Spotify [51.42%], Natera [50.3%], Wingstop [49.65%], Antero Resources[44%] Best Midcap Stocks This Week:
Tenet [20.62%], Pinterest [19.2%], Bio-Techne [14.67%], New York[14.48%], Garmin [13.92%], Sensata Technologies[11.46%], Brookfield Renewable[10.3%], Woodward [10.15%], Axalta Coating[9.58%], Maravai LifeSciences[9.35%], Amcor [9.25%] Best Midcap Stocks Daily:
New York[28.30%], Pinterest [21.02%], Bio-Techne [16.22%], Garmin [13.12%], Brookfield Renewable[10.63%], Amcor [9.62%], United [8.88%], Axalta Coating[8.81%], DuPont de[8.01%], Clean Harbors[6.81%], Verisk Analytics[6.81%]