
 Login Sign Up


| |||||
 |  | ||||

| 12Stocks.com Market Intelligence |
Best MidCap Stocks
|
| In a hurry? Mid Cap Stocks Lists: Performance Trends Table, Stock Charts
Sort midcap stocks: Daily, Weekly, Year-to-Date, Market Cap & Trends. Filter midcap stocks list by sector: Show all, Tech, Finance, Energy, Staples, Retail, Industrial, Materials, Utilities and HealthCare Filter midcap stocks list by size:All MidCap Large Mid-Range Small |
| 12Stocks.com Mid Cap Stocks Performances & Trends Daily | |||||||||
|
|  The overall Smart Investing & Trading Score is 85 (0-bearish to 100-bullish) which puts Mid Cap index in short term bullish trend. The Smart Investing & Trading Score from previous trading session is 45 and hence an improvement of trend.
| ||||||||
Here are the Smart Investing & Trading Scores of the most requested mid cap stocks at 12Stocks.com (click stock name for detailed review):
|


| 12Stocks.com: Top Performing Mid Cap Index Stocks | ||||||||||||||||||||||||||||||||||||||||||||||||
 The top performing Mid Cap Index stocks year to date are
Now, more recently, over last week, the top performing Mid Cap Index stocks on the move are


|
||||||||||||||||||||||||||||||||||||||||||||||||
| 12Stocks.com: Investing in Midcap Index with Stocks | |
|
The following table helps investors and traders sort through current performance and trends (as measured by Smart Investing & Trading Score) of various
stocks in the Midcap Index. Quick View: Move mouse or cursor over stock symbol (ticker) to view short-term technical chart and over stock name to view long term chart. Click on  to add stock symbol to your watchlist and to add stock symbol to your watchlist and  to view watchlist. Click on any ticker or stock name for detailed market intelligence report for that stock. to view watchlist. Click on any ticker or stock name for detailed market intelligence report for that stock. |
12Stocks.com Performance of Stocks in Midcap Index
| Ticker | Stock Name | Watchlist | Category | Recent Price | Smart Investing & Trading Score | Change % | YTD Change% |
| LSXMA | Liberty SiriusXM |   | Services & Goods | 25.13 | 42 | 1.45% | -12.56% |
| COLD | Americold Realty | | Financials | 22.70 | 42 | 1.34% | -25.01% |
| LSXMK | Liberty SiriusXM | | Services & Goods | 25.05 | 42 | 1.09% | -12.96% |
| PFGC | Performance Food | | Services & Goods | 69.21 | 42 | 1.05% | 0.09% |
| EXPD | Expeditors | | Transports | 114.96 | 42 | 0.92% | -9.62% |
| ODFL | Old Dominion | | Transports | 185.06 | 42 | 0.91% | -54.34% |
| EGP | East Properties | | Financials | 159.86 | 42 | 0.85% | -12.90% |
| RHI | Robert Half | | Services & Goods | 70.16 | 42 | 0.83% | -20.20% |
| STAG | STAG Industrial | | Financials | 35.22 | 42 | 0.71% | -10.29% |
| JBHT | J.B. Hunt | | Transports | 165.56 | 42 | 0.60% | -17.11% |
| RGEN | Repligen | | Health Care | 167.05 | 42 | 0.44% | -7.09% |
| ZS | Zscaler | | Technology | 177.11 | 42 | 0.42% | -20.06% |
| GTLB | GitLab | | Technology | 54.56 | 42 | 0.37% | -13.90% |
| BIO | Bio-Rad | | Health Care | 279.83 | 42 | 0.19% | -13.34% |
| MAT | Mattel | | Consumer Staples | 18.45 | 42 | 0.11% | -2.28% |
| DV | DoubleVerify | | Technology | 30.37 | 42 | 0.10% | -17.43% |
| KNX | Knight-Swift Transportation | | Transports | 47.07 | 42 | 0.00% | -18.35% |
| CNHI | CNH Industrial | | Industrials | 11.48 | 42 | -1.71% | -5.75% |
| WOOF | Petco Health | | Services & Goods | 1.55 | 42 | -1.27% | -50.95% |
| CFR | Cullen/Frost Bankers | | Financials | 105.93 | 42 | -0.49% | -2.36% |
| TDY | Teledyne Technologies | | Technology | 385.34 | 42 | -0.07% | -13.66% |
| APLS | Apellis | | Health Care | 47.46 | 42 | -0.06% | -20.72% |
| CTSH | Cognizant | | Technology | 66.25 | 42 | -0.03% | -12.29% |
| ALL | Allstate | | Financials | 168.18 | 41 | -0.59% | 20.15% |
| DBX | Dropbox | | Technology | 23.37 | 40 | -0.93% | -20.73% |
| For chart view version of above stock list: Chart View ➞ 0 - 25 , 25 - 50 , 50 - 75 , 75 - 100 , 100 - 125 , 125 - 150 , 150 - 175 , 175 - 200 , 200 - 225 , 225 - 250 , 250 - 275 , 275 - 300 , 300 - 325 , 325 - 350 , 350 - 375 , 375 - 400 , 400 - 425 , 425 - 450 , 450 - 475 , 475 - 500 , 500 - 525 , 525 - 550 , 550 - 575 , 575 - 600 , 600 - 625 , 625 - 650 , 650 - 675 , 675 - 700 , 700 - 725 , 725 - 750 , 750 - 775 | ||
 | Click To Change The Sort Order: By Market Cap or Company Size Performance: Year-to-date, Week and Day |  |
|
Get the most comprehensive stock market coverage daily at 12Stocks.com ➞ Best Stocks Today ➞ Best Stocks Weekly ➞ Best Stocks Year-to-Date ➞ Best Stocks Trends ➞  Best Stocks Today 12Stocks.com Best Nasdaq Stocks ➞ Best S&P 500 Stocks ➞ Best Tech Stocks ➞ Best Biotech Stocks ➞ |
| Detailed Overview of Midcap Stocks |
| Midcap Technical Overview, Leaders & Laggards, Top Midcap ETF Funds & Detailed Midcap Stocks List, Charts, Trends & More |
| Midcap: Technical Analysis, Trends & YTD Performance | |
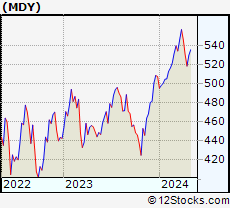
| MidCap segment as represented by
MDY, an exchange-traded fund [ETF], holds basket of about four hundred midcap stocks from across all major sectors of the US stock market. The midcap index (contains stocks like Green Mountain Coffee Roasters and Tractor Supply Company) is up by 5.52% and is currently underperforming the overall market by -1.36% year-to-date. Below is a quick view of technical charts and trends: | |
 MDY Weekly Chart |
|
| Long Term Trend: Good | |
| Medium Term Trend: Good | |
 MDY Daily Chart |
|
| Short Term Trend: Very Good | |
| Overall Trend Score: 85 | |
| YTD Performance: 5.52% | |
| **Trend Scores & Views Are Only For Educational Purposes And Not For Investing | |
| 12Stocks.com: Investing in Midcap Index using Exchange Traded Funds | |
|
The following table shows list of key exchange traded funds (ETF) that
help investors track Midcap index. The following list also includes leveraged ETF funds that track twice or thrice the daily returns of Midcap indices. Short or inverse ETF funds move in the opposite direction to the index they track and are useful during market pullbacks or during bear markets. Quick View: Move mouse or cursor over ETF symbol (ticker) to view short-term technical chart and over ETF name to view long term chart. Click on ticker or stock name for detailed view. Click on to add stock symbol to your watchlist and to view watchlist. |
12Stocks.com List of ETFs that track Midcap Index
| Ticker | ETF Name | Watchlist | Recent Price | Smart Investing & Trading Score | Change % | Week % | Year-to-date % |
| IJH | iShares Core S&P Mid-Cap | | 58.53 | 85 | 1.05 | 1.23 | 5.59% |
| IWR | iShares Russell Mid-Cap | | 80.78 | 60 | 0.72 | 0.32 | 3.92% |
| MDY | SPDR S&P MidCap 400 ETF | | 535.41 | 85 | 1.01 | 1.14 | 5.52% |
| IWP | iShares Russell Mid-Cap Growth | | 108.75 | 39 | 0.54 | -0.21 | 4.11% |
| IJK | iShares S&P Mid-Cap 400 Growth | | 87.89 | 78 | 1.02 | 1.02 | 10.94% |
| IWS | iShares Russell Mid-Cap Value | | 120.70 | 78 | 0.80 | 0.59 | 3.79% |
| IJJ | iShares S&P Mid-Cap 400 Value | | 113.77 | 90 | 0.96 | 1.37 | -0.24% |
| XMLV | PowerShares S&P MidCap Low Volatil ETF | | 55.50 | 100 | 0.62 | 1.56 | 4.36% |
| SMDD | ProShares UltraPro Short MidCap400 | | 11.45 | 10 | -2.82 | -3.23 | -14.97% |
| MVV | ProShares Ultra MidCap400 | | 62.72 | 85 | 2.37 | 2.1 | 8.34% |
| UMDD | ProShares UltraPro MidCap400 | | 24.68 | 85 | 3.08 | 3 | 10.56% |
| MYY | ProShares Short MidCap400 | | 20.57 | 28 | -0.76 | -1.04 | -4.11% |
| MZZ | ProShares UltraShort MidCap400 | | 11.46 | 20 | -2.05 | -1.88 | -8.84% |
| 12Stocks.com: Charts, Trends, Fundamental Data and Performances of MidCap Stocks | |
|
We now take in-depth look at all MidCap stocks including charts, multi-period performances and overall trends (as measured by Smart Investing & Trading Score). One can sort MidCap stocks (click link to choose) by Daily, Weekly and by Year-to-Date performances. Also, one can sort by size of the company or by market capitalization. |
| Select Your Default Chart Type: | |||||
| |||||
| Click on stock symbol or name for detailed view. Click on to add stock symbol to your watchlist and to view watchlist. Quick View: Move mouse or cursor over "Daily" to quickly view daily technical stock chart and over "Weekly" to view weekly technical stock chart. | |||||

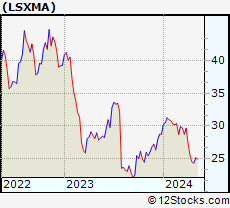 | LSXMA The Liberty SiriusXM Group |
| Sector: Services & Goods | |
| SubSector: Broadcasting - Radio | |
| MarketCap: 14414.5 Millions | |
| Recent Price: 25.13 Smart Investing & Trading Score: 42 | |
| Day Percent Change: 1.45% Day Change: 0.36 | |
| Week Change: 3.37% Year-to-date Change: -12.6% | |
| LSXMA Links: Profile News Message Board | |
| Charts:- Daily , Weekly | |
| Add LSXMA to Watchlist: View: Get Complete LSXMA Trend Analysis ➞ | |
 | COLD Americold Realty Trust |
| Sector: Financials | |
| SubSector: REIT - Industrial | |
| MarketCap: 6569.69 Millions | |
| Recent Price: 22.70 Smart Investing & Trading Score: 42 | |
| Day Percent Change: 1.34% Day Change: 0.30 | |
| Week Change: 2.07% Year-to-date Change: -25.0% | |
| COLD Links: Profile News Message Board | |
| Charts:- Daily , Weekly | |
| Add COLD to Watchlist: View: Get Complete COLD Trend Analysis ➞ | |
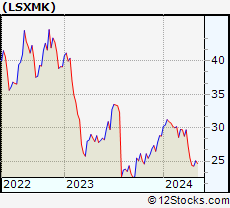 | LSXMK The Liberty SiriusXM Group |
| Sector: Services & Goods | |
| SubSector: Broadcasting - Radio | |
| MarketCap: 5183.95 Millions | |
| Recent Price: 25.05 Smart Investing & Trading Score: 42 | |
| Day Percent Change: 1.09% Day Change: 0.27 | |
| Week Change: 3.21% Year-to-date Change: -13.0% | |
| LSXMK Links: Profile News Message Board | |
| Charts:- Daily , Weekly | |
| Add LSXMK to Watchlist: View: Get Complete LSXMK Trend Analysis ➞ | |
 | PFGC Performance Food Group Company |
| Sector: Services & Goods | |
| SubSector: Restaurants | |
| MarketCap: 2457.5 Millions | |
| Recent Price: 69.21 Smart Investing & Trading Score: 42 | |
| Day Percent Change: 1.05% Day Change: 0.72 | |
| Week Change: 0.52% Year-to-date Change: 0.1% | |
| PFGC Links: Profile News Message Board | |
| Charts:- Daily , Weekly | |
| Add PFGC to Watchlist: View: Get Complete PFGC Trend Analysis ➞ | |
 | EXPD Expeditors International of Washington, Inc. |
| Sector: Transports | |
| SubSector: Air Delivery & Freight Services | |
| MarketCap: 10129.8 Millions | |
| Recent Price: 114.96 Smart Investing & Trading Score: 42 | |
| Day Percent Change: 0.92% Day Change: 1.05 | |
| Week Change: 1.47% Year-to-date Change: -9.6% | |
| EXPD Links: Profile News Message Board | |
| Charts:- Daily , Weekly | |
| Add EXPD to Watchlist: View: Get Complete EXPD Trend Analysis ➞ | |
 | ODFL Old Dominion Freight Line, Inc. |
| Sector: Transports | |
| SubSector: Trucking | |
| MarketCap: 14457.5 Millions | |
| Recent Price: 185.06 Smart Investing & Trading Score: 42 | |
| Day Percent Change: 0.91% Day Change: 1.66 | |
| Week Change: 1.45% Year-to-date Change: -54.3% | |
| ODFL Links: Profile News Message Board | |
| Charts:- Daily , Weekly | |
| Add ODFL to Watchlist: View: Get Complete ODFL Trend Analysis ➞ | |
 | EGP EastGroup Properties, Inc. |
| Sector: Financials | |
| SubSector: REIT - Industrial | |
| MarketCap: 4034.29 Millions | |
| Recent Price: 159.86 Smart Investing & Trading Score: 42 | |
| Day Percent Change: 0.85% Day Change: 1.34 | |
| Week Change: 2.53% Year-to-date Change: -12.9% | |
| EGP Links: Profile News Message Board | |
| Charts:- Daily , Weekly | |
| Add EGP to Watchlist: View: Get Complete EGP Trend Analysis ➞ | |
 | RHI Robert Half International Inc. |
| Sector: Services & Goods | |
| SubSector: Staffing & Outsourcing Services | |
| MarketCap: 4302 Millions | |
| Recent Price: 70.16 Smart Investing & Trading Score: 42 | |
| Day Percent Change: 0.83% Day Change: 0.58 | |
| Week Change: 1.17% Year-to-date Change: -20.2% | |
| RHI Links: Profile News Message Board | |
| Charts:- Daily , Weekly | |
| Add RHI to Watchlist: View: Get Complete RHI Trend Analysis ➞ | |
 | STAG STAG Industrial, Inc. |
| Sector: Financials | |
| SubSector: REIT - Industrial | |
| MarketCap: 3767.49 Millions | |
| Recent Price: 35.22 Smart Investing & Trading Score: 42 | |
| Day Percent Change: 0.71% Day Change: 0.25 | |
| Week Change: 2.15% Year-to-date Change: -10.3% | |
| STAG Links: Profile News Message Board | |
| Charts:- Daily , Weekly | |
| Add STAG to Watchlist: View: Get Complete STAG Trend Analysis ➞ | |
 | JBHT J.B. Hunt Transport Services, Inc. |
| Sector: Transports | |
| SubSector: Trucking | |
| MarketCap: 9074 Millions | |
| Recent Price: 165.56 Smart Investing & Trading Score: 42 | |
| Day Percent Change: 0.60% Day Change: 0.99 | |
| Week Change: 2.19% Year-to-date Change: -17.1% | |
| JBHT Links: Profile News Message Board | |
| Charts:- Daily , Weekly | |
| Add JBHT to Watchlist: View: Get Complete JBHT Trend Analysis ➞ | |
 | RGEN Repligen Corporation |
| Sector: Health Care | |
| SubSector: Biotechnology | |
| MarketCap: 4711.75 Millions | |
| Recent Price: 167.05 Smart Investing & Trading Score: 42 | |
| Day Percent Change: 0.44% Day Change: 0.74 | |
| Week Change: 0.28% Year-to-date Change: -7.1% | |
| RGEN Links: Profile News Message Board | |
| Charts:- Daily , Weekly | |
| Add RGEN to Watchlist: View: Get Complete RGEN Trend Analysis ➞ | |
 | ZS Zscaler, Inc. |
| Sector: Technology | |
| SubSector: Security Software & Services | |
| MarketCap: 7532.17 Millions | |
| Recent Price: 177.11 Smart Investing & Trading Score: 42 | |
| Day Percent Change: 0.42% Day Change: 0.74 | |
| Week Change: 0.03% Year-to-date Change: -20.1% | |
| ZS Links: Profile News Message Board | |
| Charts:- Daily , Weekly | |
| Add ZS to Watchlist: View: Get Complete ZS Trend Analysis ➞ | |
 | GTLB GitLab Inc. |
| Sector: Technology | |
| SubSector: Software - Application | |
| MarketCap: 7840 Millions | |
| Recent Price: 54.56 Smart Investing & Trading Score: 42 | |
| Day Percent Change: 0.37% Day Change: 0.20 | |
| Week Change: -1.62% Year-to-date Change: -13.9% | |
| GTLB Links: Profile News Message Board | |
| Charts:- Daily , Weekly | |
| Add GTLB to Watchlist: View: Get Complete GTLB Trend Analysis ➞ | |
 | BIO Bio-Rad Laboratories, Inc. |
| Sector: Health Care | |
| SubSector: Medical Laboratories & Research | |
| MarketCap: 10660 Millions | |
| Recent Price: 279.83 Smart Investing & Trading Score: 42 | |
| Day Percent Change: 0.19% Day Change: 0.52 | |
| Week Change: 1.41% Year-to-date Change: -13.3% | |
| BIO Links: Profile News Message Board | |
| Charts:- Daily , Weekly | |
| Add BIO to Watchlist: View: Get Complete BIO Trend Analysis ➞ | |
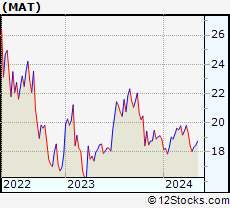 | MAT Mattel, Inc. |
| Sector: Consumer Staples | |
| SubSector: Toys & Games | |
| MarketCap: 2915.8 Millions | |
| Recent Price: 18.45 Smart Investing & Trading Score: 42 | |
| Day Percent Change: 0.11% Day Change: 0.02 | |
| Week Change: 0.6% Year-to-date Change: -2.3% | |
| MAT Links: Profile News Message Board | |
| Charts:- Daily , Weekly | |
| Add MAT to Watchlist: View: Get Complete MAT Trend Analysis ➞ | |
 | DV DoubleVerify Holdings, Inc. |
| Sector: Technology | |
| SubSector: Software - Application | |
| MarketCap: 6500 Millions | |
| Recent Price: 30.37 Smart Investing & Trading Score: 42 | |
| Day Percent Change: 0.10% Day Change: 0.03 | |
| Week Change: 0.46% Year-to-date Change: -17.4% | |
| DV Links: Profile News Message Board | |
| Charts:- Daily , Weekly | |
| Add DV to Watchlist: View: Get Complete DV Trend Analysis ➞ | |
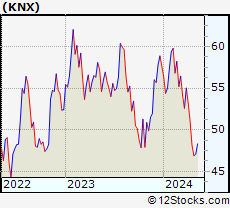 | KNX Knight-Swift Transportation Holdings Inc. |
| Sector: Transports | |
| SubSector: Trucking | |
| MarketCap: 5602.95 Millions | |
| Recent Price: 47.07 Smart Investing & Trading Score: 42 | |
| Day Percent Change: 0.00% Day Change: 0.00 | |
| Week Change: 0.38% Year-to-date Change: -18.4% | |
| KNX Links: Profile News Message Board | |
| Charts:- Daily , Weekly | |
| Add KNX to Watchlist: View: Get Complete KNX Trend Analysis ➞ | |
 | CNHI CNH Industrial N.V. |
| Sector: Industrials | |
| SubSector: Farm & Construction Machinery | |
| MarketCap: 9366.57 Millions | |
| Recent Price: 11.48 Smart Investing & Trading Score: 42 | |
| Day Percent Change: -1.71% Day Change: -0.20 | |
| Week Change: 0.61% Year-to-date Change: -5.8% | |
| CNHI Links: Profile News Message Board | |
| Charts:- Daily , Weekly | |
| Add CNHI to Watchlist: View: Get Complete CNHI Trend Analysis ➞ | |
 | WOOF Petco Health and Wellness Company, Inc. |
| Sector: Services & Goods | |
| SubSector: Specialty Retail | |
| MarketCap: 2030 Millions | |
| Recent Price: 1.55 Smart Investing & Trading Score: 42 | |
| Day Percent Change: -1.27% Day Change: -0.02 | |
| Week Change: 2.65% Year-to-date Change: -51.0% | |
| WOOF Links: Profile News Message Board | |
| Charts:- Daily , Weekly | |
| Add WOOF to Watchlist: View: Get Complete WOOF Trend Analysis ➞ | |
 | CFR Cullen/Frost Bankers, Inc. |
| Sector: Financials | |
| SubSector: Regional - Southwest Banks | |
| MarketCap: 3536.75 Millions | |
| Recent Price: 105.93 Smart Investing & Trading Score: 42 | |
| Day Percent Change: -0.49% Day Change: -0.52 | |
| Week Change: -1.07% Year-to-date Change: -2.4% | |
| CFR Links: Profile News Message Board | |
| Charts:- Daily , Weekly | |
| Add CFR to Watchlist: View: Get Complete CFR Trend Analysis ➞ | |
 | TDY Teledyne Technologies Incorporated |
| Sector: Technology | |
| SubSector: Scientific & Technical Instruments | |
| MarketCap: 9360.43 Millions | |
| Recent Price: 385.34 Smart Investing & Trading Score: 42 | |
| Day Percent Change: -0.07% Day Change: -0.26 | |
| Week Change: 2.86% Year-to-date Change: -13.7% | |
| TDY Links: Profile News Message Board | |
| Charts:- Daily , Weekly | |
| Add TDY to Watchlist: View: Get Complete TDY Trend Analysis ➞ | |
 | APLS Apellis Pharmaceuticals, Inc. |
| Sector: Health Care | |
| SubSector: Biotechnology | |
| MarketCap: 2030.95 Millions | |
| Recent Price: 47.46 Smart Investing & Trading Score: 42 | |
| Day Percent Change: -0.06% Day Change: -0.03 | |
| Week Change: -4.81% Year-to-date Change: -20.7% | |
| APLS Links: Profile News Message Board | |
| Charts:- Daily , Weekly | |
| Add APLS to Watchlist: View: Get Complete APLS Trend Analysis ➞ | |
 | CTSH Cognizant Technology Solutions Corporation |
| Sector: Technology | |
| SubSector: Information Technology Services | |
| MarketCap: 26249.7 Millions | |
| Recent Price: 66.25 Smart Investing & Trading Score: 42 | |
| Day Percent Change: -0.03% Day Change: -0.02 | |
| Week Change: -1.03% Year-to-date Change: -12.3% | |
| CTSH Links: Profile News Message Board | |
| Charts:- Daily , Weekly | |
| Add CTSH to Watchlist: View: Get Complete CTSH Trend Analysis ➞ | |
 | ALL The Allstate Corporation |
| Sector: Financials | |
| SubSector: Property & Casualty Insurance | |
| MarketCap: 25916.6 Millions | |
| Recent Price: 168.18 Smart Investing & Trading Score: 41 | |
| Day Percent Change: -0.59% Day Change: -1.00 | |
| Week Change: -1.11% Year-to-date Change: 20.2% | |
| ALL Links: Profile News Message Board | |
| Charts:- Daily , Weekly | |
| Add ALL to Watchlist: View: Get Complete ALL Trend Analysis ➞ | |
 | DBX Dropbox, Inc. |
| Sector: Technology | |
| SubSector: Application Software | |
| MarketCap: 7588.32 Millions | |
| Recent Price: 23.37 Smart Investing & Trading Score: 40 | |
| Day Percent Change: -0.93% Day Change: -0.22 | |
| Week Change: -3.23% Year-to-date Change: -20.7% | |
| DBX Links: Profile News Message Board | |
| Charts:- Daily , Weekly | |
| Add DBX to Watchlist: View: Get Complete DBX Trend Analysis ➞ | |
| For tabular summary view of above stock list: Summary View ➞ 0 - 25 , 25 - 50 , 50 - 75 , 75 - 100 , 100 - 125 , 125 - 150 , 150 - 175 , 175 - 200 , 200 - 225 , 225 - 250 , 250 - 275 , 275 - 300 , 300 - 325 , 325 - 350 , 350 - 375 , 375 - 400 , 400 - 425 , 425 - 450 , 450 - 475 , 475 - 500 , 500 - 525 , 525 - 550 , 550 - 575 , 575 - 600 , 600 - 625 , 625 - 650 , 650 - 675 , 675 - 700 , 700 - 725 , 725 - 750 , 750 - 775 | ||
| Click To Change The Sort Order: By Market Cap or Company Size Performance: Year-to-date, Week and Day | |
| Select Chart Type: | ||
|
Best Stocks Today 12Stocks.com |
© 2024 12Stocks.com Terms & Conditions Privacy Contact Us
All Information Provided Only For Education And Not To Be Used For Investing or Trading. See Terms & Conditions


One More Thing ... Get Best Stocks Delivered Daily!
Never Ever Miss A Move With Our Top Ten Stocks Lists
Find Best Stocks In Any Market - Bull or Bear Market
Take A Peek At Our Top Ten Stocks Lists: Daily, Weekly, Year-to-Date & Top Trends
Find Best Stocks In Any Market - Bull or Bear Market
Take A Peek At Our Top Ten Stocks Lists: Daily, Weekly, Year-to-Date & Top Trends
Midcap Stocks With Best Up Trends [0-bearish to 100-bullish]: GameStop [100], Tandem Diabetes[100], MasTec [100], Frontier [100], Organon [100], First Solar[100], Reinsurance [100], Brookfield Renewable[100], Camden Property[100], Aptiv [100], Texas Roadhouse[100]
Best Midcap Stocks Year-to-Date:
Vistra Energy[111.55%], AppLovin [88.57%], ShockWave Medical[73.37%], EMCOR [68.86%], Constellation Energy[66.35%], CAVA [65.92%], Tenet [59.16%], Spotify [57.56%], Natera [54.82%], Wingstop [51.43%], Tandem Diabetes[51.18%] Best Midcap Stocks This Week:
GameStop [38.4%], Tandem Diabetes[26.9%], Tenet [25.12%], Wayfair [22.26%], Brookfield Renewable[21.71%], Bio-Techne [20.65%], Pinterest [18.99%], New York[18.86%], Olaplex [18.28%], Valmont Industries[17.25%], NovoCure [16.98%] Best Midcap Stocks Daily:
GameStop [29.08%], Tandem Diabetes[22.32%], Ginkgo Bioworks[12.33%], Paylocity Holding[12.05%], MasTec [11.87%], Plug Power[11.84%], Peloton Interactive[9.42%], Universal Display[9.28%], Sunrun [8.68%], Frontier [8.66%], Wayfair [8.44%]