
 Login Sign Up


| |||||
 |  | ||||

| 12Stocks.com Market Intelligence |
Best MidCap Stocks
|
| In a hurry? Mid Cap Stocks Lists: Performance Trends Table, Stock Charts
Sort midcap stocks: Daily, Weekly, Year-to-Date, Market Cap & Trends. Filter midcap stocks list by sector: Show all, Tech, Finance, Energy, Staples, Retail, Industrial, Materials, Utilities and HealthCare Filter midcap stocks list by size:All MidCap Large Mid-Range Small |
| 12Stocks.com Mid Cap Stocks Performances & Trends Daily | |||||||||
|
|  The overall Smart Investing & Trading Score is 7 (0-bearish to 100-bullish) which puts Mid Cap index in short term bearish trend. The Smart Investing & Trading Score from previous trading session is 38 and hence a deterioration of trend.
| ||||||||
Here are the Smart Investing & Trading Scores of the most requested mid cap stocks at 12Stocks.com (click stock name for detailed review):
|


| 12Stocks.com: Top Performing Mid Cap Index Stocks | ||||||||||||||||||||||||||||||||||||||||||||||||
 The top performing Mid Cap Index stocks year to date are
Now, more recently, over last week, the top performing Mid Cap Index stocks on the move are


|
||||||||||||||||||||||||||||||||||||||||||||||||
| 12Stocks.com: Investing in Midcap Index with Stocks | |
|
The following table helps investors and traders sort through current performance and trends (as measured by Smart Investing & Trading Score) of various
stocks in the Midcap Index. Quick View: Move mouse or cursor over stock symbol (ticker) to view short-term technical chart and over stock name to view long term chart. Click on  to add stock symbol to your watchlist and to add stock symbol to your watchlist and  to view watchlist. Click on any ticker or stock name for detailed market intelligence report for that stock. to view watchlist. Click on any ticker or stock name for detailed market intelligence report for that stock. |
12Stocks.com Performance of Stocks in Midcap Index
| Ticker | Stock Name | Watchlist | Category | Recent Price | Smart Investing & Trading Score | Change % | YTD Change% |
| WCC | WESCO |   | Services & Goods | 154.40 | 36 | 1.08% | -11.20% |
| SPR | Spirit Aero | | Industrials | 32.07 | 36 | 0.22% | 0.91% |
| GNRC | Generac | | Industrials | 127.63 | 36 | -6.13% | -1.25% |
| RRC | Range Resources | | Energy | 34.55 | 36 | -3.79% | 13.50% |
| APA | Apache | | Energy | 30.50 | 36 | -2.99% | -14.99% |
| MRO | Marathon Oil | | Energy | 26.10 | 36 | -2.79% | 8.03% |
| AA | Alcoa | | Materials | 34.25 | 36 | -2.53% | 0.74% |
| AGCO | AGCO | | Industrials | 112.14 | 36 | -1.80% | -7.64% |
| DVN | Devon Energy | | Energy | 50.40 | 36 | -1.52% | 11.26% |
| DTM | DT Midstream | | Energy | 61.36 | 36 | -1.35% | 11.67% |
| OVV | Ovintiv | | Energy | 50.73 | 36 | -1.15% | 15.51% |
| ARMK | Aramark | | Services & Goods | 31.15 | 36 | -1.14% | 10.85% |
| KR | Kroger Co | | Services & Goods | 54.77 | 36 | -1.10% | 19.82% |
| ASH | Ashland Global | | Materials | 94.50 | 36 | -0.87% | 12.09% |
| BG | Bunge | | Consumer Staples | 100.95 | 36 | -0.80% | 0.00% |
| VAC | Marriott Vacations | | Services & Goods | 95.37 | 36 | -0.77% | 12.35% |
| PNR | Pentair | | Industrials | 79.07 | 36 | -0.03% | 8.75% |
| WOOF | Petco Health | | Services & Goods | 1.56 | 35 | 4.00% | -50.63% |
| SIRI | Sirius XM | | Services & Goods | 3.05 | 35 | 3.74% | -44.24% |
| ROKU | Roku | | Technology | 59.13 | 35 | 2.55% | -35.49% |
| LSXMK | Liberty SiriusXM | | Services & Goods | 24.64 | 35 | 2.41% | -14.38% |
| LSXMA | Liberty SiriusXM | | Services & Goods | 24.63 | 35 | 2.37% | -14.30% |
| SJM | J. M. | | Consumer Staples | 113.60 | 35 | -1.09% | -10.11% |
| WPC | W. P. | | Financials | 54.63 | 35 | -0.38% | -15.71% |
| LH | Laboratory | | Health Care | 201.32 | 35 | -0.02% | -11.43% |
| For chart view version of above stock list: Chart View ➞ 0 - 25 , 25 - 50 , 50 - 75 , 75 - 100 , 100 - 125 , 125 - 150 , 150 - 175 , 175 - 200 , 200 - 225 , 225 - 250 , 250 - 275 , 275 - 300 , 300 - 325 , 325 - 350 , 350 - 375 , 375 - 400 , 400 - 425 , 425 - 450 , 450 - 475 , 475 - 500 , 500 - 525 , 525 - 550 , 550 - 575 , 575 - 600 , 600 - 625 , 625 - 650 , 650 - 675 , 675 - 700 , 700 - 725 , 725 - 750 , 750 - 775 | ||
 | Click To Change The Sort Order: By Market Cap or Company Size Performance: Year-to-date, Week and Day |  |
|
Get the most comprehensive stock market coverage daily at 12Stocks.com ➞ Best Stocks Today ➞ Best Stocks Weekly ➞ Best Stocks Year-to-Date ➞ Best Stocks Trends ➞  Best Stocks Today 12Stocks.com Best Nasdaq Stocks ➞ Best S&P 500 Stocks ➞ Best Tech Stocks ➞ Best Biotech Stocks ➞ |
| Detailed Overview of Midcap Stocks |
| Midcap Technical Overview, Leaders & Laggards, Top Midcap ETF Funds & Detailed Midcap Stocks List, Charts, Trends & More |
| Midcap: Technical Analysis, Trends & YTD Performance | |
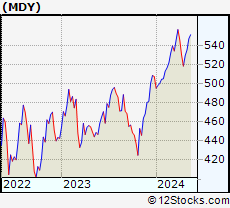
| MidCap segment as represented by
MDY, an exchange-traded fund [ETF], holds basket of about four hundred midcap stocks from across all major sectors of the US stock market. The midcap index (contains stocks like Green Mountain Coffee Roasters and Tractor Supply Company) is up by 3.12% and is currently underperforming the overall market by -1.42% year-to-date. Below is a quick view of technical charts and trends: | |
 MDY Weekly Chart |
|
| Long Term Trend: Not Good | |
| Medium Term Trend: Not Good | |
 MDY Daily Chart |
|
| Short Term Trend: Not Good | |
| Overall Trend Score: 7 | |
| YTD Performance: 3.12% | |
| **Trend Scores & Views Are Only For Educational Purposes And Not For Investing | |
| 12Stocks.com: Investing in Midcap Index using Exchange Traded Funds | |
|
The following table shows list of key exchange traded funds (ETF) that
help investors track Midcap index. The following list also includes leveraged ETF funds that track twice or thrice the daily returns of Midcap indices. Short or inverse ETF funds move in the opposite direction to the index they track and are useful during market pullbacks or during bear markets. Quick View: Move mouse or cursor over ETF symbol (ticker) to view short-term technical chart and over ETF name to view long term chart. Click on ticker or stock name for detailed view. Click on to add stock symbol to your watchlist and to view watchlist. |
12Stocks.com List of ETFs that track Midcap Index
| Ticker | ETF Name | Watchlist | Recent Price | Smart Investing & Trading Score | Change % | Week % | Year-to-date % |
| IJH | iShares Core S&P Mid-Cap | | 57.16 | 7 | 0.05 | -1.14 | 3.12% |
| MDY | SPDR S&P MidCap 400 ETF | | 523.21 | 7 | 0.09 | -1.17 | 3.12% |
| IWR | iShares Russell Mid-Cap | | 79.48 | 7 | -0.18 | -1.29 | 2.25% |
| IWP | iShares Russell Mid-Cap Growth | | 107.46 | 7 | 0.02 | -1.39 | 2.87% |
| IWS | iShares Russell Mid-Cap Value | | 118.77 | 7 | -0.08 | -1.02 | 2.13% |
| IJK | iShares S&P Mid-Cap 400 Growth | | 85.83 | 7 | -0.01 | -1.34 | 8.34% |
| IJJ | iShares S&P Mid-Cap 400 Value | | 111.28 | 22 | 0.20 | -0.85 | -2.42% |
| XMLV | PowerShares S&P MidCap Low Volatil ETF | | 54.69 | 47 | 0.46 | 0.07 | 2.84% |
| MVV | ProShares Ultra MidCap400 | | 60.02 | 17 | 0.22 | -2.3 | 3.68% |
| SMDD | ProShares UltraPro Short MidCap400 | | 12.18 | 88 | -0.25 | 2.95 | -9.54% |
| UMDD | ProShares UltraPro MidCap400 | | 23.07 | 0 | -0.82 | -3.71 | 3.36% |
| MZZ | ProShares UltraShort MidCap400 | | 11.96 | 53 | 1.18 | 2.4 | -4.86% |
| MYY | ProShares Short MidCap400 | | 20.79 | 48 | -0.57 | 0 | -3.1% |
| 12Stocks.com: Charts, Trends, Fundamental Data and Performances of MidCap Stocks | |
|
We now take in-depth look at all MidCap stocks including charts, multi-period performances and overall trends (as measured by Smart Investing & Trading Score). One can sort MidCap stocks (click link to choose) by Daily, Weekly and by Year-to-Date performances. Also, one can sort by size of the company or by market capitalization. |
| Select Your Default Chart Type: | |||||
| |||||
| Click on stock symbol or name for detailed view. Click on to add stock symbol to your watchlist and to view watchlist. Quick View: Move mouse or cursor over "Daily" to quickly view daily technical stock chart and over "Weekly" to view weekly technical stock chart. | |||||

 | WCC WESCO International, Inc. |
| Sector: Services & Goods | |
| SubSector: Industrial Equipment Wholesale | |
| MarketCap: 824.358 Millions | |
| Recent Price: 154.40 Smart Investing & Trading Score: 36 | |
| Day Percent Change: 1.08% Day Change: 1.65 | |
| Week Change: -0.9% Year-to-date Change: -11.2% | |
| WCC Links: Profile News Message Board | |
| Charts:- Daily , Weekly | |
| Add WCC to Watchlist: View: Get Complete WCC Trend Analysis ➞ | |
 | SPR Spirit AeroSystems Holdings, Inc. |
| Sector: Industrials | |
| SubSector: Aerospace/Defense Products & Services | |
| MarketCap: 2283.01 Millions | |
| Recent Price: 32.07 Smart Investing & Trading Score: 36 | |
| Day Percent Change: 0.22% Day Change: 0.07 | |
| Week Change: -1.29% Year-to-date Change: 0.9% | |
| SPR Links: Profile News Message Board | |
| Charts:- Daily , Weekly | |
| Add SPR to Watchlist: View: Get Complete SPR Trend Analysis ➞ | |
 | GNRC Generac Holdings Inc. |
| Sector: Industrials | |
| SubSector: Diversified Machinery | |
| MarketCap: 5736.26 Millions | |
| Recent Price: 127.63 Smart Investing & Trading Score: 36 | |
| Day Percent Change: -6.13% Day Change: -8.33 | |
| Week Change: -8.91% Year-to-date Change: -1.3% | |
| GNRC Links: Profile News Message Board | |
| Charts:- Daily , Weekly | |
| Add GNRC to Watchlist: View: Get Complete GNRC Trend Analysis ➞ | |
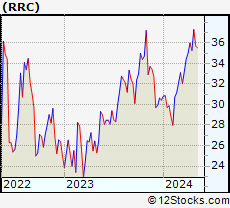 | RRC Range Resources Corporation |
| Sector: Energy | |
| SubSector: Independent Oil & Gas | |
| MarketCap: 728.093 Millions | |
| Recent Price: 34.55 Smart Investing & Trading Score: 36 | |
| Day Percent Change: -3.79% Day Change: -1.36 | |
| Week Change: -7.4% Year-to-date Change: 13.5% | |
| RRC Links: Profile News Message Board | |
| Charts:- Daily , Weekly | |
| Add RRC to Watchlist: View: Get Complete RRC Trend Analysis ➞ | |
 | APA Apache Corporation |
| Sector: Energy | |
| SubSector: Independent Oil & Gas | |
| MarketCap: 1937.53 Millions | |
| Recent Price: 30.50 Smart Investing & Trading Score: 36 | |
| Day Percent Change: -2.99% Day Change: -0.94 | |
| Week Change: -6.12% Year-to-date Change: -15.0% | |
| APA Links: Profile News Message Board | |
| Charts:- Daily , Weekly | |
| Add APA to Watchlist: View: Get Complete APA Trend Analysis ➞ | |
 | MRO Marathon Oil Corporation |
| Sector: Energy | |
| SubSector: Independent Oil & Gas | |
| MarketCap: 2911.53 Millions | |
| Recent Price: 26.10 Smart Investing & Trading Score: 36 | |
| Day Percent Change: -2.79% Day Change: -0.75 | |
| Week Change: -6.01% Year-to-date Change: 8.0% | |
| MRO Links: Profile News Message Board | |
| Charts:- Daily , Weekly | |
| Add MRO to Watchlist: View: Get Complete MRO Trend Analysis ➞ | |
 | AA Alcoa Corporation |
| Sector: Materials | |
| SubSector: Aluminum | |
| MarketCap: 1248.08 Millions | |
| Recent Price: 34.25 Smart Investing & Trading Score: 36 | |
| Day Percent Change: -2.53% Day Change: -0.89 | |
| Week Change: -7.13% Year-to-date Change: 0.7% | |
| AA Links: Profile News Message Board | |
| Charts:- Daily , Weekly | |
| Add AA to Watchlist: View: Get Complete AA Trend Analysis ➞ | |
 | AGCO AGCO Corporation |
| Sector: Industrials | |
| SubSector: Farm & Construction Machinery | |
| MarketCap: 3399.57 Millions | |
| Recent Price: 112.14 Smart Investing & Trading Score: 36 | |
| Day Percent Change: -1.80% Day Change: -2.05 | |
| Week Change: -3.83% Year-to-date Change: -7.6% | |
| AGCO Links: Profile News Message Board | |
| Charts:- Daily , Weekly | |
| Add AGCO to Watchlist: View: Get Complete AGCO Trend Analysis ➞ | |
 | DVN Devon Energy Corporation |
| Sector: Energy | |
| SubSector: Independent Oil & Gas | |
| MarketCap: 2693.03 Millions | |
| Recent Price: 50.40 Smart Investing & Trading Score: 36 | |
| Day Percent Change: -1.52% Day Change: -0.78 | |
| Week Change: -4.38% Year-to-date Change: 11.3% | |
| DVN Links: Profile News Message Board | |
| Charts:- Daily , Weekly | |
| Add DVN to Watchlist: View: Get Complete DVN Trend Analysis ➞ | |
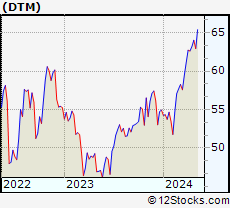 | DTM DT Midstream, Inc. |
| Sector: Energy | |
| SubSector: Oil & Gas Midstream | |
| MarketCap: 4690 Millions | |
| Recent Price: 61.36 Smart Investing & Trading Score: 36 | |
| Day Percent Change: -1.35% Day Change: -0.84 | |
| Week Change: -4.18% Year-to-date Change: 11.7% | |
| DTM Links: Profile News Message Board | |
| Charts:- Daily , Weekly | |
| Add DTM to Watchlist: View: Get Complete DTM Trend Analysis ➞ | |
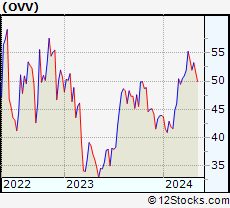 | OVV Ovintiv Inc. |
| Sector: Energy | |
| SubSector: Independent Oil & Gas | |
| MarketCap: 713.793 Millions | |
| Recent Price: 50.73 Smart Investing & Trading Score: 36 | |
| Day Percent Change: -1.15% Day Change: -0.59 | |
| Week Change: -4.75% Year-to-date Change: 15.5% | |
| OVV Links: Profile News Message Board | |
| Charts:- Daily , Weekly | |
| Add OVV to Watchlist: View: Get Complete OVV Trend Analysis ➞ | |
 | ARMK Aramark |
| Sector: Services & Goods | |
| SubSector: Specialty Eateries | |
| MarketCap: 5242.27 Millions | |
| Recent Price: 31.15 Smart Investing & Trading Score: 36 | |
| Day Percent Change: -1.14% Day Change: -0.36 | |
| Week Change: -3.71% Year-to-date Change: 10.9% | |
| ARMK Links: Profile News Message Board | |
| Charts:- Daily , Weekly | |
| Add ARMK to Watchlist: View: Get Complete ARMK Trend Analysis ➞ | |
 | KR The Kroger Co. |
| Sector: Services & Goods | |
| SubSector: Grocery Stores | |
| MarketCap: 26718.5 Millions | |
| Recent Price: 54.77 Smart Investing & Trading Score: 36 | |
| Day Percent Change: -1.10% Day Change: -0.61 | |
| Week Change: -1.3% Year-to-date Change: 19.8% | |
| KR Links: Profile News Message Board | |
| Charts:- Daily , Weekly | |
| Add KR to Watchlist: View: Get Complete KR Trend Analysis ➞ | |
 | ASH Ashland Global Holdings Inc. |
| Sector: Materials | |
| SubSector: Chemicals - Major Diversified | |
| MarketCap: 2764.16 Millions | |
| Recent Price: 94.50 Smart Investing & Trading Score: 36 | |
| Day Percent Change: -0.87% Day Change: -0.83 | |
| Week Change: -1.62% Year-to-date Change: 12.1% | |
| ASH Links: Profile News Message Board | |
| Charts:- Daily , Weekly | |
| Add ASH to Watchlist: View: Get Complete ASH Trend Analysis ➞ | |
 | BG Bunge Limited |
| Sector: Consumer Staples | |
| SubSector: Farm Products | |
| MarketCap: 4975.77 Millions | |
| Recent Price: 100.95 Smart Investing & Trading Score: 36 | |
| Day Percent Change: -0.80% Day Change: -0.81 | |
| Week Change: -1.73% Year-to-date Change: 0.0% | |
| BG Links: Profile News Message Board | |
| Charts:- Daily , Weekly | |
| Add BG to Watchlist: View: Get Complete BG Trend Analysis ➞ | |
 | VAC Marriott Vacations Worldwide Corporation |
| Sector: Services & Goods | |
| SubSector: Resorts & Casinos | |
| MarketCap: 2173.54 Millions | |
| Recent Price: 95.37 Smart Investing & Trading Score: 36 | |
| Day Percent Change: -0.77% Day Change: -0.74 | |
| Week Change: -5.45% Year-to-date Change: 12.4% | |
| VAC Links: Profile News Message Board | |
| Charts:- Daily , Weekly | |
| Add VAC to Watchlist: View: Get Complete VAC Trend Analysis ➞ | |
 | PNR Pentair plc |
| Sector: Industrials | |
| SubSector: Industrial Equipment & Components | |
| MarketCap: 4326.59 Millions | |
| Recent Price: 79.07 Smart Investing & Trading Score: 36 | |
| Day Percent Change: -0.03% Day Change: -0.02 | |
| Week Change: -1.11% Year-to-date Change: 8.8% | |
| PNR Links: Profile News Message Board | |
| Charts:- Daily , Weekly | |
| Add PNR to Watchlist: View: Get Complete PNR Trend Analysis ➞ | |
 | WOOF Petco Health and Wellness Company, Inc. |
| Sector: Services & Goods | |
| SubSector: Specialty Retail | |
| MarketCap: 2030 Millions | |
| Recent Price: 1.56 Smart Investing & Trading Score: 35 | |
| Day Percent Change: 4.00% Day Change: 0.06 | |
| Week Change: 3.31% Year-to-date Change: -50.6% | |
| WOOF Links: Profile News Message Board | |
| Charts:- Daily , Weekly | |
| Add WOOF to Watchlist: View: Get Complete WOOF Trend Analysis ➞ | |
 | SIRI Sirius XM Holdings Inc. |
| Sector: Services & Goods | |
| SubSector: Broadcasting - Radio | |
| MarketCap: 21325.5 Millions | |
| Recent Price: 3.05 Smart Investing & Trading Score: 35 | |
| Day Percent Change: 3.74% Day Change: 0.11 | |
| Week Change: 0.99% Year-to-date Change: -44.2% | |
| SIRI Links: Profile News Message Board | |
| Charts:- Daily , Weekly | |
| Add SIRI to Watchlist: View: Get Complete SIRI Trend Analysis ➞ | |
 | ROKU Roku, Inc. |
| Sector: Technology | |
| SubSector: CATV Systems | |
| MarketCap: 10503.6 Millions | |
| Recent Price: 59.13 Smart Investing & Trading Score: 35 | |
| Day Percent Change: 2.55% Day Change: 1.47 | |
| Week Change: 4.93% Year-to-date Change: -35.5% | |
| ROKU Links: Profile News Message Board | |
| Charts:- Daily , Weekly | |
| Add ROKU to Watchlist: View: Get Complete ROKU Trend Analysis ➞ | |
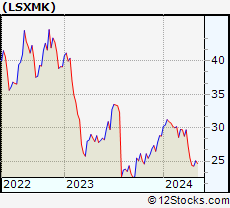 | LSXMK The Liberty SiriusXM Group |
| Sector: Services & Goods | |
| SubSector: Broadcasting - Radio | |
| MarketCap: 5183.95 Millions | |
| Recent Price: 24.64 Smart Investing & Trading Score: 35 | |
| Day Percent Change: 2.41% Day Change: 0.58 | |
| Week Change: 1.52% Year-to-date Change: -14.4% | |
| LSXMK Links: Profile News Message Board | |
| Charts:- Daily , Weekly | |
| Add LSXMK to Watchlist: View: Get Complete LSXMK Trend Analysis ➞ | |
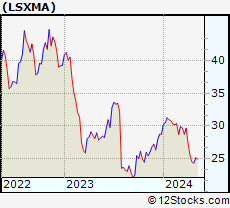 | LSXMA The Liberty SiriusXM Group |
| Sector: Services & Goods | |
| SubSector: Broadcasting - Radio | |
| MarketCap: 14414.5 Millions | |
| Recent Price: 24.63 Smart Investing & Trading Score: 35 | |
| Day Percent Change: 2.37% Day Change: 0.57 | |
| Week Change: 1.32% Year-to-date Change: -14.3% | |
| LSXMA Links: Profile News Message Board | |
| Charts:- Daily , Weekly | |
| Add LSXMA to Watchlist: View: Get Complete LSXMA Trend Analysis ➞ | |
 | SJM The J. M. Smucker Company |
| Sector: Consumer Staples | |
| SubSector: Processed & Packaged Goods | |
| MarketCap: 12635.8 Millions | |
| Recent Price: 113.60 Smart Investing & Trading Score: 35 | |
| Day Percent Change: -1.09% Day Change: -1.25 | |
| Week Change: 0% Year-to-date Change: -10.1% | |
| SJM Links: Profile News Message Board | |
| Charts:- Daily , Weekly | |
| Add SJM to Watchlist: View: Get Complete SJM Trend Analysis ➞ | |
 | WPC W. P. Carey Inc. |
| Sector: Financials | |
| SubSector: REIT - Diversified | |
| MarketCap: 9560.03 Millions | |
| Recent Price: 54.63 Smart Investing & Trading Score: 35 | |
| Day Percent Change: -0.38% Day Change: -0.21 | |
| Week Change: -0.73% Year-to-date Change: -15.7% | |
| WPC Links: Profile News Message Board | |
| Charts:- Daily , Weekly | |
| Add WPC to Watchlist: View: Get Complete WPC Trend Analysis ➞ | |
 | LH Laboratory Corporation of America Holdings |
| Sector: Health Care | |
| SubSector: Medical Laboratories & Research | |
| MarketCap: 12119.2 Millions | |
| Recent Price: 201.32 Smart Investing & Trading Score: 35 | |
| Day Percent Change: -0.02% Day Change: -0.05 | |
| Week Change: 1.47% Year-to-date Change: -11.4% | |
| LH Links: Profile News Message Board | |
| Charts:- Daily , Weekly | |
| Add LH to Watchlist: View: Get Complete LH Trend Analysis ➞ | |
| For tabular summary view of above stock list: Summary View ➞ 0 - 25 , 25 - 50 , 50 - 75 , 75 - 100 , 100 - 125 , 125 - 150 , 150 - 175 , 175 - 200 , 200 - 225 , 225 - 250 , 250 - 275 , 275 - 300 , 300 - 325 , 325 - 350 , 350 - 375 , 375 - 400 , 400 - 425 , 425 - 450 , 450 - 475 , 475 - 500 , 500 - 525 , 525 - 550 , 550 - 575 , 575 - 600 , 600 - 625 , 625 - 650 , 650 - 675 , 675 - 700 , 700 - 725 , 725 - 750 , 750 - 775 | ||
| Click To Change The Sort Order: By Market Cap or Company Size Performance: Year-to-date, Week and Day | |
| Select Chart Type: | ||
|
Best Stocks Today 12Stocks.com |
© 2024 12Stocks.com Terms & Conditions Privacy Contact Us
All Information Provided Only For Education And Not To Be Used For Investing or Trading. See Terms & Conditions


One More Thing ... Get Best Stocks Delivered Daily!
Never Ever Miss A Move With Our Top Ten Stocks Lists
Find Best Stocks In Any Market - Bull or Bear Market
Take A Peek At Our Top Ten Stocks Lists: Daily, Weekly, Year-to-Date & Top Trends
Find Best Stocks In Any Market - Bull or Bear Market
Take A Peek At Our Top Ten Stocks Lists: Daily, Weekly, Year-to-Date & Top Trends
Midcap Stocks With Best Up Trends [0-bearish to 100-bullish]: Pinterest [100], Garmin [100], Brookfield Renewable[100], Amcor [100], United [100], Axalta Coating[100], DuPont de[100], Clean Harbors[100], Equitable [100], Columbia Banking[100], Playtika Holding[100]
Best Midcap Stocks Year-to-Date:
Vistra Energy[99.53%], AppLovin [76.53%], ShockWave Medical[73.09%], EMCOR [64.9%], Constellation Energy[57.66%], CAVA [56.42%], Tenet [53.43%], Spotify [51.42%], Natera [50.3%], Wingstop [49.65%], Antero Resources[44%] Best Midcap Stocks This Week:
Tenet [20.62%], Pinterest [19.2%], Bio-Techne [14.67%], New York[14.48%], Garmin [13.92%], Sensata Technologies[11.46%], Brookfield Renewable[10.3%], Woodward [10.15%], Maravai LifeSciences[9.61%], Axalta Coating[9.58%], Amcor [9.25%] Best Midcap Stocks Daily:
New York[28.30%], Pinterest [21.02%], Bio-Techne [16.22%], Garmin [13.12%], Brookfield Renewable[10.63%], Amcor [9.62%], United [8.88%], Axalta Coating[8.81%], DuPont de[8.01%], Clean Harbors[6.81%], Verisk Analytics[6.81%]