
 Login Sign Up


| |||||
 |  | ||||

| 12Stocks.com Market Intelligence |
Best MidCap Stocks
|
| In a hurry? Mid Cap Stocks Lists: Performance Trends Table, Stock Charts
Sort midcap stocks: Daily, Weekly, Year-to-Date, Market Cap & Trends. Filter midcap stocks list by sector: Show all, Tech, Finance, Energy, Staples, Retail, Industrial, Materials, Utilities and HealthCare Filter midcap stocks list by size:All MidCap Large Mid-Range Small |
| 12Stocks.com Mid Cap Stocks Performances & Trends Daily | |||||||||
|
|  The overall Smart Investing & Trading Score is 85 (0-bearish to 100-bullish) which puts Mid Cap index in short term bullish trend. The Smart Investing & Trading Score from previous trading session is 45 and hence an improvement of trend.
| ||||||||
Here are the Smart Investing & Trading Scores of the most requested mid cap stocks at 12Stocks.com (click stock name for detailed review):
|


| 12Stocks.com: Top Performing Mid Cap Index Stocks | ||||||||||||||||||||||||||||||||||||||||||||||||
 The top performing Mid Cap Index stocks year to date are
Now, more recently, over last week, the top performing Mid Cap Index stocks on the move are


|
||||||||||||||||||||||||||||||||||||||||||||||||
| 12Stocks.com: Investing in Midcap Index with Stocks | |
|
The following table helps investors and traders sort through current performance and trends (as measured by Smart Investing & Trading Score) of various
stocks in the Midcap Index. Quick View: Move mouse or cursor over stock symbol (ticker) to view short-term technical chart and over stock name to view long term chart. Click on  to add stock symbol to your watchlist and to add stock symbol to your watchlist and  to view watchlist. Click on any ticker or stock name for detailed market intelligence report for that stock. to view watchlist. Click on any ticker or stock name for detailed market intelligence report for that stock. |
12Stocks.com Performance of Stocks in Midcap Index
| Ticker | Stock Name | Watchlist | Category | Recent Price | Smart Investing & Trading Score | Change % | YTD Change% |
| AGO | Assured Guaranty |   | Financials | 77.87 | 32 | 0.56% | 4.06% |
| FAF | First American | | Financials | 54.38 | 32 | 0.54% | -15.61% |
| ALLE | Allegion | | Services & Goods | 122.88 | 32 | 0.51% | -3.01% |
| LEA | Lear | | Consumer Staples | 127.15 | 32 | 0.43% | -9.96% |
| MGM | MGM Resorts | | Services & Goods | 41.04 | 32 | 0.42% | -8.15% |
| OTIS | Otis Worldwide | | Industrials | 92.12 | 32 | 0.38% | 2.96% |
| SOFI | SoFi Technologies | | Financials | 6.96 | 32 | 0.36% | -29.39% |
| UAA | Under Armour | | Consumer Staples | 6.74 | 32 | 0.30% | -23.32% |
| WBS | Webster Financial | | Financials | 44.92 | 32 | 0.27% | -11.51% |
| TXT | Textron | | Industrials | 85.59 | 32 | 0.26% | 6.43% |
| WY | Weyerhaeuser | | Industrials | 31.09 | 32 | 0.26% | -10.58% |
| BC | Brunswick | | Consumer Staples | 81.33 | 32 | 0.22% | -15.94% |
| LECO | Loln Electric | | Industrials | 222.93 | 32 | 0.17% | 2.52% |
| TAP | Molson Coors | | Consumer Staples | 57.85 | 32 | 0.09% | -5.49% |
| HOG | Harley-Davidson | | Consumer Staples | 35.05 | 32 | 0.06% | -4.86% |
| HTZ | Hertz Global | | Industrials | 4.84 | 32 | -3.20% | -53.42% |
| BMRN | BioMarin Pharmaceutical | | Health Care | 82.44 | 32 | -1.62% | -14.50% |
| SAIA | Saia | | Transports | 400.08 | 32 | -1.45% | -8.70% |
| LUV | Southwest Airlines | | Transports | 26.15 | 32 | -0.98% | -9.45% |
| WSC | WillScot | | Transports | 37.35 | 32 | -0.66% | -16.07% |
| PRI | Primerica | | Financials | 217.99 | 32 | -0.62% | 5.94% |
| RS | Reliance Steel | | Materials | 289.78 | 32 | -0.32% | 3.61% |
| BYD | Boyd Gaming | | Services & Goods | 54.12 | 32 | -0.07% | -13.56% |
| FTV | Fortive | | Technology | 76.08 | 32 | -0.03% | 3.33% |
| FAST | Fastenal | | Services & Goods | 68.43 | 32 | 0.50% | 5.65% |
| For chart view version of above stock list: Chart View ➞ 0 - 25 , 25 - 50 , 50 - 75 , 75 - 100 , 100 - 125 , 125 - 150 , 150 - 175 , 175 - 200 , 200 - 225 , 225 - 250 , 250 - 275 , 275 - 300 , 300 - 325 , 325 - 350 , 350 - 375 , 375 - 400 , 400 - 425 , 425 - 450 , 450 - 475 , 475 - 500 , 500 - 525 , 525 - 550 , 550 - 575 , 575 - 600 , 600 - 625 , 625 - 650 , 650 - 675 , 675 - 700 , 700 - 725 , 725 - 750 , 750 - 775 | ||
 | Click To Change The Sort Order: By Market Cap or Company Size Performance: Year-to-date, Week and Day |  |
|
Get the most comprehensive stock market coverage daily at 12Stocks.com ➞ Best Stocks Today ➞ Best Stocks Weekly ➞ Best Stocks Year-to-Date ➞ Best Stocks Trends ➞  Best Stocks Today 12Stocks.com Best Nasdaq Stocks ➞ Best S&P 500 Stocks ➞ Best Tech Stocks ➞ Best Biotech Stocks ➞ |
| Detailed Overview of Midcap Stocks |
| Midcap Technical Overview, Leaders & Laggards, Top Midcap ETF Funds & Detailed Midcap Stocks List, Charts, Trends & More |
| Midcap: Technical Analysis, Trends & YTD Performance | |
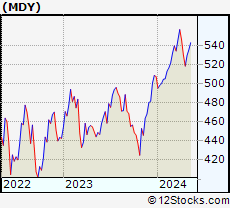
| MidCap segment as represented by
MDY, an exchange-traded fund [ETF], holds basket of about four hundred midcap stocks from across all major sectors of the US stock market. The midcap index (contains stocks like Green Mountain Coffee Roasters and Tractor Supply Company) is up by 5.52% and is currently underperforming the overall market by -1.36% year-to-date. Below is a quick view of technical charts and trends: | |
 MDY Weekly Chart |
|
| Long Term Trend: Good | |
| Medium Term Trend: Good | |
 MDY Daily Chart |
|
| Short Term Trend: Very Good | |
| Overall Trend Score: 85 | |
| YTD Performance: 5.52% | |
| **Trend Scores & Views Are Only For Educational Purposes And Not For Investing | |
| 12Stocks.com: Investing in Midcap Index using Exchange Traded Funds | |
|
The following table shows list of key exchange traded funds (ETF) that
help investors track Midcap index. The following list also includes leveraged ETF funds that track twice or thrice the daily returns of Midcap indices. Short or inverse ETF funds move in the opposite direction to the index they track and are useful during market pullbacks or during bear markets. Quick View: Move mouse or cursor over ETF symbol (ticker) to view short-term technical chart and over ETF name to view long term chart. Click on ticker or stock name for detailed view. Click on to add stock symbol to your watchlist and to view watchlist. |
12Stocks.com List of ETFs that track Midcap Index
| Ticker | ETF Name | Watchlist | Recent Price | Smart Investing & Trading Score | Change % | Week % | Year-to-date % |
| IJH | iShares Core S&P Mid-Cap | | 58.53 | 85 | 1.05 | 1.23 | 5.59% |
| IWR | iShares Russell Mid-Cap | | 80.78 | 60 | 0.72 | 0.32 | 3.92% |
| MDY | SPDR S&P MidCap 400 ETF | | 535.41 | 85 | 1.01 | 1.14 | 5.52% |
| IWP | iShares Russell Mid-Cap Growth | | 108.75 | 39 | 0.54 | -0.21 | 4.11% |
| IJK | iShares S&P Mid-Cap 400 Growth | | 87.89 | 78 | 1.02 | 1.02 | 10.94% |
| IWS | iShares Russell Mid-Cap Value | | 120.70 | 78 | 0.80 | 0.59 | 3.79% |
| IJJ | iShares S&P Mid-Cap 400 Value | | 113.77 | 90 | 0.96 | 1.37 | -0.24% |
| XMLV | PowerShares S&P MidCap Low Volatil ETF | | 55.50 | 100 | 0.62 | 1.56 | 4.36% |
| SMDD | ProShares UltraPro Short MidCap400 | | 11.45 | 10 | -2.82 | -3.23 | -14.97% |
| MVV | ProShares Ultra MidCap400 | | 62.72 | 85 | 2.37 | 2.1 | 8.34% |
| UMDD | ProShares UltraPro MidCap400 | | 24.68 | 85 | 3.08 | 3 | 10.56% |
| MYY | ProShares Short MidCap400 | | 20.57 | 28 | -0.76 | -1.04 | -4.11% |
| MZZ | ProShares UltraShort MidCap400 | | 11.46 | 20 | -2.05 | -1.88 | -8.84% |
| 12Stocks.com: Charts, Trends, Fundamental Data and Performances of MidCap Stocks | |
|
We now take in-depth look at all MidCap stocks including charts, multi-period performances and overall trends (as measured by Smart Investing & Trading Score). One can sort MidCap stocks (click link to choose) by Daily, Weekly and by Year-to-Date performances. Also, one can sort by size of the company or by market capitalization. |
| Select Your Default Chart Type: | |||||
| |||||
| Click on stock symbol or name for detailed view. Click on to add stock symbol to your watchlist and to view watchlist. Quick View: Move mouse or cursor over "Daily" to quickly view daily technical stock chart and over "Weekly" to view weekly technical stock chart. | |||||

 | AGO Assured Guaranty Ltd. |
| Sector: Financials | |
| SubSector: Surety & Title Insurance | |
| MarketCap: 2133.18 Millions | |
| Recent Price: 77.87 Smart Investing & Trading Score: 32 | |
| Day Percent Change: 0.56% Day Change: 0.43 | |
| Week Change: -0.75% Year-to-date Change: 4.1% | |
| AGO Links: Profile News Message Board | |
| Charts:- Daily , Weekly | |
| Add AGO to Watchlist: View: Get Complete AGO Trend Analysis ➞ | |
 | FAF First American Financial Corporation |
| Sector: Financials | |
| SubSector: Property & Casualty Insurance | |
| MarketCap: 4163.82 Millions | |
| Recent Price: 54.38 Smart Investing & Trading Score: 32 | |
| Day Percent Change: 0.54% Day Change: 0.29 | |
| Week Change: 0.3% Year-to-date Change: -15.6% | |
| FAF Links: Profile News Message Board | |
| Charts:- Daily , Weekly | |
| Add FAF to Watchlist: View: Get Complete FAF Trend Analysis ➞ | |
 | ALLE Allegion plc |
| Sector: Services & Goods | |
| SubSector: Security & Protection Services | |
| MarketCap: 8515.93 Millions | |
| Recent Price: 122.88 Smart Investing & Trading Score: 32 | |
| Day Percent Change: 0.51% Day Change: 0.62 | |
| Week Change: -0.78% Year-to-date Change: -3.0% | |
| ALLE Links: Profile News Message Board | |
| Charts:- Daily , Weekly | |
| Add ALLE to Watchlist: View: Get Complete ALLE Trend Analysis ➞ | |
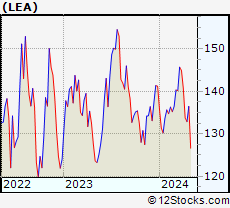 | LEA Lear Corporation |
| Sector: Consumer Staples | |
| SubSector: Auto Parts | |
| MarketCap: 5106.09 Millions | |
| Recent Price: 127.15 Smart Investing & Trading Score: 32 | |
| Day Percent Change: 0.43% Day Change: 0.55 | |
| Week Change: -6.83% Year-to-date Change: -10.0% | |
| LEA Links: Profile News Message Board | |
| Charts:- Daily , Weekly | |
| Add LEA to Watchlist: View: Get Complete LEA Trend Analysis ➞ | |
 | MGM MGM Resorts International |
| Sector: Services & Goods | |
| SubSector: Resorts & Casinos | |
| MarketCap: 5315.04 Millions | |
| Recent Price: 41.04 Smart Investing & Trading Score: 32 | |
| Day Percent Change: 0.42% Day Change: 0.17 | |
| Week Change: -0.12% Year-to-date Change: -8.2% | |
| MGM Links: Profile News Message Board | |
| Charts:- Daily , Weekly | |
| Add MGM to Watchlist: View: Get Complete MGM Trend Analysis ➞ | |
 | OTIS Otis Worldwide Corporation |
| Sector: Industrials | |
| SubSector: Specialty Industrial Machinery | |
| MarketCap: 27727 Millions | |
| Recent Price: 92.12 Smart Investing & Trading Score: 32 | |
| Day Percent Change: 0.38% Day Change: 0.35 | |
| Week Change: -0.09% Year-to-date Change: 3.0% | |
| OTIS Links: Profile News Message Board | |
| Charts:- Daily , Weekly | |
| Add OTIS to Watchlist: View: Get Complete OTIS Trend Analysis ➞ | |
 | SOFI SoFi Technologies, Inc. |
| Sector: Financials | |
| SubSector: Credit Services | |
| MarketCap: 7990 Millions | |
| Recent Price: 6.96 Smart Investing & Trading Score: 32 | |
| Day Percent Change: 0.36% Day Change: 0.03 | |
| Week Change: -11.85% Year-to-date Change: -29.4% | |
| SOFI Links: Profile News Message Board | |
| Charts:- Daily , Weekly | |
| Add SOFI to Watchlist: View: Get Complete SOFI Trend Analysis ➞ | |
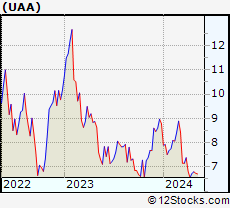 | UAA Under Armour, Inc. |
| Sector: Consumer Staples | |
| SubSector: Textile - Apparel Clothing | |
| MarketCap: 4066.75 Millions | |
| Recent Price: 6.74 Smart Investing & Trading Score: 32 | |
| Day Percent Change: 0.30% Day Change: 0.02 | |
| Week Change: -0.88% Year-to-date Change: -23.3% | |
| UAA Links: Profile News Message Board | |
| Charts:- Daily , Weekly | |
| Add UAA to Watchlist: View: Get Complete UAA Trend Analysis ➞ | |
 | WBS Webster Financial Corporation |
| Sector: Financials | |
| SubSector: Regional - Northeast Banks | |
| MarketCap: 2111.59 Millions | |
| Recent Price: 44.92 Smart Investing & Trading Score: 32 | |
| Day Percent Change: 0.27% Day Change: 0.12 | |
| Week Change: -0.24% Year-to-date Change: -11.5% | |
| WBS Links: Profile News Message Board | |
| Charts:- Daily , Weekly | |
| Add WBS to Watchlist: View: Get Complete WBS Trend Analysis ➞ | |
 | TXT Textron Inc. |
| Sector: Industrials | |
| SubSector: Aerospace/Defense - Major Diversified | |
| MarketCap: 6123.09 Millions | |
| Recent Price: 85.59 Smart Investing & Trading Score: 32 | |
| Day Percent Change: 0.26% Day Change: 0.22 | |
| Week Change: -1.06% Year-to-date Change: 6.4% | |
| TXT Links: Profile News Message Board | |
| Charts:- Daily , Weekly | |
| Add TXT to Watchlist: View: Get Complete TXT Trend Analysis ➞ | |
 | WY Weyerhaeuser Company |
| Sector: Industrials | |
| SubSector: Lumber, Wood Production | |
| MarketCap: 13244.8 Millions | |
| Recent Price: 31.09 Smart Investing & Trading Score: 32 | |
| Day Percent Change: 0.26% Day Change: 0.08 | |
| Week Change: 0.13% Year-to-date Change: -10.6% | |
| WY Links: Profile News Message Board | |
| Charts:- Daily , Weekly | |
| Add WY to Watchlist: View: Get Complete WY Trend Analysis ➞ | |
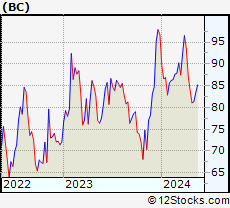 | BC Brunswick Corporation |
| Sector: Consumer Staples | |
| SubSector: Recreational Goods, Other | |
| MarketCap: 2481.59 Millions | |
| Recent Price: 81.33 Smart Investing & Trading Score: 32 | |
| Day Percent Change: 0.22% Day Change: 0.18 | |
| Week Change: 0.31% Year-to-date Change: -15.9% | |
| BC Links: Profile News Message Board | |
| Charts:- Daily , Weekly | |
| Add BC to Watchlist: View: Get Complete BC Trend Analysis ➞ | |
 | LECO Lincoln Electric Holdings, Inc. |
| Sector: Industrials | |
| SubSector: Small Tools & Accessories | |
| MarketCap: 4085.06 Millions | |
| Recent Price: 222.93 Smart Investing & Trading Score: 32 | |
| Day Percent Change: 0.17% Day Change: 0.37 | |
| Week Change: -3.05% Year-to-date Change: 2.5% | |
| LECO Links: Profile News Message Board | |
| Charts:- Daily , Weekly | |
| Add LECO to Watchlist: View: Get Complete LECO Trend Analysis ➞ | |
 | TAP Molson Coors Beverage Company |
| Sector: Consumer Staples | |
| SubSector: Beverages - Brewers | |
| MarketCap: 8619.97 Millions | |
| Recent Price: 57.85 Smart Investing & Trading Score: 32 | |
| Day Percent Change: 0.09% Day Change: 0.05 | |
| Week Change: -7.5% Year-to-date Change: -5.5% | |
| TAP Links: Profile News Message Board | |
| Charts:- Daily , Weekly | |
| Add TAP to Watchlist: View: Get Complete TAP Trend Analysis ➞ | |
 | HOG Harley-Davidson, Inc. |
| Sector: Consumer Staples | |
| SubSector: Recreational Vehicles | |
| MarketCap: 2808.49 Millions | |
| Recent Price: 35.05 Smart Investing & Trading Score: 32 | |
| Day Percent Change: 0.06% Day Change: 0.02 | |
| Week Change: 0.86% Year-to-date Change: -4.9% | |
| HOG Links: Profile News Message Board | |
| Charts:- Daily , Weekly | |
| Add HOG to Watchlist: View: Get Complete HOG Trend Analysis ➞ | |
 | HTZ Hertz Global Holdings, Inc. |
| Sector: Industrials | |
| SubSector: Rental & Leasing Services | |
| MarketCap: 5830 Millions | |
| Recent Price: 4.84 Smart Investing & Trading Score: 32 | |
| Day Percent Change: -3.20% Day Change: -0.16 | |
| Week Change: 9.5% Year-to-date Change: -53.4% | |
| HTZ Links: Profile News Message Board | |
| Charts:- Daily , Weekly | |
| Add HTZ to Watchlist: View: Get Complete HTZ Trend Analysis ➞ | |
 | BMRN BioMarin Pharmaceutical Inc. |
| Sector: Health Care | |
| SubSector: Biotechnology | |
| MarketCap: 14887.5 Millions | |
| Recent Price: 82.44 Smart Investing & Trading Score: 32 | |
| Day Percent Change: -1.62% Day Change: -1.36 | |
| Week Change: 1.89% Year-to-date Change: -14.5% | |
| BMRN Links: Profile News Message Board | |
| Charts:- Daily , Weekly | |
| Add BMRN to Watchlist: View: Get Complete BMRN Trend Analysis ➞ | |
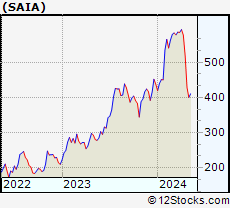 | SAIA Saia, Inc. |
| Sector: Transports | |
| SubSector: Trucking | |
| MarketCap: 1978.15 Millions | |
| Recent Price: 400.08 Smart Investing & Trading Score: 32 | |
| Day Percent Change: -1.45% Day Change: -5.87 | |
| Week Change: -6.7% Year-to-date Change: -8.7% | |
| SAIA Links: Profile News Message Board | |
| Charts:- Daily , Weekly | |
| Add SAIA to Watchlist: View: Get Complete SAIA Trend Analysis ➞ | |
 | LUV Southwest Airlines Co. |
| Sector: Transports | |
| SubSector: Regional Airlines | |
| MarketCap: 19463.3 Millions | |
| Recent Price: 26.15 Smart Investing & Trading Score: 32 | |
| Day Percent Change: -0.98% Day Change: -0.26 | |
| Week Change: -3.26% Year-to-date Change: -9.5% | |
| LUV Links: Profile News Message Board | |
| Charts:- Daily , Weekly | |
| Add LUV to Watchlist: View: Get Complete LUV Trend Analysis ➞ | |
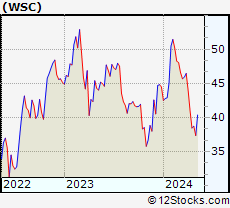 | WSC WillScot Corporation |
| Sector: Transports | |
| SubSector: Rental & Leasing Services | |
| MarketCap: 1050.44 Millions | |
| Recent Price: 37.35 Smart Investing & Trading Score: 32 | |
| Day Percent Change: -0.66% Day Change: -0.25 | |
| Week Change: -3.54% Year-to-date Change: -16.1% | |
| WSC Links: Profile News Message Board | |
| Charts:- Daily , Weekly | |
| Add WSC to Watchlist: View: Get Complete WSC Trend Analysis ➞ | |
 | PRI Primerica, Inc. |
| Sector: Financials | |
| SubSector: Life Insurance | |
| MarketCap: 2782.06 Millions | |
| Recent Price: 217.99 Smart Investing & Trading Score: 32 | |
| Day Percent Change: -0.62% Day Change: -1.35 | |
| Week Change: 2.12% Year-to-date Change: 5.9% | |
| PRI Links: Profile News Message Board | |
| Charts:- Daily , Weekly | |
| Add PRI to Watchlist: View: Get Complete PRI Trend Analysis ➞ | |
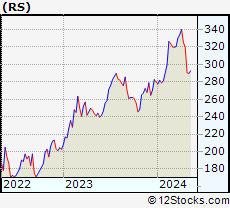 | RS Reliance Steel & Aluminum Co. |
| Sector: Materials | |
| SubSector: Steel & Iron | |
| MarketCap: 5520.48 Millions | |
| Recent Price: 289.78 Smart Investing & Trading Score: 32 | |
| Day Percent Change: -0.32% Day Change: -0.94 | |
| Week Change: -0.29% Year-to-date Change: 3.6% | |
| RS Links: Profile News Message Board | |
| Charts:- Daily , Weekly | |
| Add RS to Watchlist: View: Get Complete RS Trend Analysis ➞ | |
 | BYD Boyd Gaming Corporation |
| Sector: Services & Goods | |
| SubSector: Resorts & Casinos | |
| MarketCap: 1652.54 Millions | |
| Recent Price: 54.12 Smart Investing & Trading Score: 32 | |
| Day Percent Change: -0.07% Day Change: -0.04 | |
| Week Change: 1.77% Year-to-date Change: -13.6% | |
| BYD Links: Profile News Message Board | |
| Charts:- Daily , Weekly | |
| Add BYD to Watchlist: View: Get Complete BYD Trend Analysis ➞ | |
 | FTV Fortive Corporation |
| Sector: Technology | |
| SubSector: Scientific & Technical Instruments | |
| MarketCap: 16351.9 Millions | |
| Recent Price: 76.08 Smart Investing & Trading Score: 32 | |
| Day Percent Change: -0.03% Day Change: -0.02 | |
| Week Change: 0.14% Year-to-date Change: 3.3% | |
| FTV Links: Profile News Message Board | |
| Charts:- Daily , Weekly | |
| Add FTV to Watchlist: View: Get Complete FTV Trend Analysis ➞ | |
 | FAST Fastenal Company |
| Sector: Services & Goods | |
| SubSector: Industrial Equipment Wholesale | |
| MarketCap: 17609.9 Millions | |
| Recent Price: 68.43 Smart Investing & Trading Score: 32 | |
| Day Percent Change: 0.50% Day Change: 0.34 | |
| Week Change: 0.38% Year-to-date Change: 5.7% | |
| FAST Links: Profile News Message Board | |
| Charts:- Daily , Weekly | |
| Add FAST to Watchlist: View: Get Complete FAST Trend Analysis ➞ | |
| For tabular summary view of above stock list: Summary View ➞ 0 - 25 , 25 - 50 , 50 - 75 , 75 - 100 , 100 - 125 , 125 - 150 , 150 - 175 , 175 - 200 , 200 - 225 , 225 - 250 , 250 - 275 , 275 - 300 , 300 - 325 , 325 - 350 , 350 - 375 , 375 - 400 , 400 - 425 , 425 - 450 , 450 - 475 , 475 - 500 , 500 - 525 , 525 - 550 , 550 - 575 , 575 - 600 , 600 - 625 , 625 - 650 , 650 - 675 , 675 - 700 , 700 - 725 , 725 - 750 , 750 - 775 | ||
| Click To Change The Sort Order: By Market Cap or Company Size Performance: Year-to-date, Week and Day | |
| Select Chart Type: | ||
|
Best Stocks Today 12Stocks.com |
© 2024 12Stocks.com Terms & Conditions Privacy Contact Us
All Information Provided Only For Education And Not To Be Used For Investing or Trading. See Terms & Conditions


One More Thing ... Get Best Stocks Delivered Daily!
Never Ever Miss A Move With Our Top Ten Stocks Lists
Find Best Stocks In Any Market - Bull or Bear Market
Take A Peek At Our Top Ten Stocks Lists: Daily, Weekly, Year-to-Date & Top Trends
Find Best Stocks In Any Market - Bull or Bear Market
Take A Peek At Our Top Ten Stocks Lists: Daily, Weekly, Year-to-Date & Top Trends
Midcap Stocks With Best Up Trends [0-bearish to 100-bullish]: GameStop [100], Tandem Diabetes[100], MasTec [100], Frontier [100], Organon [100], First Solar[100], Reinsurance [100], Brookfield Renewable[100], Camden Property[100], Aptiv [100], Texas Roadhouse[100]
Best Midcap Stocks Year-to-Date:
Vistra Energy[111.55%], AppLovin [88.57%], ShockWave Medical[73.37%], EMCOR [68.86%], Constellation Energy[66.35%], CAVA [65.92%], Tenet [59.16%], Spotify [57.56%], Natera [54.82%], Wingstop [51.43%], Tandem Diabetes[51.18%] Best Midcap Stocks This Week:
GameStop [38.4%], Tandem Diabetes[26.9%], Tenet [25.12%], Wayfair [22.26%], Brookfield Renewable[21.71%], Bio-Techne [20.65%], Pinterest [18.99%], New York[18.86%], Olaplex [18.28%], Valmont Industries[17.25%], NovoCure [16.98%] Best Midcap Stocks Daily:
GameStop [29.08%], Tandem Diabetes[22.32%], Ginkgo Bioworks[12.33%], Paylocity Holding[12.05%], MasTec [11.87%], Plug Power[11.84%], Peloton Interactive[9.42%], Universal Display[9.28%], Sunrun [8.68%], Frontier [8.66%], Wayfair [8.44%]