
 Login Sign Up


| |||||
 |  | ||||

| 12Stocks.com Market Intelligence |
Best MidCap Stocks
|
| In a hurry? Mid Cap Stocks Lists: Performance Trends Table, Stock Charts
Sort midcap stocks: Daily, Weekly, Year-to-Date, Market Cap & Trends. Filter midcap stocks list by sector: Show all, Tech, Finance, Energy, Staples, Retail, Industrial, Materials, Utilities and HealthCare Filter midcap stocks list by size:All MidCap Large Mid-Range Small |
| 12Stocks.com Mid Cap Stocks Performances & Trends Daily | |||||||||
|
|  The overall Smart Investing & Trading Score is 85 (0-bearish to 100-bullish) which puts Mid Cap index in short term bullish trend. The Smart Investing & Trading Score from previous trading session is 45 and hence an improvement of trend.
| ||||||||
Here are the Smart Investing & Trading Scores of the most requested mid cap stocks at 12Stocks.com (click stock name for detailed review):
|


| 12Stocks.com: Top Performing Mid Cap Index Stocks | ||||||||||||||||||||||||||||||||||||||||||||||||
 The top performing Mid Cap Index stocks year to date are
Now, more recently, over last week, the top performing Mid Cap Index stocks on the move are


|
||||||||||||||||||||||||||||||||||||||||||||||||
| 12Stocks.com: Investing in Midcap Index with Stocks | |
|
The following table helps investors and traders sort through current performance and trends (as measured by Smart Investing & Trading Score) of various
stocks in the Midcap Index. Quick View: Move mouse or cursor over stock symbol (ticker) to view short-term technical chart and over stock name to view long term chart. Click on  to add stock symbol to your watchlist and to add stock symbol to your watchlist and  to view watchlist. Click on any ticker or stock name for detailed market intelligence report for that stock. to view watchlist. Click on any ticker or stock name for detailed market intelligence report for that stock. |
12Stocks.com Performance of Stocks in Midcap Index
| Ticker | Stock Name | Watchlist | Category | Recent Price | Smart Investing & Trading Score | Change % | YTD Change% |
| BFAM | Bright Horizons |   | Services & Goods | 111.23 | 69 | 6.67% | 18.03% |
| RBLX | Roblox | | Services & Goods | 39.24 | 69 | 5.44% | -14.96% |
| MCW | Mister Car | | Services & Goods | 7.33 | 69 | 4.57% | -14.97% |
| PLTR | Palantir Technologies | | Technology | 23.33 | 69 | 3.46% | 35.88% |
| ALGM | Allegro Micro | | Technology | 30.00 | 69 | 1.33% | -0.97% |
| ICUI | ICU Medical | | Health Care | 99.99 | 69 | 0.96% | 0.25% |
| JLL | Jones Lang | | Financials | 185.52 | 69 | 0.83% | -1.77% |
| JWN | Nordstrom | | Services & Goods | 20.10 | 69 | 0.60% | 8.94% |
| VICI | VICI Properties | | Financials | 28.80 | 69 | 0.00% | -9.66% |
| MPWR | Monolithic Power | | Technology | 707.22 | 69 | -0.80% | 12.12% |
| AGR | Avangrid | | Utilities | 36.62 | 69 | 0.19% | 12.99% |
| GNRC | Generac | | Industrials | 133.38 | 68 | 3.67% | 3.20% |
| NDAQ | Nasdaq | | Financials | 60.87 | 68 | 1.33% | 4.70% |
| GPK | Graphic Packaging | | Consumer Staples | 27.09 | 68 | 0.86% | 9.90% |
| CPB | Campbell Soup | | Consumer Staples | 44.88 | 68 | -2.20% | 3.82% |
| IRDM | Iridium | | Technology | 30.32 | 68 | -2.13% | -26.34% |
| AMG | Affiliated Managers | | Financials | 160.35 | 68 | -0.19% | 5.90% |
| LAMR | Lamar Advertising | | Financials | 115.08 | 68 | -3.03% | 8.28% |
| AMC | AMC Entertainment | | Services & Goods | 3.30 | 67 | 5.43% | -46.08% |
| ELS | Equity LifeStyle | | Financials | 63.33 | 67 | 0.27% | -10.22% |
| OLPX | Olaplex | | Services & Goods | 1.59 | 67 | -5.09% | -38.09% |
| INCY | yte | | Health Care | 53.76 | 67 | 1.26% | -14.38% |
| G | Genpact | | Technology | 31.34 | 67 | 0.10% | -9.71% |
| GLPI | Gaming and | | Financials | 43.20 | 67 | -0.69% | -12.46% |
| UNM | Unum | | Financials | 51.62 | 66 | -0.14% | 14.15% |
| For chart view version of above stock list: Chart View ➞ 0 - 25 , 25 - 50 , 50 - 75 , 75 - 100 , 100 - 125 , 125 - 150 , 150 - 175 , 175 - 200 , 200 - 225 , 225 - 250 , 250 - 275 , 275 - 300 , 300 - 325 , 325 - 350 , 350 - 375 , 375 - 400 , 400 - 425 , 425 - 450 , 450 - 475 , 475 - 500 , 500 - 525 , 525 - 550 , 550 - 575 , 575 - 600 , 600 - 625 , 625 - 650 , 650 - 675 , 675 - 700 , 700 - 725 , 725 - 750 , 750 - 775 | ||
 | Click To Change The Sort Order: By Market Cap or Company Size Performance: Year-to-date, Week and Day |  |
|
Get the most comprehensive stock market coverage daily at 12Stocks.com ➞ Best Stocks Today ➞ Best Stocks Weekly ➞ Best Stocks Year-to-Date ➞ Best Stocks Trends ➞  Best Stocks Today 12Stocks.com Best Nasdaq Stocks ➞ Best S&P 500 Stocks ➞ Best Tech Stocks ➞ Best Biotech Stocks ➞ |
| Detailed Overview of Midcap Stocks |
| Midcap Technical Overview, Leaders & Laggards, Top Midcap ETF Funds & Detailed Midcap Stocks List, Charts, Trends & More |
| Midcap: Technical Analysis, Trends & YTD Performance | |
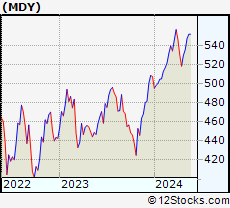
| MidCap segment as represented by
MDY, an exchange-traded fund [ETF], holds basket of about four hundred midcap stocks from across all major sectors of the US stock market. The midcap index (contains stocks like Green Mountain Coffee Roasters and Tractor Supply Company) is up by 5.52% and is currently underperforming the overall market by -1.36% year-to-date. Below is a quick view of technical charts and trends: | |
 MDY Weekly Chart |
|
| Long Term Trend: Good | |
| Medium Term Trend: Good | |
 MDY Daily Chart |
|
| Short Term Trend: Very Good | |
| Overall Trend Score: 85 | |
| YTD Performance: 5.52% | |
| **Trend Scores & Views Are Only For Educational Purposes And Not For Investing | |
| 12Stocks.com: Investing in Midcap Index using Exchange Traded Funds | |
|
The following table shows list of key exchange traded funds (ETF) that
help investors track Midcap index. The following list also includes leveraged ETF funds that track twice or thrice the daily returns of Midcap indices. Short or inverse ETF funds move in the opposite direction to the index they track and are useful during market pullbacks or during bear markets. Quick View: Move mouse or cursor over ETF symbol (ticker) to view short-term technical chart and over ETF name to view long term chart. Click on ticker or stock name for detailed view. Click on to add stock symbol to your watchlist and to view watchlist. |
12Stocks.com List of ETFs that track Midcap Index
| Ticker | ETF Name | Watchlist | Recent Price | Smart Investing & Trading Score | Change % | Week % | Year-to-date % |
| IJH | iShares Core S&P Mid-Cap | | 58.53 | 85 | 1.05 | 1.23 | 5.59% |
| IWR | iShares Russell Mid-Cap | | 80.78 | 60 | 0.72 | 0.32 | 3.92% |
| MDY | SPDR S&P MidCap 400 ETF | | 535.41 | 85 | 1.01 | 1.14 | 5.52% |
| IWP | iShares Russell Mid-Cap Growth | | 108.75 | 39 | 0.54 | -0.21 | 4.11% |
| IJK | iShares S&P Mid-Cap 400 Growth | | 87.89 | 78 | 1.02 | 1.02 | 10.94% |
| IWS | iShares Russell Mid-Cap Value | | 120.70 | 78 | 0.80 | 0.59 | 3.79% |
| IJJ | iShares S&P Mid-Cap 400 Value | | 113.77 | 90 | 0.96 | 1.37 | -0.24% |
| XMLV | PowerShares S&P MidCap Low Volatil ETF | | 55.50 | 100 | 0.62 | 1.56 | 4.36% |
| SMDD | ProShares UltraPro Short MidCap400 | | 11.45 | 10 | -2.82 | -3.23 | -14.97% |
| MVV | ProShares Ultra MidCap400 | | 62.72 | 85 | 2.37 | 2.1 | 8.34% |
| UMDD | ProShares UltraPro MidCap400 | | 24.68 | 85 | 3.08 | 3 | 10.56% |
| MYY | ProShares Short MidCap400 | | 20.57 | 28 | -0.76 | -1.04 | -4.11% |
| MZZ | ProShares UltraShort MidCap400 | | 11.46 | 20 | -2.05 | -1.88 | -8.84% |
| 12Stocks.com: Charts, Trends, Fundamental Data and Performances of MidCap Stocks | |
|
We now take in-depth look at all MidCap stocks including charts, multi-period performances and overall trends (as measured by Smart Investing & Trading Score). One can sort MidCap stocks (click link to choose) by Daily, Weekly and by Year-to-Date performances. Also, one can sort by size of the company or by market capitalization. |
| Select Your Default Chart Type: | |||||
| |||||
| Click on stock symbol or name for detailed view. Click on to add stock symbol to your watchlist and to view watchlist. Quick View: Move mouse or cursor over "Daily" to quickly view daily technical stock chart and over "Weekly" to view weekly technical stock chart. | |||||

 | BFAM Bright Horizons Family Solutions Inc. |
| Sector: Services & Goods | |
| SubSector: Personal Services | |
| MarketCap: 5487.65 Millions | |
| Recent Price: 111.23 Smart Investing & Trading Score: 69 | |
| Day Percent Change: 6.67% Day Change: 6.96 | |
| Week Change: 4.27% Year-to-date Change: 18.0% | |
| BFAM Links: Profile News Message Board | |
| Charts:- Daily , Weekly | |
| Add BFAM to Watchlist: View: Get Complete BFAM Trend Analysis ➞ | |
 | RBLX Roblox Corporation |
| Sector: Services & Goods | |
| SubSector: Electronic Gaming & Multimedia | |
| MarketCap: 25420 Millions | |
| Recent Price: 39.24 Smart Investing & Trading Score: 69 | |
| Day Percent Change: 5.44% Day Change: 2.02 | |
| Week Change: 8.97% Year-to-date Change: -15.0% | |
| RBLX Links: Profile News Message Board | |
| Charts:- Daily , Weekly | |
| Add RBLX to Watchlist: View: Get Complete RBLX Trend Analysis ➞ | |
 | MCW Mister Car Wash, Inc. |
| Sector: Services & Goods | |
| SubSector: Personal Services | |
| MarketCap: 2790 Millions | |
| Recent Price: 7.33 Smart Investing & Trading Score: 69 | |
| Day Percent Change: 4.57% Day Change: 0.32 | |
| Week Change: 6.31% Year-to-date Change: -15.0% | |
| MCW Links: Profile News Message Board | |
| Charts:- Daily , Weekly | |
| Add MCW to Watchlist: View: Get Complete MCW Trend Analysis ➞ | |
 | PLTR Palantir Technologies Inc. |
| Sector: Technology | |
| SubSector: Software Infrastructure | |
| MarketCap: 47107 Millions | |
| Recent Price: 23.33 Smart Investing & Trading Score: 69 | |
| Day Percent Change: 3.46% Day Change: 0.78 | |
| Week Change: 3.6% Year-to-date Change: 35.9% | |
| PLTR Links: Profile News Message Board | |
| Charts:- Daily , Weekly | |
| Add PLTR to Watchlist: View: Get Complete PLTR Trend Analysis ➞ | |
 | ALGM Allegro MicroSystems, Inc. |
| Sector: Technology | |
| SubSector: Semiconductors | |
| MarketCap: 50287 Millions | |
| Recent Price: 30.00 Smart Investing & Trading Score: 69 | |
| Day Percent Change: 1.33% Day Change: 0.39 | |
| Week Change: -0.35% Year-to-date Change: -1.0% | |
| ALGM Links: Profile News Message Board | |
| Charts:- Daily , Weekly | |
| Add ALGM to Watchlist: View: Get Complete ALGM Trend Analysis ➞ | |
 | ICUI ICU Medical, Inc. |
| Sector: Health Care | |
| SubSector: Medical Instruments & Supplies | |
| MarketCap: 3640.7 Millions | |
| Recent Price: 99.99 Smart Investing & Trading Score: 69 | |
| Day Percent Change: 0.96% Day Change: 0.95 | |
| Week Change: 5.43% Year-to-date Change: 0.3% | |
| ICUI Links: Profile News Message Board | |
| Charts:- Daily , Weekly | |
| Add ICUI to Watchlist: View: Get Complete ICUI Trend Analysis ➞ | |
 | JLL Jones Lang LaSalle Incorporated |
| Sector: Financials | |
| SubSector: Property Management | |
| MarketCap: 5259.32 Millions | |
| Recent Price: 185.52 Smart Investing & Trading Score: 69 | |
| Day Percent Change: 0.83% Day Change: 1.53 | |
| Week Change: 1.65% Year-to-date Change: -1.8% | |
| JLL Links: Profile News Message Board | |
| Charts:- Daily , Weekly | |
| Add JLL to Watchlist: View: Get Complete JLL Trend Analysis ➞ | |
 | JWN Nordstrom, Inc. |
| Sector: Services & Goods | |
| SubSector: Apparel Stores | |
| MarketCap: 3351.68 Millions | |
| Recent Price: 20.10 Smart Investing & Trading Score: 69 | |
| Day Percent Change: 0.60% Day Change: 0.12 | |
| Week Change: 5.07% Year-to-date Change: 8.9% | |
| JWN Links: Profile News Message Board | |
| Charts:- Daily , Weekly | |
| Add JWN to Watchlist: View: Get Complete JWN Trend Analysis ➞ | |
 | VICI VICI Properties Inc. |
| Sector: Financials | |
| SubSector: REIT - Diversified | |
| MarketCap: 7327.03 Millions | |
| Recent Price: 28.80 Smart Investing & Trading Score: 69 | |
| Day Percent Change: 0.00% Day Change: 0.00 | |
| Week Change: 1.16% Year-to-date Change: -9.7% | |
| VICI Links: Profile News Message Board | |
| Charts:- Daily , Weekly | |
| Add VICI to Watchlist: View: Get Complete VICI Trend Analysis ➞ | |
 | MPWR Monolithic Power Systems, Inc. |
| Sector: Technology | |
| SubSector: Semiconductor - Specialized | |
| MarketCap: 6436.4 Millions | |
| Recent Price: 707.22 Smart Investing & Trading Score: 69 | |
| Day Percent Change: -0.80% Day Change: -5.67 | |
| Week Change: 4.43% Year-to-date Change: 12.1% | |
| MPWR Links: Profile News Message Board | |
| Charts:- Daily , Weekly | |
| Add MPWR to Watchlist: View: Get Complete MPWR Trend Analysis ➞ | |
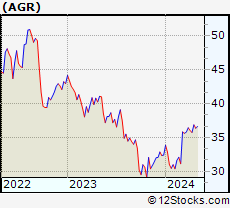 | AGR Avangrid, Inc. |
| Sector: Utilities | |
| SubSector: Gas Utilities | |
| MarketCap: 14337.3 Millions | |
| Recent Price: 36.62 Smart Investing & Trading Score: 69 | |
| Day Percent Change: 0.19% Day Change: 0.07 | |
| Week Change: 0.66% Year-to-date Change: 13.0% | |
| AGR Links: Profile News Message Board | |
| Charts:- Daily , Weekly | |
| Add AGR to Watchlist: View: Get Complete AGR Trend Analysis ➞ | |
 | GNRC Generac Holdings Inc. |
| Sector: Industrials | |
| SubSector: Diversified Machinery | |
| MarketCap: 5736.26 Millions | |
| Recent Price: 133.38 Smart Investing & Trading Score: 68 | |
| Day Percent Change: 3.67% Day Change: 4.72 | |
| Week Change: -4.81% Year-to-date Change: 3.2% | |
| GNRC Links: Profile News Message Board | |
| Charts:- Daily , Weekly | |
| Add GNRC to Watchlist: View: Get Complete GNRC Trend Analysis ➞ | |
 | NDAQ Nasdaq, Inc. |
| Sector: Financials | |
| SubSector: Diversified Investments | |
| MarketCap: 14885.2 Millions | |
| Recent Price: 60.87 Smart Investing & Trading Score: 68 | |
| Day Percent Change: 1.33% Day Change: 0.80 | |
| Week Change: 1.25% Year-to-date Change: 4.7% | |
| NDAQ Links: Profile News Message Board | |
| Charts:- Daily , Weekly | |
| Add NDAQ to Watchlist: View: Get Complete NDAQ Trend Analysis ➞ | |
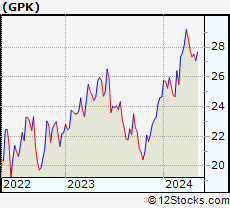 | GPK Graphic Packaging Holding Company |
| Sector: Consumer Staples | |
| SubSector: Packaging & Containers | |
| MarketCap: 3350.23 Millions | |
| Recent Price: 27.09 Smart Investing & Trading Score: 68 | |
| Day Percent Change: 0.86% Day Change: 0.23 | |
| Week Change: -1.6% Year-to-date Change: 9.9% | |
| GPK Links: Profile News Message Board | |
| Charts:- Daily , Weekly | |
| Add GPK to Watchlist: View: Get Complete GPK Trend Analysis ➞ | |
 | CPB Campbell Soup Company |
| Sector: Consumer Staples | |
| SubSector: Processed & Packaged Goods | |
| MarketCap: 14468.8 Millions | |
| Recent Price: 44.88 Smart Investing & Trading Score: 68 | |
| Day Percent Change: -2.20% Day Change: -1.01 | |
| Week Change: 0.07% Year-to-date Change: 3.8% | |
| CPB Links: Profile News Message Board | |
| Charts:- Daily , Weekly | |
| Add CPB to Watchlist: View: Get Complete CPB Trend Analysis ➞ | |
 | IRDM Iridium Communications Inc. |
| Sector: Technology | |
| SubSector: Diversified Communication Services | |
| MarketCap: 2711.24 Millions | |
| Recent Price: 30.32 Smart Investing & Trading Score: 68 | |
| Day Percent Change: -2.13% Day Change: -0.66 | |
| Week Change: -3.35% Year-to-date Change: -26.3% | |
| IRDM Links: Profile News Message Board | |
| Charts:- Daily , Weekly | |
| Add IRDM to Watchlist: View: Get Complete IRDM Trend Analysis ➞ | |
 | AMG Affiliated Managers Group, Inc. |
| Sector: Financials | |
| SubSector: Asset Management | |
| MarketCap: 2849.63 Millions | |
| Recent Price: 160.35 Smart Investing & Trading Score: 68 | |
| Day Percent Change: -0.19% Day Change: -0.30 | |
| Week Change: 0.09% Year-to-date Change: 5.9% | |
| AMG Links: Profile News Message Board | |
| Charts:- Daily , Weekly | |
| Add AMG to Watchlist: View: Get Complete AMG Trend Analysis ➞ | |
 | LAMR Lamar Advertising Company (REIT) |
| Sector: Financials | |
| SubSector: REIT - Diversified | |
| MarketCap: 4838.33 Millions | |
| Recent Price: 115.08 Smart Investing & Trading Score: 68 | |
| Day Percent Change: -3.03% Day Change: -3.60 | |
| Week Change: 0.62% Year-to-date Change: 8.3% | |
| LAMR Links: Profile News Message Board | |
| Charts:- Daily , Weekly | |
| Add LAMR to Watchlist: View: Get Complete LAMR Trend Analysis ➞ | |
 | AMC AMC Entertainment Holdings, Inc. |
| Sector: Services & Goods | |
| SubSector: Movie Production, Theaters | |
| MarketCap: 415.929 Millions | |
| Recent Price: 3.30 Smart Investing & Trading Score: 67 | |
| Day Percent Change: 5.43% Day Change: 0.17 | |
| Week Change: -3.23% Year-to-date Change: -46.1% | |
| AMC Links: Profile News Message Board | |
| Charts:- Daily , Weekly | |
| Add AMC to Watchlist: View: Get Complete AMC Trend Analysis ➞ | |
 | ELS Equity LifeStyle Properties, Inc. |
| Sector: Financials | |
| SubSector: REIT - Residential | |
| MarketCap: 9570.61 Millions | |
| Recent Price: 63.33 Smart Investing & Trading Score: 67 | |
| Day Percent Change: 0.27% Day Change: 0.17 | |
| Week Change: 4.63% Year-to-date Change: -10.2% | |
| ELS Links: Profile News Message Board | |
| Charts:- Daily , Weekly | |
| Add ELS to Watchlist: View: Get Complete ELS Trend Analysis ➞ | |
 | OLPX Olaplex Holdings, Inc. |
| Sector: Services & Goods | |
| SubSector: Specialty Retail | |
| MarketCap: 2340 Millions | |
| Recent Price: 1.59 Smart Investing & Trading Score: 67 | |
| Day Percent Change: -5.09% Day Change: -0.08 | |
| Week Change: 18.28% Year-to-date Change: -38.1% | |
| OLPX Links: Profile News Message Board | |
| Charts:- Daily , Weekly | |
| Add OLPX to Watchlist: View: Get Complete OLPX Trend Analysis ➞ | |
 | INCY Incyte Corporation |
| Sector: Health Care | |
| SubSector: Biotechnology | |
| MarketCap: 15343.2 Millions | |
| Recent Price: 53.76 Smart Investing & Trading Score: 67 | |
| Day Percent Change: 1.26% Day Change: 0.67 | |
| Week Change: 4.02% Year-to-date Change: -14.4% | |
| INCY Links: Profile News Message Board | |
| Charts:- Daily , Weekly | |
| Add INCY to Watchlist: View: Get Complete INCY Trend Analysis ➞ | |
 | G Genpact Limited |
| Sector: Technology | |
| SubSector: Information Technology Services | |
| MarketCap: 5485.78 Millions | |
| Recent Price: 31.34 Smart Investing & Trading Score: 67 | |
| Day Percent Change: 0.10% Day Change: 0.03 | |
| Week Change: 1.42% Year-to-date Change: -9.7% | |
| G Links: Profile News Message Board | |
| Charts:- Daily , Weekly | |
| Add G to Watchlist: View: Get Complete G Trend Analysis ➞ | |
 | GLPI Gaming and Leisure Properties, Inc. |
| Sector: Financials | |
| SubSector: REIT - Diversified | |
| MarketCap: 4922.33 Millions | |
| Recent Price: 43.20 Smart Investing & Trading Score: 67 | |
| Day Percent Change: -0.69% Day Change: -0.30 | |
| Week Change: 1.74% Year-to-date Change: -12.5% | |
| GLPI Links: Profile News Message Board | |
| Charts:- Daily , Weekly | |
| Add GLPI to Watchlist: View: Get Complete GLPI Trend Analysis ➞ | |
 | UNM Unum Group |
| Sector: Financials | |
| SubSector: Accident & Health Insurance | |
| MarketCap: 2760.9 Millions | |
| Recent Price: 51.62 Smart Investing & Trading Score: 66 | |
| Day Percent Change: -0.14% Day Change: -0.07 | |
| Week Change: 1.71% Year-to-date Change: 14.2% | |
| UNM Links: Profile News Message Board | |
| Charts:- Daily , Weekly | |
| Add UNM to Watchlist: View: Get Complete UNM Trend Analysis ➞ | |
| For tabular summary view of above stock list: Summary View ➞ 0 - 25 , 25 - 50 , 50 - 75 , 75 - 100 , 100 - 125 , 125 - 150 , 150 - 175 , 175 - 200 , 200 - 225 , 225 - 250 , 250 - 275 , 275 - 300 , 300 - 325 , 325 - 350 , 350 - 375 , 375 - 400 , 400 - 425 , 425 - 450 , 450 - 475 , 475 - 500 , 500 - 525 , 525 - 550 , 550 - 575 , 575 - 600 , 600 - 625 , 625 - 650 , 650 - 675 , 675 - 700 , 700 - 725 , 725 - 750 , 750 - 775 | ||
| Click To Change The Sort Order: By Market Cap or Company Size Performance: Year-to-date, Week and Day | |
| Select Chart Type: | ||
|
Best Stocks Today 12Stocks.com |
© 2024 12Stocks.com Terms & Conditions Privacy Contact Us
All Information Provided Only For Education And Not To Be Used For Investing or Trading. See Terms & Conditions


One More Thing ... Get Best Stocks Delivered Daily!
Never Ever Miss A Move With Our Top Ten Stocks Lists
Find Best Stocks In Any Market - Bull or Bear Market
Take A Peek At Our Top Ten Stocks Lists: Daily, Weekly, Year-to-Date & Top Trends
Find Best Stocks In Any Market - Bull or Bear Market
Take A Peek At Our Top Ten Stocks Lists: Daily, Weekly, Year-to-Date & Top Trends
Midcap Stocks With Best Up Trends [0-bearish to 100-bullish]: GameStop [100], Tandem Diabetes[100], MasTec [100], Frontier [100], Organon [100], First Solar[100], Reinsurance [100], Brookfield Renewable[100], Camden Property[100], Aptiv [100], Texas Roadhouse[100]
Best Midcap Stocks Year-to-Date:
Vistra Energy[111.55%], AppLovin [88.57%], ShockWave Medical[73.37%], EMCOR [68.86%], Constellation Energy[66.35%], CAVA [65.92%], Tenet [59.16%], Spotify [57.56%], Natera [54.82%], Wingstop [51.43%], Tandem Diabetes[51.18%] Best Midcap Stocks This Week:
GameStop [38.4%], Tandem Diabetes[26.9%], Tenet [25.12%], Wayfair [22.26%], Brookfield Renewable[21.71%], Bio-Techne [20.65%], Pinterest [18.99%], New York[18.86%], Olaplex [18.28%], Valmont Industries[17.25%], NovoCure [16.98%] Best Midcap Stocks Daily:
GameStop [29.08%], Tandem Diabetes[22.32%], Ginkgo Bioworks[12.33%], Paylocity Holding[12.05%], MasTec [11.87%], Plug Power[11.84%], Peloton Interactive[9.42%], Universal Display[9.28%], Sunrun [8.68%], Frontier [8.66%], Wayfair [8.44%]