
 Login Sign Up


| |||||
 |  | ||||

| 12Stocks.com Market Intelligence |
Best MidCap Stocks
|
| In a hurry? Mid Cap Stocks Lists: Performance Trends Table, Stock Charts
Sort midcap stocks: Daily, Weekly, Year-to-Date, Market Cap & Trends. Filter midcap stocks list by sector: Show all, Tech, Finance, Energy, Staples, Retail, Industrial, Materials, Utilities and HealthCare Filter midcap stocks list by size:All MidCap Large Mid-Range Small |
| 12Stocks.com Mid Cap Stocks Performances & Trends Daily | |||||||||
|
|  The overall Smart Investing & Trading Score is 36 (0-bearish to 100-bullish) which puts Mid Cap index in short term bearish to neutral trend. The Smart Investing & Trading Score from previous trading session is 26 and hence an improvement of trend.
| ||||||||
Here are the Smart Investing & Trading Scores of the most requested mid cap stocks at 12Stocks.com (click stock name for detailed review):
|


| 12Stocks.com: Top Performing Mid Cap Index Stocks | ||||||||||||||||||||||||||||||||||||||||||||||||
 The top performing Mid Cap Index stocks year to date are
Now, more recently, over last week, the top performing Mid Cap Index stocks on the move are


|
||||||||||||||||||||||||||||||||||||||||||||||||
| 12Stocks.com: Investing in Midcap Index with Stocks | |
|
The following table helps investors and traders sort through current performance and trends (as measured by Smart Investing & Trading Score) of various
stocks in the Midcap Index. Quick View: Move mouse or cursor over stock symbol (ticker) to view short-term technical chart and over stock name to view long term chart. Click on  to add stock symbol to your watchlist and to add stock symbol to your watchlist and  to view watchlist. Click on any ticker or stock name for detailed market intelligence report for that stock. to view watchlist. Click on any ticker or stock name for detailed market intelligence report for that stock. |
12Stocks.com Performance of Stocks in Midcap Index
| Ticker | Stock Name | Watchlist | Category | Recent Price | Smart Investing & Trading Score | Change % | YTD Change% |
| ZBRA | Zebra Technologies |   | Technology | 273.03 | 36 | -1.13% | -0.11% |
| CRL | Charles River | | Health Care | 227.55 | 36 | -1.10% | -3.74% |
| MRO | Marathon Oil | | Energy | 27.40 | 36 | -1.01% | 13.41% |
| LPX | Louisiana-Pacific | | Services & Goods | 72.02 | 36 | -1.00% | 1.68% |
| RBA | Ritchie Bros. | | Services & Goods | 72.49 | 36 | -0.98% | 8.37% |
| EME | EMCOR | | Industrials | 336.06 | 36 | -0.93% | 55.99% |
| HII | Huntington Ingalls | | Industrials | 268.84 | 36 | -0.88% | 3.54% |
| AWI | Armstrong World | | Industrials | 113.85 | 36 | -0.73% | 15.80% |
| H | Hyatt Hotels | | Services & Goods | 147.80 | 36 | -0.70% | 13.33% |
| MASI | Masimo | | Health Care | 135.92 | 36 | -0.51% | 15.96% |
| CDW | CDW | | Technology | 235.70 | 36 | -0.46% | 3.69% |
| AMG | Affiliated Managers | | Financials | 158.19 | 36 | -0.45% | 4.47% |
| SPG | Simon Property | | Financials | 140.37 | 36 | -0.40% | -1.59% |
| GGG | Graco | | Industrials | 88.09 | 36 | -0.38% | 1.53% |
| SCI | Service | | Services & Goods | 68.26 | 36 | -0.36% | -0.28% |
| IEX | IDEX | | Industrials | 226.10 | 36 | -0.32% | 4.14% |
| PHM | Pulte | | Industrials | 105.96 | 36 | -0.18% | 2.65% |
| MHK | Mohawk Industries | | Consumer Staples | 108.08 | 36 | -0.18% | 4.43% |
| PKG | Packaging | | Consumer Staples | 178.25 | 36 | -0.15% | 9.42% |
| VNT | Vontier | | Technology | 40.33 | 36 | -0.15% | 16.73% |
| SEIC | SEI s | | Financials | 66.01 | 36 | -0.11% | 3.87% |
| AVT | Avnet | | Services & Goods | 46.54 | 36 | -0.11% | -7.66% |
| NEU | NewMarket | | Materials | 583.38 | 36 | -0.10% | 6.88% |
| DPZ | Domino s | | Services & Goods | 481.66 | 36 | -0.08% | 16.84% |
| IQV | IQVIA | | Health Care | 227.17 | 36 | -0.04% | -1.82% |
| For chart view version of above stock list: Chart View ➞ 0 - 25 , 25 - 50 , 50 - 75 , 75 - 100 , 100 - 125 , 125 - 150 , 150 - 175 , 175 - 200 , 200 - 225 , 225 - 250 , 250 - 275 , 275 - 300 , 300 - 325 , 325 - 350 , 350 - 375 , 375 - 400 , 400 - 425 , 425 - 450 , 450 - 475 , 475 - 500 , 500 - 525 , 525 - 550 , 550 - 575 , 575 - 600 , 600 - 625 , 625 - 650 , 650 - 675 , 675 - 700 , 700 - 725 , 725 - 750 , 750 - 775 | ||
 | Click To Change The Sort Order: By Market Cap or Company Size Performance: Year-to-date, Week and Day |  |
|
Get the most comprehensive stock market coverage daily at 12Stocks.com ➞ Best Stocks Today ➞ Best Stocks Weekly ➞ Best Stocks Year-to-Date ➞ Best Stocks Trends ➞  Best Stocks Today 12Stocks.com Best Nasdaq Stocks ➞ Best S&P 500 Stocks ➞ Best Tech Stocks ➞ Best Biotech Stocks ➞ |
| Detailed Overview of Midcap Stocks |
| Midcap Technical Overview, Leaders & Laggards, Top Midcap ETF Funds & Detailed Midcap Stocks List, Charts, Trends & More |
| Midcap: Technical Analysis, Trends & YTD Performance | |
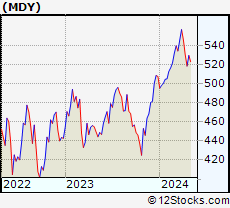
| MidCap segment as represented by
MDY, an exchange-traded fund [ETF], holds basket of about four hundred midcap stocks from across all major sectors of the US stock market. The midcap index (contains stocks like Green Mountain Coffee Roasters and Tractor Supply Company) is up by 1.81% and is currently underperforming the overall market by -2.38% year-to-date. Below is a quick view of technical charts and trends: | |
 MDY Weekly Chart |
|
| Long Term Trend: Good | |
| Medium Term Trend: Not Good | |
 MDY Daily Chart |
|
| Short Term Trend: Not Good | |
| Overall Trend Score: 36 | |
| YTD Performance: 1.81% | |
| **Trend Scores & Views Are Only For Educational Purposes And Not For Investing | |
| 12Stocks.com: Investing in Midcap Index using Exchange Traded Funds | |
|
The following table shows list of key exchange traded funds (ETF) that
help investors track Midcap index. The following list also includes leveraged ETF funds that track twice or thrice the daily returns of Midcap indices. Short or inverse ETF funds move in the opposite direction to the index they track and are useful during market pullbacks or during bear markets. Quick View: Move mouse or cursor over ETF symbol (ticker) to view short-term technical chart and over ETF name to view long term chart. Click on ticker or stock name for detailed view. Click on to add stock symbol to your watchlist and to view watchlist. |
12Stocks.com List of ETFs that track Midcap Index
| Ticker | ETF Name | Watchlist | Recent Price | Smart Investing & Trading Score | Change % | Week % | Year-to-date % |
| IJH | iShares Core S&P Mid-Cap | | 56.43 | 41 | -0.14 | -2.52 | 1.8% |
| IWR | iShares Russell Mid-Cap | | 78.71 | 36 | -0.14 | -2.37 | 1.26% |
| MDY | SPDR S&P MidCap 400 ETF | | 516.55 | 36 | -0.14 | -2.53 | 1.81% |
| IWP | iShares Russell Mid-Cap Growth | | 106.50 | 36 | -0.49 | -3.04 | 1.95% |
| IWS | iShares Russell Mid-Cap Value | | 117.31 | 41 | -0.09 | -2.15 | 0.88% |
| IJK | iShares S&P Mid-Cap 400 Growth | | 85.03 | 41 | -0.36 | -2.8 | 7.33% |
| IJJ | iShares S&P Mid-Cap 400 Value | | 109.46 | 23 | 0.02 | -2.26 | -4.02% |
| XMLV | PowerShares S&P MidCap Low Volatil ETF | | 53.59 | 54 | 0.41 | -1.22 | 0.77% |
| UMDD | ProShares UltraPro MidCap400 | | 22.31 | 36 | -0.63 | -7.71 | -0.05% |
| MVV | ProShares Ultra MidCap400 | | 58.42 | 36 | -0.70 | -5.36 | 0.92% |
| SMDD | ProShares UltraPro Short MidCap400 | | 12.69 | 59 | 1.20 | 8 | -5.75% |
| MYY | ProShares Short MidCap400 | | 21.26 | 69 | 0.24 | 2.7 | -0.91% |
| MZZ | ProShares UltraShort MidCap400 | | 12.23 | 34 | 1.37 | 5.43 | -2.71% |
| 12Stocks.com: Charts, Trends, Fundamental Data and Performances of MidCap Stocks | |
|
We now take in-depth look at all MidCap stocks including charts, multi-period performances and overall trends (as measured by Smart Investing & Trading Score). One can sort MidCap stocks (click link to choose) by Daily, Weekly and by Year-to-Date performances. Also, one can sort by size of the company or by market capitalization. |
| Select Your Default Chart Type: | |||||
| |||||
| Click on stock symbol or name for detailed view. Click on to add stock symbol to your watchlist and to view watchlist. Quick View: Move mouse or cursor over "Daily" to quickly view daily technical stock chart and over "Weekly" to view weekly technical stock chart. | |||||

 | ZBRA Zebra Technologies Corporation |
| Sector: Technology | |
| SubSector: Communication Equipment | |
| MarketCap: 11474.9 Millions | |
| Recent Price: 273.03 Smart Investing & Trading Score: 36 | |
| Day Percent Change: -1.13% Day Change: -3.11 | |
| Week Change: -5.75% Year-to-date Change: -0.1% | |
| ZBRA Links: Profile News Message Board | |
| Charts:- Daily , Weekly | |
| Add ZBRA to Watchlist: View: Get Complete ZBRA Trend Analysis ➞ | |
 | CRL Charles River Laboratories International, Inc. |
| Sector: Health Care | |
| SubSector: Medical Laboratories & Research | |
| MarketCap: 5700.5 Millions | |
| Recent Price: 227.55 Smart Investing & Trading Score: 36 | |
| Day Percent Change: -1.10% Day Change: -2.54 | |
| Week Change: -5.71% Year-to-date Change: -3.7% | |
| CRL Links: Profile News Message Board | |
| Charts:- Daily , Weekly | |
| Add CRL to Watchlist: View: Get Complete CRL Trend Analysis ➞ | |
 | MRO Marathon Oil Corporation |
| Sector: Energy | |
| SubSector: Independent Oil & Gas | |
| MarketCap: 2911.53 Millions | |
| Recent Price: 27.40 Smart Investing & Trading Score: 36 | |
| Day Percent Change: -1.01% Day Change: -0.28 | |
| Week Change: -5.81% Year-to-date Change: 13.4% | |
| MRO Links: Profile News Message Board | |
| Charts:- Daily , Weekly | |
| Add MRO to Watchlist: View: Get Complete MRO Trend Analysis ➞ | |
 | LPX Louisiana-Pacific Corporation |
| Sector: Services & Goods | |
| SubSector: Building Materials Wholesale | |
| MarketCap: 1943.43 Millions | |
| Recent Price: 72.02 Smart Investing & Trading Score: 36 | |
| Day Percent Change: -1.00% Day Change: -0.73 | |
| Week Change: -6.19% Year-to-date Change: 1.7% | |
| LPX Links: Profile News Message Board | |
| Charts:- Daily , Weekly | |
| Add LPX to Watchlist: View: Get Complete LPX Trend Analysis ➞ | |
 | RBA Ritchie Bros. Auctioneers Incorporated |
| Sector: Services & Goods | |
| SubSector: Business Services | |
| MarketCap: 3491.02 Millions | |
| Recent Price: 72.49 Smart Investing & Trading Score: 36 | |
| Day Percent Change: -0.98% Day Change: -0.72 | |
| Week Change: -1.13% Year-to-date Change: 8.4% | |
| RBA Links: Profile News Message Board | |
| Charts:- Daily , Weekly | |
| Add RBA to Watchlist: View: Get Complete RBA Trend Analysis ➞ | |
 | EME EMCOR Group, Inc. |
| Sector: Industrials | |
| SubSector: General Contractors | |
| MarketCap: 3417.83 Millions | |
| Recent Price: 336.06 Smart Investing & Trading Score: 36 | |
| Day Percent Change: -0.93% Day Change: -3.14 | |
| Week Change: -4.5% Year-to-date Change: 56.0% | |
| EME Links: Profile News Message Board | |
| Charts:- Daily , Weekly | |
| Add EME to Watchlist: View: Get Complete EME Trend Analysis ➞ | |
 | HII Huntington Ingalls Industries, Inc. |
| Sector: Industrials | |
| SubSector: Aerospace/Defense Products & Services | |
| MarketCap: 7276.11 Millions | |
| Recent Price: 268.84 Smart Investing & Trading Score: 36 | |
| Day Percent Change: -0.88% Day Change: -2.38 | |
| Week Change: -2.5% Year-to-date Change: 3.5% | |
| HII Links: Profile News Message Board | |
| Charts:- Daily , Weekly | |
| Add HII to Watchlist: View: Get Complete HII Trend Analysis ➞ | |
 | AWI Armstrong World Industries, Inc. |
| Sector: Industrials | |
| SubSector: General Building Materials | |
| MarketCap: 3609.53 Millions | |
| Recent Price: 113.85 Smart Investing & Trading Score: 36 | |
| Day Percent Change: -0.73% Day Change: -0.84 | |
| Week Change: -2.85% Year-to-date Change: 15.8% | |
| AWI Links: Profile News Message Board | |
| Charts:- Daily , Weekly | |
| Add AWI to Watchlist: View: Get Complete AWI Trend Analysis ➞ | |
 | H Hyatt Hotels Corporation |
| Sector: Services & Goods | |
| SubSector: Lodging | |
| MarketCap: 5525.56 Millions | |
| Recent Price: 147.80 Smart Investing & Trading Score: 36 | |
| Day Percent Change: -0.70% Day Change: -1.04 | |
| Week Change: -3.24% Year-to-date Change: 13.3% | |
| H Links: Profile News Message Board | |
| Charts:- Daily , Weekly | |
| Add H to Watchlist: View: Get Complete H Trend Analysis ➞ | |
 | MASI Masimo Corporation |
| Sector: Health Care | |
| SubSector: Medical Instruments & Supplies | |
| MarketCap: 8493.2 Millions | |
| Recent Price: 135.92 Smart Investing & Trading Score: 36 | |
| Day Percent Change: -0.51% Day Change: -0.70 | |
| Week Change: -1.45% Year-to-date Change: 16.0% | |
| MASI Links: Profile News Message Board | |
| Charts:- Daily , Weekly | |
| Add MASI to Watchlist: View: Get Complete MASI Trend Analysis ➞ | |
 | CDW CDW Corporation |
| Sector: Technology | |
| SubSector: Information Technology Services | |
| MarketCap: 12775 Millions | |
| Recent Price: 235.70 Smart Investing & Trading Score: 36 | |
| Day Percent Change: -0.46% Day Change: -1.08 | |
| Week Change: -2.97% Year-to-date Change: 3.7% | |
| CDW Links: Profile News Message Board | |
| Charts:- Daily , Weekly | |
| Add CDW to Watchlist: View: Get Complete CDW Trend Analysis ➞ | |
 | AMG Affiliated Managers Group, Inc. |
| Sector: Financials | |
| SubSector: Asset Management | |
| MarketCap: 2849.63 Millions | |
| Recent Price: 158.19 Smart Investing & Trading Score: 36 | |
| Day Percent Change: -0.45% Day Change: -0.72 | |
| Week Change: -2.45% Year-to-date Change: 4.5% | |
| AMG Links: Profile News Message Board | |
| Charts:- Daily , Weekly | |
| Add AMG to Watchlist: View: Get Complete AMG Trend Analysis ➞ | |
 | SPG Simon Property Group, Inc. |
| Sector: Financials | |
| SubSector: REIT - Retail | |
| MarketCap: 17959.6 Millions | |
| Recent Price: 140.37 Smart Investing & Trading Score: 36 | |
| Day Percent Change: -0.40% Day Change: -0.57 | |
| Week Change: -3.07% Year-to-date Change: -1.6% | |
| SPG Links: Profile News Message Board | |
| Charts:- Daily , Weekly | |
| Add SPG to Watchlist: View: Get Complete SPG Trend Analysis ➞ | |
 | GGG Graco Inc. |
| Sector: Industrials | |
| SubSector: Diversified Machinery | |
| MarketCap: 7739.76 Millions | |
| Recent Price: 88.09 Smart Investing & Trading Score: 36 | |
| Day Percent Change: -0.38% Day Change: -0.34 | |
| Week Change: -1.54% Year-to-date Change: 1.5% | |
| GGG Links: Profile News Message Board | |
| Charts:- Daily , Weekly | |
| Add GGG to Watchlist: View: Get Complete GGG Trend Analysis ➞ | |
 | SCI Service Corporation International |
| Sector: Services & Goods | |
| SubSector: Personal Services | |
| MarketCap: 7216.05 Millions | |
| Recent Price: 68.26 Smart Investing & Trading Score: 36 | |
| Day Percent Change: -0.36% Day Change: -0.25 | |
| Week Change: -2.22% Year-to-date Change: -0.3% | |
| SCI Links: Profile News Message Board | |
| Charts:- Daily , Weekly | |
| Add SCI to Watchlist: View: Get Complete SCI Trend Analysis ➞ | |
 | IEX IDEX Corporation |
| Sector: Industrials | |
| SubSector: Diversified Machinery | |
| MarketCap: 9721.46 Millions | |
| Recent Price: 226.10 Smart Investing & Trading Score: 36 | |
| Day Percent Change: -0.32% Day Change: -0.73 | |
| Week Change: -2.82% Year-to-date Change: 4.1% | |
| IEX Links: Profile News Message Board | |
| Charts:- Daily , Weekly | |
| Add IEX to Watchlist: View: Get Complete IEX Trend Analysis ➞ | |
 | PHM PulteGroup, Inc. |
| Sector: Industrials | |
| SubSector: Residential Construction | |
| MarketCap: 6186.46 Millions | |
| Recent Price: 105.96 Smart Investing & Trading Score: 36 | |
| Day Percent Change: -0.18% Day Change: -0.19 | |
| Week Change: -4.45% Year-to-date Change: 2.7% | |
| PHM Links: Profile News Message Board | |
| Charts:- Daily , Weekly | |
| Add PHM to Watchlist: View: Get Complete PHM Trend Analysis ➞ | |
 | MHK Mohawk Industries, Inc. |
| Sector: Consumer Staples | |
| SubSector: Home Furnishings & Fixtures | |
| MarketCap: 4682.25 Millions | |
| Recent Price: 108.08 Smart Investing & Trading Score: 36 | |
| Day Percent Change: -0.18% Day Change: -0.19 | |
| Week Change: -4.5% Year-to-date Change: 4.4% | |
| MHK Links: Profile News Message Board | |
| Charts:- Daily , Weekly | |
| Add MHK to Watchlist: View: Get Complete MHK Trend Analysis ➞ | |
 | PKG Packaging Corporation of America |
| Sector: Consumer Staples | |
| SubSector: Packaging & Containers | |
| MarketCap: 8963 Millions | |
| Recent Price: 178.25 Smart Investing & Trading Score: 36 | |
| Day Percent Change: -0.15% Day Change: -0.26 | |
| Week Change: -2.17% Year-to-date Change: 9.4% | |
| PKG Links: Profile News Message Board | |
| Charts:- Daily , Weekly | |
| Add PKG to Watchlist: View: Get Complete PKG Trend Analysis ➞ | |
 | VNT Vontier Corporation |
| Sector: Technology | |
| SubSector: Scientific & Technical Instruments | |
| MarketCap: 53787 Millions | |
| Recent Price: 40.33 Smart Investing & Trading Score: 36 | |
| Day Percent Change: -0.15% Day Change: -0.06 | |
| Week Change: -2.98% Year-to-date Change: 16.7% | |
| VNT Links: Profile News Message Board | |
| Charts:- Daily , Weekly | |
| Add VNT to Watchlist: View: Get Complete VNT Trend Analysis ➞ | |
 | SEIC SEI Investments Company |
| Sector: Financials | |
| SubSector: Asset Management | |
| MarketCap: 6367.03 Millions | |
| Recent Price: 66.01 Smart Investing & Trading Score: 36 | |
| Day Percent Change: -0.11% Day Change: -0.07 | |
| Week Change: -2.18% Year-to-date Change: 3.9% | |
| SEIC Links: Profile News Message Board | |
| Charts:- Daily , Weekly | |
| Add SEIC to Watchlist: View: Get Complete SEIC Trend Analysis ➞ | |
 | AVT Avnet, Inc. |
| Sector: Services & Goods | |
| SubSector: Electronics Wholesale | |
| MarketCap: 2776.33 Millions | |
| Recent Price: 46.54 Smart Investing & Trading Score: 36 | |
| Day Percent Change: -0.11% Day Change: -0.05 | |
| Week Change: -1.46% Year-to-date Change: -7.7% | |
| AVT Links: Profile News Message Board | |
| Charts:- Daily , Weekly | |
| Add AVT to Watchlist: View: Get Complete AVT Trend Analysis ➞ | |
 | NEU NewMarket Corporation |
| Sector: Materials | |
| SubSector: Specialty Chemicals | |
| MarketCap: 4543.77 Millions | |
| Recent Price: 583.38 Smart Investing & Trading Score: 36 | |
| Day Percent Change: -0.10% Day Change: -0.58 | |
| Week Change: -1.58% Year-to-date Change: 6.9% | |
| NEU Links: Profile News Message Board | |
| Charts:- Daily , Weekly | |
| Add NEU to Watchlist: View: Get Complete NEU Trend Analysis ➞ | |
 | DPZ Domino s Pizza, Inc. |
| Sector: Services & Goods | |
| SubSector: Restaurants | |
| MarketCap: 12166 Millions | |
| Recent Price: 481.66 Smart Investing & Trading Score: 36 | |
| Day Percent Change: -0.08% Day Change: -0.39 | |
| Week Change: -2.76% Year-to-date Change: 16.8% | |
| DPZ Links: Profile News Message Board | |
| Charts:- Daily , Weekly | |
| Add DPZ to Watchlist: View: Get Complete DPZ Trend Analysis ➞ | |
 | IQV IQVIA Holdings Inc. |
| Sector: Health Care | |
| SubSector: Medical Laboratories & Research | |
| MarketCap: 19616.5 Millions | |
| Recent Price: 227.17 Smart Investing & Trading Score: 36 | |
| Day Percent Change: -0.04% Day Change: -0.08 | |
| Week Change: -3.01% Year-to-date Change: -1.8% | |
| IQV Links: Profile News Message Board | |
| Charts:- Daily , Weekly | |
| Add IQV to Watchlist: View: Get Complete IQV Trend Analysis ➞ | |
| For tabular summary view of above stock list: Summary View ➞ 0 - 25 , 25 - 50 , 50 - 75 , 75 - 100 , 100 - 125 , 125 - 150 , 150 - 175 , 175 - 200 , 200 - 225 , 225 - 250 , 250 - 275 , 275 - 300 , 300 - 325 , 325 - 350 , 350 - 375 , 375 - 400 , 400 - 425 , 425 - 450 , 450 - 475 , 475 - 500 , 500 - 525 , 525 - 550 , 550 - 575 , 575 - 600 , 600 - 625 , 625 - 650 , 650 - 675 , 675 - 700 , 700 - 725 , 725 - 750 , 750 - 775 | ||
| Click To Change The Sort Order: By Market Cap or Company Size Performance: Year-to-date, Week and Day | |
| Select Chart Type: | ||
|
Best Stocks Today 12Stocks.com |
© 2024 12Stocks.com Terms & Conditions Privacy Contact Us
All Information Provided Only For Education And Not To Be Used For Investing or Trading. See Terms & Conditions


One More Thing ... Get Best Stocks Delivered Daily!
Never Ever Miss A Move With Our Top Ten Stocks Lists
Find Best Stocks In Any Market - Bull or Bear Market
Take A Peek At Our Top Ten Stocks Lists: Daily, Weekly, Year-to-Date & Top Trends
Find Best Stocks In Any Market - Bull or Bear Market
Take A Peek At Our Top Ten Stocks Lists: Daily, Weekly, Year-to-Date & Top Trends
Midcap Stocks With Best Up Trends [0-bearish to 100-bullish]: Genuine Parts[100], United Airlines[100], Medical Properties[100], Alaska Air[100], Flowers Foods[100], HEICO [95], Generac [93], Bunge [93], Conagra [93], Inspire Medical[93], Coupang [90]
Best Midcap Stocks Year-to-Date:
AppLovin [77.99%], ShockWave Medical[71.87%], Vistra Energy[71.03%], Constellation Energy[59.78%], EMCOR [55.99%], Spotify [53.9%], Pure Storage[45.32%], CAVA [44.09%], Natera [39.34%], Wingstop [38.9%], Williams-Sonoma [38.53%] Best Midcap Stocks This Week:
Medical Properties[25.06%], United Airlines[23.01%], Genuine Parts[10.21%], AMC Entertainment[10.19%], Globe Life[10%], Advance Auto[9.5%], Bentley [8.14%], Alaska Air[7.6%], American Airlines[6.62%], Flowers Foods[6.28%], agilon health[5.96%] Best Midcap Stocks Daily:
Genuine Parts[11.22%], Ally Financial[6.73%], Coinbase Global[5.90%], Manpower [5.65%], United Airlines[5.50%], Iridium [5.46%], Ginkgo Bioworks[5.13%], Bank OZK[4.73%], agilon health[4.69%], Medical Properties[4.61%], Kohl s[4.53%]