
 Login Sign Up


| |||||
 |  | ||||

| 12Stocks.com Market Intelligence |
Best MidCap Stocks
|
| In a hurry? Mid Cap Stocks Lists: Performance Trends Table, Stock Charts
Sort midcap stocks: Daily, Weekly, Year-to-Date, Market Cap & Trends. Filter midcap stocks list by sector: Show all, Tech, Finance, Energy, Staples, Retail, Industrial, Materials, Utilities and HealthCare Filter midcap stocks list by size:All MidCap Large Mid-Range Small |
| 12Stocks.com Mid Cap Stocks Performances & Trends Daily | |||||||||
|
|  The overall Smart Investing & Trading Score is 70 (0-bearish to 100-bullish) which puts Mid Cap index in short term neutral to bullish trend. The Smart Investing & Trading Score from previous trading session is 56 and hence an improvement of trend.
| ||||||||
Here are the Smart Investing & Trading Scores of the most requested mid cap stocks at 12Stocks.com (click stock name for detailed review):
|


| 12Stocks.com: Top Performing Mid Cap Index Stocks | ||||||||||||||||||||||||||||||||||||||||||||||||
 The top performing Mid Cap Index stocks year to date are
Now, more recently, over last week, the top performing Mid Cap Index stocks on the move are


|
||||||||||||||||||||||||||||||||||||||||||||||||
| 12Stocks.com: Investing in Midcap Index with Stocks | |
|
The following table helps investors and traders sort through current performance and trends (as measured by Smart Investing & Trading Score) of various
stocks in the Midcap Index. Quick View: Move mouse or cursor over stock symbol (ticker) to view short-term technical chart and over stock name to view long term chart. Click on  to add stock symbol to your watchlist and to add stock symbol to your watchlist and  to view watchlist. Click on any ticker or stock name for detailed market intelligence report for that stock. to view watchlist. Click on any ticker or stock name for detailed market intelligence report for that stock. |
12Stocks.com Performance of Stocks in Midcap Index
| Ticker | Stock Name | Watchlist | Category | Recent Price | Smart Investing & Trading Score | Change % | YTD Change% |
| WOOF | Petco Health |   | Services & Goods | 1.59 | 42 | 5.30% | -49.68% |
| TXG | 10x Genomics | | Technology | 28.77 | 42 | 4.28% | -48.59% |
| CAR | Avis Budget | | Transports | 104.28 | 42 | 3.50% | -41.17% |
| ALNY | Alnylam | | Health Care | 146.94 | 42 | 2.53% | -23.23% |
| CNHI | CNH Industrial | | Industrials | 11.69 | 42 | 2.41% | -4.06% |
| YETI | YETI | | Consumer Staples | 37.01 | 42 | 2.38% | -28.52% |
| GLOB | Globant S.A | | Technology | 184.95 | 42 | 2.28% | -22.28% |
| PLUG | Plug Power | | Industrials | 2.46 | 42 | 1.87% | -45.44% |
| INCY | yte | | Health Care | 52.48 | 42 | 1.55% | -16.42% |
| CPRI | Capri | | Consumer Staples | 36.02 | 42 | 1.36% | -28.29% |
| IONS | Ionis | | Health Care | 42.09 | 42 | 1.21% | -16.79% |
| HPQ | HP | | Technology | 28.33 | 42 | 1.18% | -5.85% |
| XEL | Xcel Energy | | Utilities | 54.56 | 42 | 1.11% | -11.87% |
| NBIX | Neurocrine Biosciences | | Health Care | 137.09 | 42 | 0.81% | 4.04% |
| ELS | Equity LifeStyle | | Financials | 60.96 | 42 | 0.71% | -13.58% |
| GPN | Global Payments | | Services & Goods | 125.42 | 42 | 0.68% | -1.25% |
| NWSA | News | | Services & Goods | 24.39 | 42 | 0.68% | -0.67% |
| Z | Zillow | | Technology | 43.90 | 42 | 0.53% | -24.13% |
| FDS | FactSet Research | | Technology | 423.68 | 42 | 0.52% | -11.19% |
| VRSK | Verisk Analytics | | Services & Goods | 222.17 | 42 | 0.47% | -6.99% |
| PFGC | Performance Food | | Services & Goods | 69.09 | 42 | 0.35% | -0.09% |
| TTWO | Take-Two Interactive | | Technology | 144.96 | 42 | 0.34% | -9.94% |
| ZG | Zillow | | Technology | 43.26 | 42 | 0.30% | -23.73% |
| REXR | Rexford Industrial | | Financials | 43.32 | 42 | 0.28% | -22.78% |
| PB | Prosperity Bancshares | | Financials | 62.94 | 42 | -0.96% | -7.07% |
| For chart view version of above stock list: Chart View ➞ 0 - 25 , 25 - 50 , 50 - 75 , 75 - 100 , 100 - 125 , 125 - 150 , 150 - 175 , 175 - 200 , 200 - 225 , 225 - 250 , 250 - 275 , 275 - 300 , 300 - 325 , 325 - 350 , 350 - 375 , 375 - 400 , 400 - 425 , 425 - 450 , 450 - 475 , 475 - 500 , 500 - 525 , 525 - 550 , 550 - 575 , 575 - 600 , 600 - 625 , 625 - 650 , 650 - 675 , 675 - 700 , 700 - 725 | ||
 | Click To Change The Sort Order: By Market Cap or Company Size Performance: Year-to-date, Week and Day |  |
|
Get the most comprehensive stock market coverage daily at 12Stocks.com ➞ Best Stocks Today ➞ Best Stocks Weekly ➞ Best Stocks Year-to-Date ➞ Best Stocks Trends ➞  Best Stocks Today 12Stocks.com Best Nasdaq Stocks ➞ Best S&P 500 Stocks ➞ Best Tech Stocks ➞ Best Biotech Stocks ➞ |
| Detailed Overview of Midcap Stocks |
| Midcap Technical Overview, Leaders & Laggards, Top Midcap ETF Funds & Detailed Midcap Stocks List, Charts, Trends & More |
| Midcap: Technical Analysis, Trends & YTD Performance | |
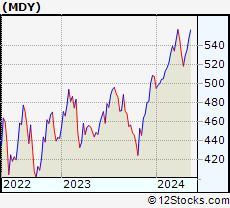
| MidCap segment as represented by
MDY, an exchange-traded fund [ETF], holds basket of about four hundred midcap stocks from across all major sectors of the US stock market. The midcap index (contains stocks like Green Mountain Coffee Roasters and Tractor Supply Company) is up by 4.92% and is currently underperforming the overall market by -1.58% year-to-date. Below is a quick view of technical charts and trends: | |
 MDY Weekly Chart |
|
| Long Term Trend: Very Good | |
| Medium Term Trend: Good | |
 MDY Daily Chart |
|
| Short Term Trend: Very Good | |
| Overall Trend Score: 70 | |
| YTD Performance: 4.92% | |
| **Trend Scores & Views Are Only For Educational Purposes And Not For Investing | |
| 12Stocks.com: Investing in Midcap Index using Exchange Traded Funds | |
|
The following table shows list of key exchange traded funds (ETF) that
help investors track Midcap index. The following list also includes leveraged ETF funds that track twice or thrice the daily returns of Midcap indices. Short or inverse ETF funds move in the opposite direction to the index they track and are useful during market pullbacks or during bear markets. Quick View: Move mouse or cursor over ETF symbol (ticker) to view short-term technical chart and over ETF name to view long term chart. Click on ticker or stock name for detailed view. Click on to add stock symbol to your watchlist and to view watchlist. |
12Stocks.com List of ETFs that track Midcap Index
| Ticker | ETF Name | Watchlist | Recent Price | Smart Investing & Trading Score | Change % | Week % | Year-to-date % |
| IWR | iShares Russell Mid-Cap | | 80.94 | 75 | 0.52 | 0.52 | 4.12% |
| IJH | iShares Core S&P Mid-Cap | | 58.08 | 75 | 0.44 | 0.44 | 4.77% |
| IWP | iShares Russell Mid-Cap Growth | | 109.38 | 78 | 0.37 | 0.37 | 4.71% |
| IWS | iShares Russell Mid-Cap Value | | 120.78 | 75 | 0.66 | 0.66 | 3.86% |
| MDY | SPDR S&P MidCap 400 ETF | | 532.34 | 70 | 0.56 | 0.56 | 4.92% |
| IJK | iShares S&P Mid-Cap 400 Growth | | 87.42 | 70 | 0.48 | 0.48 | 10.35% |
| IJJ | iShares S&P Mid-Cap 400 Value | | 113.04 | 88 | 0.72 | 0.72 | -0.88% |
| UMDD | ProShares UltraPro MidCap400 | | 24.34 | 78 | 1.59 | 1.59 | 9.05% |
| XMLV | PowerShares S&P MidCap Low Volatil ETF | | 54.95 | 83 | 0.54 | 0.54 | 3.32% |
| MYY | ProShares Short MidCap400 | | 20.64 | 25 | -0.72 | -0.72 | -3.8% |
| MZZ | ProShares UltraShort MidCap400 | | 11.67 | 27 | -0.09 | -0.09 | -7.17% |
| MVV | ProShares Ultra MidCap400 | | 62.18 | 83 | 1.22 | 1.22 | 7.41% |
| SMDD | ProShares UltraPro Short MidCap400 | | 11.65 | 10 | -1.52 | -1.52 | -13.47% |
| 12Stocks.com: Charts, Trends, Fundamental Data and Performances of MidCap Stocks | |
|
We now take in-depth look at all MidCap stocks including charts, multi-period performances and overall trends (as measured by Smart Investing & Trading Score). One can sort MidCap stocks (click link to choose) by Daily, Weekly and by Year-to-Date performances. Also, one can sort by size of the company or by market capitalization. |
| Select Your Default Chart Type: | |||||
| |||||
| Click on stock symbol or name for detailed view. Click on to add stock symbol to your watchlist and to view watchlist. Quick View: Move mouse or cursor over "Daily" to quickly view daily technical stock chart and over "Weekly" to view weekly technical stock chart. | |||||

 | WOOF Petco Health and Wellness Company, Inc. |
| Sector: Services & Goods | |
| SubSector: Specialty Retail | |
| MarketCap: 2030 Millions | |
| Recent Price: 1.59 Smart Investing & Trading Score: 42 | |
| Day Percent Change: 5.30% Day Change: 0.08 | |
| Week Change: 5.3% Year-to-date Change: -49.7% | |
| WOOF Links: Profile News Message Board | |
| Charts:- Daily , Weekly | |
| Add WOOF to Watchlist: View: Get Complete WOOF Trend Analysis ➞ | |
 | TXG 10x Genomics, Inc. |
| Sector: Technology | |
| SubSector: Healthcare Information Services | |
| MarketCap: 5490.45 Millions | |
| Recent Price: 28.77 Smart Investing & Trading Score: 42 | |
| Day Percent Change: 4.28% Day Change: 1.18 | |
| Week Change: 4.28% Year-to-date Change: -48.6% | |
| TXG Links: Profile News Message Board | |
| Charts:- Daily , Weekly | |
| Add TXG to Watchlist: View: Get Complete TXG Trend Analysis ➞ | |
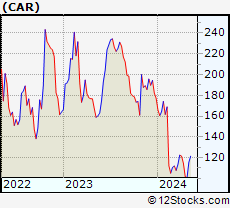 | CAR Avis Budget Group, Inc. |
| Sector: Transports | |
| SubSector: Rental & Leasing Services | |
| MarketCap: 1020.44 Millions | |
| Recent Price: 104.28 Smart Investing & Trading Score: 42 | |
| Day Percent Change: 3.50% Day Change: 3.53 | |
| Week Change: 3.5% Year-to-date Change: -41.2% | |
| CAR Links: Profile News Message Board | |
| Charts:- Daily , Weekly | |
| Add CAR to Watchlist: View: Get Complete CAR Trend Analysis ➞ | |
 | ALNY Alnylam Pharmaceuticals, Inc. |
| Sector: Health Care | |
| SubSector: Biotechnology | |
| MarketCap: 12793.2 Millions | |
| Recent Price: 146.94 Smart Investing & Trading Score: 42 | |
| Day Percent Change: 2.53% Day Change: 3.63 | |
| Week Change: 2.53% Year-to-date Change: -23.2% | |
| ALNY Links: Profile News Message Board | |
| Charts:- Daily , Weekly | |
| Add ALNY to Watchlist: View: Get Complete ALNY Trend Analysis ➞ | |
 | CNHI CNH Industrial N.V. |
| Sector: Industrials | |
| SubSector: Farm & Construction Machinery | |
| MarketCap: 9366.57 Millions | |
| Recent Price: 11.69 Smart Investing & Trading Score: 42 | |
| Day Percent Change: 2.41% Day Change: 0.28 | |
| Week Change: 2.41% Year-to-date Change: -4.1% | |
| CNHI Links: Profile News Message Board | |
| Charts:- Daily , Weekly | |
| Add CNHI to Watchlist: View: Get Complete CNHI Trend Analysis ➞ | |
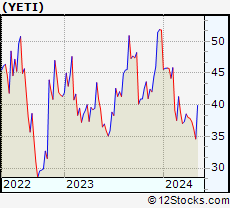 | YETI YETI Holdings, Inc. |
| Sector: Consumer Staples | |
| SubSector: Packaging & Containers | |
| MarketCap: 1495.53 Millions | |
| Recent Price: 37.01 Smart Investing & Trading Score: 42 | |
| Day Percent Change: 2.38% Day Change: 0.86 | |
| Week Change: 2.38% Year-to-date Change: -28.5% | |
| YETI Links: Profile News Message Board | |
| Charts:- Daily , Weekly | |
| Add YETI to Watchlist: View: Get Complete YETI Trend Analysis ➞ | |
 | GLOB Globant S.A. |
| Sector: Technology | |
| SubSector: Information Technology Services | |
| MarketCap: 2976.88 Millions | |
| Recent Price: 184.95 Smart Investing & Trading Score: 42 | |
| Day Percent Change: 2.28% Day Change: 4.12 | |
| Week Change: 2.28% Year-to-date Change: -22.3% | |
| GLOB Links: Profile News Message Board | |
| Charts:- Daily , Weekly | |
| Add GLOB to Watchlist: View: Get Complete GLOB Trend Analysis ➞ | |
 | PLUG Plug Power Inc. |
| Sector: Industrials | |
| SubSector: Industrial Electrical Equipment | |
| MarketCap: 1233.09 Millions | |
| Recent Price: 2.46 Smart Investing & Trading Score: 42 | |
| Day Percent Change: 1.87% Day Change: 0.04 | |
| Week Change: 1.87% Year-to-date Change: -45.4% | |
| PLUG Links: Profile News Message Board | |
| Charts:- Daily , Weekly | |
| Add PLUG to Watchlist: View: Get Complete PLUG Trend Analysis ➞ | |
 | INCY Incyte Corporation |
| Sector: Health Care | |
| SubSector: Biotechnology | |
| MarketCap: 15343.2 Millions | |
| Recent Price: 52.48 Smart Investing & Trading Score: 42 | |
| Day Percent Change: 1.55% Day Change: 0.80 | |
| Week Change: 1.55% Year-to-date Change: -16.4% | |
| INCY Links: Profile News Message Board | |
| Charts:- Daily , Weekly | |
| Add INCY to Watchlist: View: Get Complete INCY Trend Analysis ➞ | |
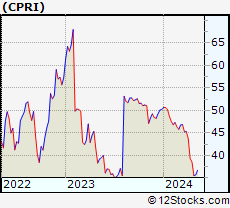 | CPRI Capri Holdings Limited |
| Sector: Consumer Staples | |
| SubSector: Textile - Apparel Clothing | |
| MarketCap: 1935.65 Millions | |
| Recent Price: 36.02 Smart Investing & Trading Score: 42 | |
| Day Percent Change: 1.36% Day Change: 0.48 | |
| Week Change: 1.36% Year-to-date Change: -28.3% | |
| CPRI Links: Profile News Message Board | |
| Charts:- Daily , Weekly | |
| Add CPRI to Watchlist: View: Get Complete CPRI Trend Analysis ➞ | |
 | IONS Ionis Pharmaceuticals, Inc. |
| Sector: Health Care | |
| SubSector: Biotechnology | |
| MarketCap: 6725.05 Millions | |
| Recent Price: 42.09 Smart Investing & Trading Score: 42 | |
| Day Percent Change: 1.21% Day Change: 0.50 | |
| Week Change: 1.21% Year-to-date Change: -16.8% | |
| IONS Links: Profile News Message Board | |
| Charts:- Daily , Weekly | |
| Add IONS to Watchlist: View: Get Complete IONS Trend Analysis ➞ | |
 | HPQ HP Inc. |
| Sector: Technology | |
| SubSector: Diversified Computer Systems | |
| MarketCap: 22107.8 Millions | |
| Recent Price: 28.33 Smart Investing & Trading Score: 42 | |
| Day Percent Change: 1.18% Day Change: 0.33 | |
| Week Change: 1.18% Year-to-date Change: -5.9% | |
| HPQ Links: Profile News Message Board | |
| Charts:- Daily , Weekly | |
| Add HPQ to Watchlist: View: Get Complete HPQ Trend Analysis ➞ | |
 | XEL Xcel Energy Inc. |
| Sector: Utilities | |
| SubSector: Electric Utilities | |
| MarketCap: 28960.8 Millions | |
| Recent Price: 54.56 Smart Investing & Trading Score: 42 | |
| Day Percent Change: 1.11% Day Change: 0.60 | |
| Week Change: 1.11% Year-to-date Change: -11.9% | |
| XEL Links: Profile News Message Board | |
| Charts:- Daily , Weekly | |
| Add XEL to Watchlist: View: Get Complete XEL Trend Analysis ➞ | |
 | NBIX Neurocrine Biosciences, Inc. |
| Sector: Health Care | |
| SubSector: Biotechnology | |
| MarketCap: 7897.85 Millions | |
| Recent Price: 137.09 Smart Investing & Trading Score: 42 | |
| Day Percent Change: 0.81% Day Change: 1.09 | |
| Week Change: 0.81% Year-to-date Change: 4.0% | |
| NBIX Links: Profile News Message Board | |
| Charts:- Daily , Weekly | |
| Add NBIX to Watchlist: View: Get Complete NBIX Trend Analysis ➞ | |
 | ELS Equity LifeStyle Properties, Inc. |
| Sector: Financials | |
| SubSector: REIT - Residential | |
| MarketCap: 9570.61 Millions | |
| Recent Price: 60.96 Smart Investing & Trading Score: 42 | |
| Day Percent Change: 0.71% Day Change: 0.43 | |
| Week Change: 0.71% Year-to-date Change: -13.6% | |
| ELS Links: Profile News Message Board | |
| Charts:- Daily , Weekly | |
| Add ELS to Watchlist: View: Get Complete ELS Trend Analysis ➞ | |
 | GPN Global Payments Inc. |
| Sector: Services & Goods | |
| SubSector: Business Services | |
| MarketCap: 39068.8 Millions | |
| Recent Price: 125.42 Smart Investing & Trading Score: 42 | |
| Day Percent Change: 0.68% Day Change: 0.85 | |
| Week Change: 0.68% Year-to-date Change: -1.3% | |
| GPN Links: Profile News Message Board | |
| Charts:- Daily , Weekly | |
| Add GPN to Watchlist: View: Get Complete GPN Trend Analysis ➞ | |
 | NWSA News Corporation |
| Sector: Services & Goods | |
| SubSector: Broadcasting - TV | |
| MarketCap: 5857.53 Millions | |
| Recent Price: 24.39 Smart Investing & Trading Score: 42 | |
| Day Percent Change: 0.68% Day Change: 0.17 | |
| Week Change: 0.68% Year-to-date Change: -0.7% | |
| NWSA Links: Profile News Message Board | |
| Charts:- Daily , Weekly | |
| Add NWSA to Watchlist: View: Get Complete NWSA Trend Analysis ➞ | |
 | Z Zillow Group, Inc. |
| Sector: Technology | |
| SubSector: Internet Information Providers | |
| MarketCap: 3880.4 Millions | |
| Recent Price: 43.90 Smart Investing & Trading Score: 42 | |
| Day Percent Change: 0.53% Day Change: 0.23 | |
| Week Change: 0.53% Year-to-date Change: -24.1% | |
| Z Links: Profile News Message Board | |
| Charts:- Daily , Weekly | |
| Add Z to Watchlist: View: Get Complete Z Trend Analysis ➞ | |
 | FDS FactSet Research Systems Inc. |
| Sector: Technology | |
| SubSector: Information & Delivery Services | |
| MarketCap: 9024.37 Millions | |
| Recent Price: 423.68 Smart Investing & Trading Score: 42 | |
| Day Percent Change: 0.52% Day Change: 2.21 | |
| Week Change: 0.52% Year-to-date Change: -11.2% | |
| FDS Links: Profile News Message Board | |
| Charts:- Daily , Weekly | |
| Add FDS to Watchlist: View: Get Complete FDS Trend Analysis ➞ | |
 | VRSK Verisk Analytics, Inc. |
| Sector: Services & Goods | |
| SubSector: Business Services | |
| MarketCap: 22033.2 Millions | |
| Recent Price: 222.17 Smart Investing & Trading Score: 42 | |
| Day Percent Change: 0.47% Day Change: 1.03 | |
| Week Change: 0.47% Year-to-date Change: -7.0% | |
| VRSK Links: Profile News Message Board | |
| Charts:- Daily , Weekly | |
| Add VRSK to Watchlist: View: Get Complete VRSK Trend Analysis ➞ | |
 | PFGC Performance Food Group Company |
| Sector: Services & Goods | |
| SubSector: Restaurants | |
| MarketCap: 2457.5 Millions | |
| Recent Price: 69.09 Smart Investing & Trading Score: 42 | |
| Day Percent Change: 0.35% Day Change: 0.24 | |
| Week Change: 0.35% Year-to-date Change: -0.1% | |
| PFGC Links: Profile News Message Board | |
| Charts:- Daily , Weekly | |
| Add PFGC to Watchlist: View: Get Complete PFGC Trend Analysis ➞ | |
 | TTWO Take-Two Interactive Software, Inc. |
| Sector: Technology | |
| SubSector: Multimedia & Graphics Software | |
| MarketCap: 12479.6 Millions | |
| Recent Price: 144.96 Smart Investing & Trading Score: 42 | |
| Day Percent Change: 0.34% Day Change: 0.49 | |
| Week Change: 0.34% Year-to-date Change: -9.9% | |
| TTWO Links: Profile News Message Board | |
| Charts:- Daily , Weekly | |
| Add TTWO to Watchlist: View: Get Complete TTWO Trend Analysis ➞ | |
 | ZG Zillow Group, Inc. |
| Sector: Technology | |
| SubSector: Internet Information Providers | |
| MarketCap: 6536.7 Millions | |
| Recent Price: 43.26 Smart Investing & Trading Score: 42 | |
| Day Percent Change: 0.30% Day Change: 0.13 | |
| Week Change: 0.3% Year-to-date Change: -23.7% | |
| ZG Links: Profile News Message Board | |
| Charts:- Daily , Weekly | |
| Add ZG to Watchlist: View: Get Complete ZG Trend Analysis ➞ | |
 | REXR Rexford Industrial Realty, Inc. |
| Sector: Financials | |
| SubSector: REIT - Industrial | |
| MarketCap: 4185.99 Millions | |
| Recent Price: 43.32 Smart Investing & Trading Score: 42 | |
| Day Percent Change: 0.28% Day Change: 0.12 | |
| Week Change: 0.28% Year-to-date Change: -22.8% | |
| REXR Links: Profile News Message Board | |
| Charts:- Daily , Weekly | |
| Add REXR to Watchlist: View: Get Complete REXR Trend Analysis ➞ | |
 | PB Prosperity Bancshares, Inc. |
| Sector: Financials | |
| SubSector: Regional - Southwest Banks | |
| MarketCap: 4682.25 Millions | |
| Recent Price: 62.94 Smart Investing & Trading Score: 42 | |
| Day Percent Change: -0.96% Day Change: -0.61 | |
| Week Change: -0.96% Year-to-date Change: -7.1% | |
| PB Links: Profile News Message Board | |
| Charts:- Daily , Weekly | |
| Add PB to Watchlist: View: Get Complete PB Trend Analysis ➞ | |
| For tabular summary view of above stock list: Summary View ➞ 0 - 25 , 25 - 50 , 50 - 75 , 75 - 100 , 100 - 125 , 125 - 150 , 150 - 175 , 175 - 200 , 200 - 225 , 225 - 250 , 250 - 275 , 275 - 300 , 300 - 325 , 325 - 350 , 350 - 375 , 375 - 400 , 400 - 425 , 425 - 450 , 450 - 475 , 475 - 500 , 500 - 525 , 525 - 550 , 550 - 575 , 575 - 600 , 600 - 625 , 625 - 650 , 650 - 675 , 675 - 700 , 700 - 725 | ||
| Click To Change The Sort Order: By Market Cap or Company Size Performance: Year-to-date, Week and Day | |
| Select Chart Type: | ||
|
Best Stocks Today 12Stocks.com |
© 2024 12Stocks.com Terms & Conditions Privacy Contact Us
All Information Provided Only For Education And Not To Be Used For Investing or Trading. See Terms & Conditions


One More Thing ... Get Best Stocks Delivered Daily!
Never Ever Miss A Move With Our Top Ten Stocks Lists
Find Best Stocks In Any Market - Bull or Bear Market
Take A Peek At Our Top Ten Stocks Lists: Daily, Weekly, Year-to-Date & Top Trends
Find Best Stocks In Any Market - Bull or Bear Market
Take A Peek At Our Top Ten Stocks Lists: Daily, Weekly, Year-to-Date & Top Trends
Midcap Stocks With Best Up Trends [0-bearish to 100-bullish]: Tandem Diabetes[100], Albemarle [100], Quest Diagnostics[100], Domino s[100], Lazard [100], Aptar [100], LPL Financial[100], Cognex [100], United [100], Owens Corning[100], Highwoods Properties[100]
Best Midcap Stocks Year-to-Date:
Vistra Energy[98.34%], ShockWave Medical[72.86%], EMCOR [66.11%], Spotify [51.73%], Wingstop [50.21%], Natera [49.38%], Antero Resources[48.85%], Pure Storage[47.67%], NRG Energy[43.17%], Interactive Brokers[41.47%], Williams-Sonoma [40.87%] Best Midcap Stocks This Week:
Tandem Diabetes[7.07%], Sunrun [6.46%], Hertz Global[6.45%], Albemarle [6.36%], Liberty SiriusXM[5.31%], Petco Health[5.3%], Liberty SiriusXM[5.21%], Quest Diagnostics[5.18%], Vistra Energy[5.09%], Sirius XM[4.97%], Biogen [4.61%] Best Midcap Stocks Daily:
Tandem Diabetes[7.07%], Sunrun [6.46%], Hertz Global[6.45%], Albemarle [6.36%], Liberty SiriusXM[5.31%], Petco Health[5.30%], Liberty SiriusXM[5.21%], Quest Diagnostics[5.18%], Vistra Energy[5.09%], Sirius XM[4.97%], Biogen [4.61%]