
 Login Sign Up


| |||||
 |  | ||||

| 12Stocks.com Market Intelligence |
Best MidCap Stocks
|
| In a hurry? Mid Cap Stocks Lists: Performance Trends Table, Stock Charts
Sort midcap stocks: Daily, Weekly, Year-to-Date, Market Cap & Trends. Filter midcap stocks list by sector: Show all, Tech, Finance, Energy, Staples, Retail, Industrial, Materials, Utilities and HealthCare Filter midcap stocks list by size:All MidCap Large Mid-Range Small |
| 12Stocks.com Mid Cap Stocks Performances & Trends Daily | |||||||||
|
|  The overall Smart Investing & Trading Score is 70 (0-bearish to 100-bullish) which puts Mid Cap index in short term neutral to bullish trend. The Smart Investing & Trading Score from previous trading session is 56 and hence an improvement of trend.
| ||||||||
Here are the Smart Investing & Trading Scores of the most requested mid cap stocks at 12Stocks.com (click stock name for detailed review):
|


| 12Stocks.com: Top Performing Mid Cap Index Stocks | ||||||||||||||||||||||||||||||||||||||||||||||||
 The top performing Mid Cap Index stocks year to date are
Now, more recently, over last week, the top performing Mid Cap Index stocks on the move are


|
||||||||||||||||||||||||||||||||||||||||||||||||
| 12Stocks.com: Investing in Midcap Index with Stocks | |
|
The following table helps investors and traders sort through current performance and trends (as measured by Smart Investing & Trading Score) of various
stocks in the Midcap Index. Quick View: Move mouse or cursor over stock symbol (ticker) to view short-term technical chart and over stock name to view long term chart. Click on  to add stock symbol to your watchlist and to add stock symbol to your watchlist and  to view watchlist. Click on any ticker or stock name for detailed market intelligence report for that stock. to view watchlist. Click on any ticker or stock name for detailed market intelligence report for that stock. |
12Stocks.com Performance of Stocks in Midcap Index
| Ticker | Stock Name | Watchlist | Category | Recent Price | Smart Investing & Trading Score | Change % | YTD Change% |
| SJM | J. M. |   | Consumer Staples | 114.65 | 25 | 0.92% | -9.28% |
| AMC | AMC Entertainment | | Services & Goods | 3.03 | 25 | -11.14% | -50.49% |
| CMA | Comerica | | Financials | 51.42 | 25 | -1.25% | -7.87% |
| NUE | Nucor | | Materials | 175.24 | 25 | -0.10% | 0.69% |
| JNPR | Juniper Networks | | Technology | 35.15 | 25 | 1.27% | 19.23% |
| FR | First Industrial | | Financials | 46.49 | 25 | 1.07% | -11.73% |
| SNA | Snap-on | | Industrials | 272.25 | 25 | 0.57% | -5.74% |
| STAG | STAG Industrial | | Financials | 34.65 | 25 | 0.49% | -11.74% |
| BIO | Bio-Rad | | Health Care | 277.11 | 25 | 0.42% | -14.18% |
| FFIV | F5 Networks | | Technology | 181.94 | 25 | 0.00% | 1.65% |
| IVZ | Invesco | | Financials | 14.46 | 25 | -1.43% | -18.95% |
| PNFP | Pinnacle Financial | | Financials | 79.37 | 25 | -1.15% | -9.00% |
| ALLE | Allegion | | Services & Goods | 124.81 | 23 | 0.78% | -1.48% |
| MIDD | Middleby | | Industrials | 142.26 | 23 | 0.72% | -3.34% |
| CFR | Cullen/Frost Bankers | | Financials | 105.29 | 23 | -1.67% | -2.95% |
| MTCH | Match | | Technology | 31.51 | 23 | -1.19% | -13.67% |
| DOCU | DocuSign | | Technology | 57.14 | 23 | -0.10% | -3.89% |
| AJG | Arthur J. | | Financials | 233.55 | 21 | -0.24% | 3.86% |
| CZR | Caesars Entertainment | | Services & Goods | 37.56 | 20 | 2.59% | -19.88% |
| DV | DoubleVerify | | Technology | 30.60 | 20 | 1.22% | -16.80% |
| CUBE | CubeSmart | | Financials | 41.24 | 20 | 1.18% | -11.02% |
| APLS | Apellis | | Health Care | 48.03 | 20 | -3.67% | -19.76% |
| NCNO | nCino | | Technology | 29.42 | 20 | -0.30% | -12.52% |
| RGEN | Repligen | | Health Care | 166.15 | 20 | -0.26% | -7.59% |
| EFX | Equifax | | Financials | 225.52 | 18 | 0.94% | -8.80% |
| For chart view version of above stock list: Chart View ➞ 0 - 25 , 25 - 50 , 50 - 75 , 75 - 100 , 100 - 125 , 125 - 150 , 150 - 175 , 175 - 200 , 200 - 225 , 225 - 250 , 250 - 275 , 275 - 300 , 300 - 325 , 325 - 350 , 350 - 375 , 375 - 400 , 400 - 425 , 425 - 450 , 450 - 475 , 475 - 500 , 500 - 525 , 525 - 550 , 550 - 575 , 575 - 600 , 600 - 625 , 625 - 650 , 650 - 675 , 675 - 700 , 700 - 725 , 725 - 750 , 750 - 775 | ||
 | Click To Change The Sort Order: By Market Cap or Company Size Performance: Year-to-date, Week and Day |  |
|
Get the most comprehensive stock market coverage daily at 12Stocks.com ➞ Best Stocks Today ➞ Best Stocks Weekly ➞ Best Stocks Year-to-Date ➞ Best Stocks Trends ➞  Best Stocks Today 12Stocks.com Best Nasdaq Stocks ➞ Best S&P 500 Stocks ➞ Best Tech Stocks ➞ Best Biotech Stocks ➞ |
| Detailed Overview of Midcap Stocks |
| Midcap Technical Overview, Leaders & Laggards, Top Midcap ETF Funds & Detailed Midcap Stocks List, Charts, Trends & More |
| Midcap: Technical Analysis, Trends & YTD Performance | |
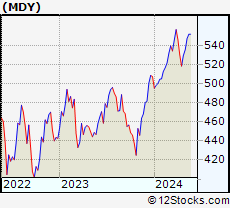
| MidCap segment as represented by
MDY, an exchange-traded fund [ETF], holds basket of about four hundred midcap stocks from across all major sectors of the US stock market. The midcap index (contains stocks like Green Mountain Coffee Roasters and Tractor Supply Company) is up by 4.91% and is currently underperforming the overall market by -1.65% year-to-date. Below is a quick view of technical charts and trends: | |
 MDY Weekly Chart |
|
| Long Term Trend: Very Good | |
| Medium Term Trend: Good | |
 MDY Daily Chart |
|
| Short Term Trend: Very Good | |
| Overall Trend Score: 70 | |
| YTD Performance: 4.91% | |
| **Trend Scores & Views Are Only For Educational Purposes And Not For Investing | |
| 12Stocks.com: Investing in Midcap Index using Exchange Traded Funds | |
|
The following table shows list of key exchange traded funds (ETF) that
help investors track Midcap index. The following list also includes leveraged ETF funds that track twice or thrice the daily returns of Midcap indices. Short or inverse ETF funds move in the opposite direction to the index they track and are useful during market pullbacks or during bear markets. Quick View: Move mouse or cursor over ETF symbol (ticker) to view short-term technical chart and over ETF name to view long term chart. Click on ticker or stock name for detailed view. Click on to add stock symbol to your watchlist and to view watchlist. |
12Stocks.com List of ETFs that track Midcap Index
| Ticker | ETF Name | Watchlist | Recent Price | Smart Investing & Trading Score | Change % | Week % | Year-to-date % |
| IJH | iShares Core S&P Mid-Cap | | 58.17 | 75 | 0.61 | 0.61 | 4.94% |
| IWR | iShares Russell Mid-Cap | | 80.98 | 75 | 0.57 | 0.57 | 4.18% |
| IWP | iShares Russell Mid-Cap Growth | | 109.47 | 78 | 0.45 | 0.45 | 4.8% |
| MDY | SPDR S&P MidCap 400 ETF | | 532.28 | 70 | 0.55 | 0.55 | 4.91% |
| IWS | iShares Russell Mid-Cap Value | | 120.76 | 75 | 0.64 | 0.64 | 3.84% |
| IJK | iShares S&P Mid-Cap 400 Growth | | 87.51 | 70 | 0.59 | 0.59 | 10.46% |
| IJJ | iShares S&P Mid-Cap 400 Value | | 112.85 | 88 | 0.55 | 0.55 | -1.04% |
| XMLV | PowerShares S&P MidCap Low Volatil ETF | | 54.94 | 83 | 0.53 | 0.53 | 3.31% |
| UMDD | ProShares UltraPro MidCap400 | | 24.32 | 78 | 1.50 | 1.5 | 8.96% |
| SMDD | ProShares UltraPro Short MidCap400 | | 11.65 | 10 | -1.52 | -1.52 | -13.47% |
| MYY | ProShares Short MidCap400 | | 20.71 | 25 | -0.38 | -0.38 | -3.47% |
| MZZ | ProShares UltraShort MidCap400 | | 11.58 | 20 | -0.86 | -0.86 | -7.88% |
| MVV | ProShares Ultra MidCap400 | | 61.81 | 83 | 0.61 | 0.61 | 6.76% |
| 12Stocks.com: Charts, Trends, Fundamental Data and Performances of MidCap Stocks | |
|
We now take in-depth look at all MidCap stocks including charts, multi-period performances and overall trends (as measured by Smart Investing & Trading Score). One can sort MidCap stocks (click link to choose) by Daily, Weekly and by Year-to-Date performances. Also, one can sort by size of the company or by market capitalization. |
| Select Your Default Chart Type: | |||||
| |||||
| Click on stock symbol or name for detailed view. Click on to add stock symbol to your watchlist and to view watchlist. Quick View: Move mouse or cursor over "Daily" to quickly view daily technical stock chart and over "Weekly" to view weekly technical stock chart. | |||||

 | SJM The J. M. Smucker Company |
| Sector: Consumer Staples | |
| SubSector: Processed & Packaged Goods | |
| MarketCap: 12635.8 Millions | |
| Recent Price: 114.65 Smart Investing & Trading Score: 25 | |
| Day Percent Change: 0.92% Day Change: 1.05 | |
| Week Change: 0.92% Year-to-date Change: -9.3% | |
| SJM Links: Profile News Message Board | |
| Charts:- Daily , Weekly | |
| Add SJM to Watchlist: View: Get Complete SJM Trend Analysis ➞ | |
 | AMC AMC Entertainment Holdings, Inc. |
| Sector: Services & Goods | |
| SubSector: Movie Production, Theaters | |
| MarketCap: 415.929 Millions | |
| Recent Price: 3.03 Smart Investing & Trading Score: 25 | |
| Day Percent Change: -11.14% Day Change: -0.38 | |
| Week Change: -11.14% Year-to-date Change: -50.5% | |
| AMC Links: Profile News Message Board | |
| Charts:- Daily , Weekly | |
| Add AMC to Watchlist: View: Get Complete AMC Trend Analysis ➞ | |
 | CMA Comerica Incorporated |
| Sector: Financials | |
| SubSector: Money Center Banks | |
| MarketCap: 4449.49 Millions | |
| Recent Price: 51.42 Smart Investing & Trading Score: 25 | |
| Day Percent Change: -1.25% Day Change: -0.65 | |
| Week Change: -1.25% Year-to-date Change: -7.9% | |
| CMA Links: Profile News Message Board | |
| Charts:- Daily , Weekly | |
| Add CMA to Watchlist: View: Get Complete CMA Trend Analysis ➞ | |
 | NUE Nucor Corporation |
| Sector: Materials | |
| SubSector: Steel & Iron | |
| MarketCap: 10281.8 Millions | |
| Recent Price: 175.24 Smart Investing & Trading Score: 25 | |
| Day Percent Change: -0.10% Day Change: -0.18 | |
| Week Change: -0.1% Year-to-date Change: 0.7% | |
| NUE Links: Profile News Message Board | |
| Charts:- Daily , Weekly | |
| Add NUE to Watchlist: View: Get Complete NUE Trend Analysis ➞ | |
 | JNPR Juniper Networks, Inc. |
| Sector: Technology | |
| SubSector: Communication Equipment | |
| MarketCap: 6161.49 Millions | |
| Recent Price: 35.15 Smart Investing & Trading Score: 25 | |
| Day Percent Change: 1.27% Day Change: 0.44 | |
| Week Change: 1.27% Year-to-date Change: 19.2% | |
| JNPR Links: Profile News Message Board | |
| Charts:- Daily , Weekly | |
| Add JNPR to Watchlist: View: Get Complete JNPR Trend Analysis ➞ | |
 | FR First Industrial Realty Trust, Inc. |
| Sector: Financials | |
| SubSector: REIT - Industrial | |
| MarketCap: 3883.39 Millions | |
| Recent Price: 46.49 Smart Investing & Trading Score: 25 | |
| Day Percent Change: 1.07% Day Change: 0.49 | |
| Week Change: 1.07% Year-to-date Change: -11.7% | |
| FR Links: Profile News Message Board | |
| Charts:- Daily , Weekly | |
| Add FR to Watchlist: View: Get Complete FR Trend Analysis ➞ | |
 | SNA Snap-on Incorporated |
| Sector: Industrials | |
| SubSector: Small Tools & Accessories | |
| MarketCap: 5947.26 Millions | |
| Recent Price: 272.25 Smart Investing & Trading Score: 25 | |
| Day Percent Change: 0.57% Day Change: 1.55 | |
| Week Change: 0.57% Year-to-date Change: -5.7% | |
| SNA Links: Profile News Message Board | |
| Charts:- Daily , Weekly | |
| Add SNA to Watchlist: View: Get Complete SNA Trend Analysis ➞ | |
 | STAG STAG Industrial, Inc. |
| Sector: Financials | |
| SubSector: REIT - Industrial | |
| MarketCap: 3767.49 Millions | |
| Recent Price: 34.65 Smart Investing & Trading Score: 25 | |
| Day Percent Change: 0.49% Day Change: 0.17 | |
| Week Change: 0.49% Year-to-date Change: -11.7% | |
| STAG Links: Profile News Message Board | |
| Charts:- Daily , Weekly | |
| Add STAG to Watchlist: View: Get Complete STAG Trend Analysis ➞ | |
 | BIO Bio-Rad Laboratories, Inc. |
| Sector: Health Care | |
| SubSector: Medical Laboratories & Research | |
| MarketCap: 10660 Millions | |
| Recent Price: 277.11 Smart Investing & Trading Score: 25 | |
| Day Percent Change: 0.42% Day Change: 1.17 | |
| Week Change: 0.42% Year-to-date Change: -14.2% | |
| BIO Links: Profile News Message Board | |
| Charts:- Daily , Weekly | |
| Add BIO to Watchlist: View: Get Complete BIO Trend Analysis ➞ | |
 | FFIV F5 Networks, Inc. |
| Sector: Technology | |
| SubSector: Business Software & Services | |
| MarketCap: 6675.38 Millions | |
| Recent Price: 181.94 Smart Investing & Trading Score: 25 | |
| Day Percent Change: 0.00% Day Change: 0.00 | |
| Week Change: 0% Year-to-date Change: 1.7% | |
| FFIV Links: Profile News Message Board | |
| Charts:- Daily , Weekly | |
| Add FFIV to Watchlist: View: Get Complete FFIV Trend Analysis ➞ | |
 | IVZ Invesco Ltd. |
| Sector: Financials | |
| SubSector: Asset Management | |
| MarketCap: 4578.23 Millions | |
| Recent Price: 14.46 Smart Investing & Trading Score: 25 | |
| Day Percent Change: -1.43% Day Change: -0.21 | |
| Week Change: -1.43% Year-to-date Change: -19.0% | |
| IVZ Links: Profile News Message Board | |
| Charts:- Daily , Weekly | |
| Add IVZ to Watchlist: View: Get Complete IVZ Trend Analysis ➞ | |
 | PNFP Pinnacle Financial Partners, Inc. |
| Sector: Financials | |
| SubSector: Regional - Southeast Banks | |
| MarketCap: 2771.75 Millions | |
| Recent Price: 79.37 Smart Investing & Trading Score: 25 | |
| Day Percent Change: -1.15% Day Change: -0.92 | |
| Week Change: -1.15% Year-to-date Change: -9.0% | |
| PNFP Links: Profile News Message Board | |
| Charts:- Daily , Weekly | |
| Add PNFP to Watchlist: View: Get Complete PNFP Trend Analysis ➞ | |
 | ALLE Allegion plc |
| Sector: Services & Goods | |
| SubSector: Security & Protection Services | |
| MarketCap: 8515.93 Millions | |
| Recent Price: 124.81 Smart Investing & Trading Score: 23 | |
| Day Percent Change: 0.78% Day Change: 0.96 | |
| Week Change: 0.78% Year-to-date Change: -1.5% | |
| ALLE Links: Profile News Message Board | |
| Charts:- Daily , Weekly | |
| Add ALLE to Watchlist: View: Get Complete ALLE Trend Analysis ➞ | |
 | MIDD The Middleby Corporation |
| Sector: Industrials | |
| SubSector: Diversified Machinery | |
| MarketCap: 3070.36 Millions | |
| Recent Price: 142.26 Smart Investing & Trading Score: 23 | |
| Day Percent Change: 0.72% Day Change: 1.01 | |
| Week Change: 0.72% Year-to-date Change: -3.3% | |
| MIDD Links: Profile News Message Board | |
| Charts:- Daily , Weekly | |
| Add MIDD to Watchlist: View: Get Complete MIDD Trend Analysis ➞ | |
 | CFR Cullen/Frost Bankers, Inc. |
| Sector: Financials | |
| SubSector: Regional - Southwest Banks | |
| MarketCap: 3536.75 Millions | |
| Recent Price: 105.29 Smart Investing & Trading Score: 23 | |
| Day Percent Change: -1.67% Day Change: -1.79 | |
| Week Change: -1.67% Year-to-date Change: -3.0% | |
| CFR Links: Profile News Message Board | |
| Charts:- Daily , Weekly | |
| Add CFR to Watchlist: View: Get Complete CFR Trend Analysis ➞ | |
 | MTCH Match Group, Inc. |
| Sector: Technology | |
| SubSector: Internet Information Providers | |
| MarketCap: 14655.8 Millions | |
| Recent Price: 31.51 Smart Investing & Trading Score: 23 | |
| Day Percent Change: -1.19% Day Change: -0.38 | |
| Week Change: -1.19% Year-to-date Change: -13.7% | |
| MTCH Links: Profile News Message Board | |
| Charts:- Daily , Weekly | |
| Add MTCH to Watchlist: View: Get Complete MTCH Trend Analysis ➞ | |
 | DOCU DocuSign, Inc. |
| Sector: Technology | |
| SubSector: Business Software & Services | |
| MarketCap: 15618.8 Millions | |
| Recent Price: 57.14 Smart Investing & Trading Score: 23 | |
| Day Percent Change: -0.10% Day Change: -0.06 | |
| Week Change: -0.1% Year-to-date Change: -3.9% | |
| DOCU Links: Profile News Message Board | |
| Charts:- Daily , Weekly | |
| Add DOCU to Watchlist: View: Get Complete DOCU Trend Analysis ➞ | |
 | AJG Arthur J. Gallagher & Co. |
| Sector: Financials | |
| SubSector: Insurance Brokers | |
| MarketCap: 14852.2 Millions | |
| Recent Price: 233.55 Smart Investing & Trading Score: 21 | |
| Day Percent Change: -0.24% Day Change: -0.56 | |
| Week Change: -0.24% Year-to-date Change: 3.9% | |
| AJG Links: Profile News Message Board | |
| Charts:- Daily , Weekly | |
| Add AJG to Watchlist: View: Get Complete AJG Trend Analysis ➞ | |
 | CZR Caesars Entertainment Corporation |
| Sector: Services & Goods | |
| SubSector: Resorts & Casinos | |
| MarketCap: 4618.44 Millions | |
| Recent Price: 37.56 Smart Investing & Trading Score: 20 | |
| Day Percent Change: 2.59% Day Change: 0.95 | |
| Week Change: 2.59% Year-to-date Change: -19.9% | |
| CZR Links: Profile News Message Board | |
| Charts:- Daily , Weekly | |
| Add CZR to Watchlist: View: Get Complete CZR Trend Analysis ➞ | |
 | DV DoubleVerify Holdings, Inc. |
| Sector: Technology | |
| SubSector: Software - Application | |
| MarketCap: 6500 Millions | |
| Recent Price: 30.60 Smart Investing & Trading Score: 20 | |
| Day Percent Change: 1.22% Day Change: 0.37 | |
| Week Change: 1.22% Year-to-date Change: -16.8% | |
| DV Links: Profile News Message Board | |
| Charts:- Daily , Weekly | |
| Add DV to Watchlist: View: Get Complete DV Trend Analysis ➞ | |
 | CUBE CubeSmart |
| Sector: Financials | |
| SubSector: REIT - Industrial | |
| MarketCap: 4562.99 Millions | |
| Recent Price: 41.24 Smart Investing & Trading Score: 20 | |
| Day Percent Change: 1.18% Day Change: 0.48 | |
| Week Change: 1.18% Year-to-date Change: -11.0% | |
| CUBE Links: Profile News Message Board | |
| Charts:- Daily , Weekly | |
| Add CUBE to Watchlist: View: Get Complete CUBE Trend Analysis ➞ | |
 | APLS Apellis Pharmaceuticals, Inc. |
| Sector: Health Care | |
| SubSector: Biotechnology | |
| MarketCap: 2030.95 Millions | |
| Recent Price: 48.03 Smart Investing & Trading Score: 20 | |
| Day Percent Change: -3.67% Day Change: -1.83 | |
| Week Change: -3.67% Year-to-date Change: -19.8% | |
| APLS Links: Profile News Message Board | |
| Charts:- Daily , Weekly | |
| Add APLS to Watchlist: View: Get Complete APLS Trend Analysis ➞ | |
 | NCNO nCino, Inc. |
| Sector: Technology | |
| SubSector: Software Application | |
| MarketCap: 74187 Millions | |
| Recent Price: 29.42 Smart Investing & Trading Score: 20 | |
| Day Percent Change: -0.30% Day Change: -0.09 | |
| Week Change: -0.3% Year-to-date Change: -12.5% | |
| NCNO Links: Profile News Message Board | |
| Charts:- Daily , Weekly | |
| Add NCNO to Watchlist: View: Get Complete NCNO Trend Analysis ➞ | |
 | RGEN Repligen Corporation |
| Sector: Health Care | |
| SubSector: Biotechnology | |
| MarketCap: 4711.75 Millions | |
| Recent Price: 166.15 Smart Investing & Trading Score: 20 | |
| Day Percent Change: -0.26% Day Change: -0.43 | |
| Week Change: -0.26% Year-to-date Change: -7.6% | |
| RGEN Links: Profile News Message Board | |
| Charts:- Daily , Weekly | |
| Add RGEN to Watchlist: View: Get Complete RGEN Trend Analysis ➞ | |
 | EFX Equifax Inc. |
| Sector: Financials | |
| SubSector: Credit Services | |
| MarketCap: 13754.6 Millions | |
| Recent Price: 225.52 Smart Investing & Trading Score: 18 | |
| Day Percent Change: 0.94% Day Change: 2.10 | |
| Week Change: 0.94% Year-to-date Change: -8.8% | |
| EFX Links: Profile News Message Board | |
| Charts:- Daily , Weekly | |
| Add EFX to Watchlist: View: Get Complete EFX Trend Analysis ➞ | |
| For tabular summary view of above stock list: Summary View ➞ 0 - 25 , 25 - 50 , 50 - 75 , 75 - 100 , 100 - 125 , 125 - 150 , 150 - 175 , 175 - 200 , 200 - 225 , 225 - 250 , 250 - 275 , 275 - 300 , 300 - 325 , 325 - 350 , 350 - 375 , 375 - 400 , 400 - 425 , 425 - 450 , 450 - 475 , 475 - 500 , 500 - 525 , 525 - 550 , 550 - 575 , 575 - 600 , 600 - 625 , 625 - 650 , 650 - 675 , 675 - 700 , 700 - 725 , 725 - 750 , 750 - 775 | ||
| Click To Change The Sort Order: By Market Cap or Company Size Performance: Year-to-date, Week and Day | |
| Select Chart Type: | ||
|
Best Stocks Today 12Stocks.com |
© 2024 12Stocks.com Terms & Conditions Privacy Contact Us
All Information Provided Only For Education And Not To Be Used For Investing or Trading. See Terms & Conditions


One More Thing ... Get Best Stocks Delivered Daily!
Never Ever Miss A Move With Our Top Ten Stocks Lists
Find Best Stocks In Any Market - Bull or Bear Market
Take A Peek At Our Top Ten Stocks Lists: Daily, Weekly, Year-to-Date & Top Trends
Find Best Stocks In Any Market - Bull or Bear Market
Take A Peek At Our Top Ten Stocks Lists: Daily, Weekly, Year-to-Date & Top Trends
Midcap Stocks With Best Up Trends [0-bearish to 100-bullish]: Albemarle [100], Domino s[100], Tandem Diabetes[100], Quest Diagnostics[100], AES [100], Teradyne [100], Carrier Global[100], Skyworks Solutions[100], LPL Financial[100], Perrigo [100], Highwoods Properties[100]
Best Midcap Stocks Year-to-Date:
Vistra Energy[100.05%], AppLovin [83.38%], ShockWave Medical[73.32%], EMCOR [68.8%], CAVA [62.35%], Constellation Energy[60.98%], Spotify [53.34%], Antero Resources[51.23%], Natera [50.19%], Wingstop [50.09%], Pure Storage[47.03%] Best Midcap Stocks This Week:
Ginkgo Bioworks[15.08%], Hertz Global[7.81%], Albemarle [7.57%], Vistra Energy[6%], Medical Properties[5.99%], Domino s[5.62%], Liberty SiriusXM[5.49%], Liberty SiriusXM[5.32%], Sirius XM[5.3%], Tandem Diabetes[5.19%], Paper[4.4%] Best Midcap Stocks Daily:
Ginkgo Bioworks[15.08%], Hertz Global[7.81%], Albemarle [7.57%], Vistra Energy[6.00%], Medical Properties[5.99%], Domino s[5.62%], Liberty SiriusXM[5.49%], Liberty SiriusXM[5.32%], Sirius XM[5.30%], Tandem Diabetes[5.19%], Paper[4.40%]