
 Login Sign Up


| |||||
 |  | ||||

| 12Stocks.com Market Intelligence |
Best MidCap Stocks
|
| In a hurry? Mid Cap Stocks Lists: Performance Trends Table, Stock Charts
Sort midcap stocks: Daily, Weekly, Year-to-Date, Market Cap & Trends. Filter midcap stocks list by sector: Show all, Tech, Finance, Energy, Staples, Retail, Industrial, Materials, Utilities and HealthCare Filter midcap stocks list by size:All MidCap Large Mid-Range Small |
| 12Stocks.com Mid Cap Stocks Performances & Trends Daily | |||||||||
|
|  The overall Smart Investing & Trading Score is 26 (0-bearish to 100-bullish) which puts Mid Cap index in short term bearish to neutral trend. The Smart Investing & Trading Score from previous trading session is 31 and hence a deterioration of trend.
| ||||||||
Here are the Smart Investing & Trading Scores of the most requested mid cap stocks at 12Stocks.com (click stock name for detailed review):
|


| 12Stocks.com: Top Performing Mid Cap Index Stocks | ||||||||||||||||||||||||||||||||||||||||||||||||
 The top performing Mid Cap Index stocks year to date are
Now, more recently, over last week, the top performing Mid Cap Index stocks on the move are


|
||||||||||||||||||||||||||||||||||||||||||||||||
| 12Stocks.com: Investing in Midcap Index with Stocks | |
|
The following table helps investors and traders sort through current performance and trends (as measured by Smart Investing & Trading Score) of various
stocks in the Midcap Index. Quick View: Move mouse or cursor over stock symbol (ticker) to view short-term technical chart and over stock name to view long term chart. Click on  to add stock symbol to your watchlist and to add stock symbol to your watchlist and  to view watchlist. Click on any ticker or stock name for detailed market intelligence report for that stock. to view watchlist. Click on any ticker or stock name for detailed market intelligence report for that stock. |
12Stocks.com Performance of Stocks in Midcap Index
| Ticker | Stock Name | Watchlist | Category | Recent Price | Smart Investing & Trading Score | Change % | YTD Change% |
| NVR | NVR |   | Industrials | 7674.50 | 31 | -1.12% | 9.63% |
| PNR | Pentair | | Industrials | 79.42 | 31 | -1.12% | 9.23% |
| WRK | WestRock | | Consumer Staples | 47.01 | 31 | -1.03% | 13.22% |
| JHG | Janus Henderson | | Financials | 30.88 | 31 | -1.03% | 2.42% |
| CHK | Chesapeake Energy | | Energy | 86.67 | 31 | -1.01% | 12.65% |
| MHK | Mohawk Industries | | Consumer Staples | 110.63 | 31 | -0.98% | 6.88% |
| CLH | Clean Harbors | | Industrials | 192.89 | 31 | -0.90% | 10.53% |
| OSK | Oshkosh | | Consumer Staples | 119.32 | 31 | -0.84% | 10.06% |
| CG | Carlyle | | Financials | 44.89 | 31 | -0.84% | 10.32% |
| MIDD | Middleby | | Industrials | 142.15 | 31 | -0.82% | -3.41% |
| TRIP | TripAdvisor | | Technology | 25.27 | 31 | -0.80% | 17.39% |
| FRPT | Freshpet | | Consumer Staples | 105.01 | 31 | -0.64% | 21.04% |
| WU | Western Union | | Financials | 12.77 | 31 | -0.55% | 7.13% |
| PH | Parker-Hannifin | | Industrials | 540.78 | 31 | -0.48% | 17.38% |
| PWR | Quanta Services | | Industrials | 247.72 | 31 | -0.47% | 14.79% |
| SLM | SLM | | Financials | 20.64 | 31 | -0.41% | 7.92% |
| SQ | Square | | Technology | 73.22 | 31 | -0.38% | -5.34% |
| WAB | Wabtec | | Transports | 144.73 | 31 | -0.35% | 14.05% |
| DCI | Donaldson | | Industrials | 72.23 | 31 | -0.30% | 10.53% |
| EEFT | Euronet Worldwide | | Services & Goods | 101.50 | 31 | -0.26% | 0.01% |
| IR | Ingersoll Rand | | Industrials | 91.05 | 31 | -0.25% | 17.73% |
| AYI | Acuity | | Technology | 252.18 | 31 | -0.11% | 23.12% |
| TXT | Textron | | Industrials | 92.97 | 31 | -0.09% | 15.61% |
| APH | Amphenol | | Technology | 112.37 | 31 | -0.02% | 13.36% |
| CR | Crane Co | | Industrials | 131.18 | 31 | -0.01% | 11.03% |
| For chart view version of above stock list: Chart View ➞ 0 - 25 , 25 - 50 , 50 - 75 , 75 - 100 , 100 - 125 , 125 - 150 , 150 - 175 , 175 - 200 , 200 - 225 , 225 - 250 , 250 - 275 , 275 - 300 , 300 - 325 , 325 - 350 , 350 - 375 , 375 - 400 , 400 - 425 , 425 - 450 , 450 - 475 , 475 - 500 , 500 - 525 , 525 - 550 , 550 - 575 , 575 - 600 , 600 - 625 , 625 - 650 , 650 - 675 , 675 - 700 | ||
 | Click To Change The Sort Order: By Market Cap or Company Size Performance: Year-to-date, Week and Day |  |
|
Get the most comprehensive stock market coverage daily at 12Stocks.com ➞ Best Stocks Today ➞ Best Stocks Weekly ➞ Best Stocks Year-to-Date ➞ Best Stocks Trends ➞  Best Stocks Today 12Stocks.com Best Nasdaq Stocks ➞ Best S&P 500 Stocks ➞ Best Tech Stocks ➞ Best Biotech Stocks ➞ |
| Detailed Overview of Midcap Stocks |
| Midcap Technical Overview, Leaders & Laggards, Top Midcap ETF Funds & Detailed Midcap Stocks List, Charts, Trends & More |
| Midcap: Technical Analysis, Trends & YTD Performance | |
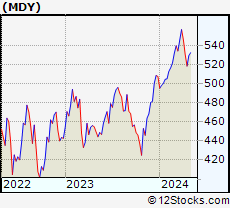
| MidCap segment as represented by
MDY, an exchange-traded fund [ETF], holds basket of about four hundred midcap stocks from across all major sectors of the US stock market. The midcap index (contains stocks like Green Mountain Coffee Roasters and Tractor Supply Company) is up by 2.63% and is currently underperforming the overall market by -2.42% year-to-date. Below is a quick view of technical charts and trends: | |
 MDY Weekly Chart |
|
| Long Term Trend: Good | |
| Medium Term Trend: Not Good | |
 MDY Daily Chart |
|
| Short Term Trend: Not Good | |
| Overall Trend Score: 26 | |
| YTD Performance: 2.63% | |
| **Trend Scores & Views Are Only For Educational Purposes And Not For Investing | |
| 12Stocks.com: Investing in Midcap Index using Exchange Traded Funds | |
|
The following table shows list of key exchange traded funds (ETF) that
help investors track Midcap index. The following list also includes leveraged ETF funds that track twice or thrice the daily returns of Midcap indices. Short or inverse ETF funds move in the opposite direction to the index they track and are useful during market pullbacks or during bear markets. Quick View: Move mouse or cursor over ETF symbol (ticker) to view short-term technical chart and over ETF name to view long term chart. Click on ticker or stock name for detailed view. Click on to add stock symbol to your watchlist and to view watchlist. |
12Stocks.com List of ETFs that track Midcap Index
| Ticker | ETF Name | Watchlist | Recent Price | Smart Investing & Trading Score | Change % | Week % | Year-to-date % |
| IJH | iShares Core S&P Mid-Cap | | 56.88 | 31 | -0.66 | -1.74 | 2.62% |
| IWR | iShares Russell Mid-Cap | | 79.09 | 31 | -0.63 | -1.89 | 1.76% |
| MDY | SPDR S&P MidCap 400 ETF | | 520.73 | 26 | -0.64 | -1.74 | 2.63% |
| IWP | iShares Russell Mid-Cap Growth | | 107.74 | 26 | -0.39 | -1.91 | 3.14% |
| IJK | iShares S&P Mid-Cap 400 Growth | | 85.99 | 31 | -0.54 | -1.7 | 8.55% |
| IWS | iShares Russell Mid-Cap Value | | 117.53 | 31 | -0.88 | -1.97 | 1.07% |
| IJJ | iShares S&P Mid-Cap 400 Value | | 109.66 | 13 | -0.83 | -2.08 | -3.84% |
| UMDD | ProShares UltraPro MidCap400 | | 22.80 | 26 | -2.73 | -5.67 | 2.15% |
| XMLV | PowerShares S&P MidCap Low Volatil ETF | | 53.53 | 36 | -0.42 | -1.32 | 0.67% |
| MVV | ProShares Ultra MidCap400 | | 59.02 | 36 | -4.33 | -4.39 | 1.95% |
| SMDD | ProShares UltraPro Short MidCap400 | | 12.57 | 64 | 3.94 | 6.97 | -6.65% |
| MYY | ProShares Short MidCap400 | | 21.18 | 64 | 1.29 | 2.31 | -1.28% |
| MZZ | ProShares UltraShort MidCap400 | | 12.06 | 34 | 1.26 | 3.97 | -4.06% |
| 12Stocks.com: Charts, Trends, Fundamental Data and Performances of MidCap Stocks | |
|
We now take in-depth look at all MidCap stocks including charts, multi-period performances and overall trends (as measured by Smart Investing & Trading Score). One can sort MidCap stocks (click link to choose) by Daily, Weekly and by Year-to-Date performances. Also, one can sort by size of the company or by market capitalization. |
| Select Your Default Chart Type: | |||||
| |||||
| Click on stock symbol or name for detailed view. Click on to add stock symbol to your watchlist and to view watchlist. Quick View: Move mouse or cursor over "Daily" to quickly view daily technical stock chart and over "Weekly" to view weekly technical stock chart. | |||||

 | NVR NVR, Inc. |
| Sector: Industrials | |
| SubSector: Residential Construction | |
| MarketCap: 9912.56 Millions | |
| Recent Price: 7674.50 Smart Investing & Trading Score: 31 | |
| Day Percent Change: -1.12% Day Change: -86.94 | |
| Week Change: -1.84% Year-to-date Change: 9.6% | |
| NVR Links: Profile News Message Board | |
| Charts:- Daily , Weekly | |
| Add NVR to Watchlist: View: Get Complete NVR Trend Analysis ➞ | |
 | PNR Pentair plc |
| Sector: Industrials | |
| SubSector: Industrial Equipment & Components | |
| MarketCap: 4326.59 Millions | |
| Recent Price: 79.42 Smart Investing & Trading Score: 31 | |
| Day Percent Change: -1.12% Day Change: -0.90 | |
| Week Change: -2.07% Year-to-date Change: 9.2% | |
| PNR Links: Profile News Message Board | |
| Charts:- Daily , Weekly | |
| Add PNR to Watchlist: View: Get Complete PNR Trend Analysis ➞ | |
 | WRK WestRock Company |
| Sector: Consumer Staples | |
| SubSector: Packaging & Containers | |
| MarketCap: 7835.43 Millions | |
| Recent Price: 47.01 Smart Investing & Trading Score: 31 | |
| Day Percent Change: -1.03% Day Change: -0.49 | |
| Week Change: -2.04% Year-to-date Change: 13.2% | |
| WRK Links: Profile News Message Board | |
| Charts:- Daily , Weekly | |
| Add WRK to Watchlist: View: Get Complete WRK Trend Analysis ➞ | |
 | JHG Janus Henderson Group plc |
| Sector: Financials | |
| SubSector: Asset Management | |
| MarketCap: 2992.33 Millions | |
| Recent Price: 30.88 Smart Investing & Trading Score: 31 | |
| Day Percent Change: -1.03% Day Change: -0.32 | |
| Week Change: -2.68% Year-to-date Change: 2.4% | |
| JHG Links: Profile News Message Board | |
| Charts:- Daily , Weekly | |
| Add JHG to Watchlist: View: Get Complete JHG Trend Analysis ➞ | |
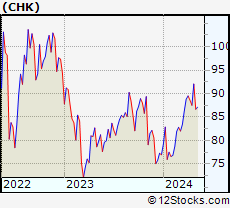 | CHK Chesapeake Energy Corporation |
| Sector: Energy | |
| SubSector: Oil & Gas E&P | |
| MarketCap: 10840 Millions | |
| Recent Price: 86.67 Smart Investing & Trading Score: 31 | |
| Day Percent Change: -1.01% Day Change: -0.89 | |
| Week Change: -2.16% Year-to-date Change: 12.7% | |
| CHK Links: Profile News Message Board | |
| Charts:- Daily , Weekly | |
| Add CHK to Watchlist: View: Get Complete CHK Trend Analysis ➞ | |
 | MHK Mohawk Industries, Inc. |
| Sector: Consumer Staples | |
| SubSector: Home Furnishings & Fixtures | |
| MarketCap: 4682.25 Millions | |
| Recent Price: 110.63 Smart Investing & Trading Score: 31 | |
| Day Percent Change: -0.98% Day Change: -1.09 | |
| Week Change: -2.25% Year-to-date Change: 6.9% | |
| MHK Links: Profile News Message Board | |
| Charts:- Daily , Weekly | |
| Add MHK to Watchlist: View: Get Complete MHK Trend Analysis ➞ | |
 | CLH Clean Harbors, Inc. |
| Sector: Industrials | |
| SubSector: Waste Management | |
| MarketCap: 2391.28 Millions | |
| Recent Price: 192.89 Smart Investing & Trading Score: 31 | |
| Day Percent Change: -0.90% Day Change: -1.75 | |
| Week Change: -1.97% Year-to-date Change: 10.5% | |
| CLH Links: Profile News Message Board | |
| Charts:- Daily , Weekly | |
| Add CLH to Watchlist: View: Get Complete CLH Trend Analysis ➞ | |
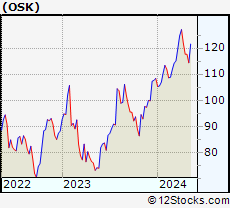 | OSK Oshkosh Corporation |
| Sector: Consumer Staples | |
| SubSector: Trucks & Other Vehicles | |
| MarketCap: 3708 Millions | |
| Recent Price: 119.32 Smart Investing & Trading Score: 31 | |
| Day Percent Change: -0.84% Day Change: -1.01 | |
| Week Change: -2.2% Year-to-date Change: 10.1% | |
| OSK Links: Profile News Message Board | |
| Charts:- Daily , Weekly | |
| Add OSK to Watchlist: View: Get Complete OSK Trend Analysis ➞ | |
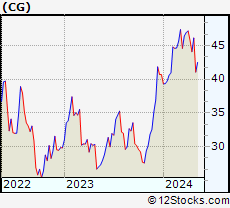 | CG The Carlyle Group Inc. |
| Sector: Financials | |
| SubSector: Asset Management | |
| MarketCap: 7269.33 Millions | |
| Recent Price: 44.89 Smart Investing & Trading Score: 31 | |
| Day Percent Change: -0.84% Day Change: -0.38 | |
| Week Change: -1.97% Year-to-date Change: 10.3% | |
| CG Links: Profile News Message Board | |
| Charts:- Daily , Weekly | |
| Add CG to Watchlist: View: Get Complete CG Trend Analysis ➞ | |
 | MIDD The Middleby Corporation |
| Sector: Industrials | |
| SubSector: Diversified Machinery | |
| MarketCap: 3070.36 Millions | |
| Recent Price: 142.15 Smart Investing & Trading Score: 31 | |
| Day Percent Change: -0.82% Day Change: -1.17 | |
| Week Change: -2.25% Year-to-date Change: -3.4% | |
| MIDD Links: Profile News Message Board | |
| Charts:- Daily , Weekly | |
| Add MIDD to Watchlist: View: Get Complete MIDD Trend Analysis ➞ | |
 | TRIP TripAdvisor, Inc. |
| Sector: Technology | |
| SubSector: Internet Information Providers | |
| MarketCap: 2633.9 Millions | |
| Recent Price: 25.27 Smart Investing & Trading Score: 31 | |
| Day Percent Change: -0.80% Day Change: -0.21 | |
| Week Change: -5.48% Year-to-date Change: 17.4% | |
| TRIP Links: Profile News Message Board | |
| Charts:- Daily , Weekly | |
| Add TRIP to Watchlist: View: Get Complete TRIP Trend Analysis ➞ | |
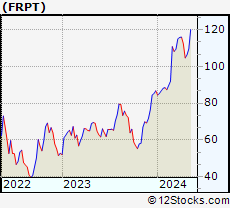 | FRPT Freshpet, Inc. |
| Sector: Consumer Staples | |
| SubSector: Food - Major Diversified | |
| MarketCap: 2449.23 Millions | |
| Recent Price: 105.01 Smart Investing & Trading Score: 31 | |
| Day Percent Change: -0.64% Day Change: -0.68 | |
| Week Change: -6.66% Year-to-date Change: 21.0% | |
| FRPT Links: Profile News Message Board | |
| Charts:- Daily , Weekly | |
| Add FRPT to Watchlist: View: Get Complete FRPT Trend Analysis ➞ | |
 | WU The Western Union Company |
| Sector: Financials | |
| SubSector: Credit Services | |
| MarketCap: 7974.48 Millions | |
| Recent Price: 12.77 Smart Investing & Trading Score: 31 | |
| Day Percent Change: -0.55% Day Change: -0.07 | |
| Week Change: -3.18% Year-to-date Change: 7.1% | |
| WU Links: Profile News Message Board | |
| Charts:- Daily , Weekly | |
| Add WU to Watchlist: View: Get Complete WU Trend Analysis ➞ | |
 | PH Parker-Hannifin Corporation |
| Sector: Industrials | |
| SubSector: Industrial Equipment & Components | |
| MarketCap: 14888.9 Millions | |
| Recent Price: 540.78 Smart Investing & Trading Score: 31 | |
| Day Percent Change: -0.48% Day Change: -2.59 | |
| Week Change: -1.73% Year-to-date Change: 17.4% | |
| PH Links: Profile News Message Board | |
| Charts:- Daily , Weekly | |
| Add PH to Watchlist: View: Get Complete PH Trend Analysis ➞ | |
 | PWR Quanta Services, Inc. |
| Sector: Industrials | |
| SubSector: General Contractors | |
| MarketCap: 3936.63 Millions | |
| Recent Price: 247.72 Smart Investing & Trading Score: 31 | |
| Day Percent Change: -0.47% Day Change: -1.17 | |
| Week Change: -2.74% Year-to-date Change: 14.8% | |
| PWR Links: Profile News Message Board | |
| Charts:- Daily , Weekly | |
| Add PWR to Watchlist: View: Get Complete PWR Trend Analysis ➞ | |
 | SLM SLM Corporation |
| Sector: Financials | |
| SubSector: Credit Services | |
| MarketCap: 3099.78 Millions | |
| Recent Price: 20.64 Smart Investing & Trading Score: 31 | |
| Day Percent Change: -0.41% Day Change: -0.08 | |
| Week Change: -0.17% Year-to-date Change: 7.9% | |
| SLM Links: Profile News Message Board | |
| Charts:- Daily , Weekly | |
| Add SLM to Watchlist: View: Get Complete SLM Trend Analysis ➞ | |
 | SQ Square, Inc. |
| Sector: Technology | |
| SubSector: Internet Software & Services | |
| MarketCap: 19323.1 Millions | |
| Recent Price: 73.22 Smart Investing & Trading Score: 31 | |
| Day Percent Change: -0.38% Day Change: -0.28 | |
| Week Change: -4.9% Year-to-date Change: -5.3% | |
| SQ Links: Profile News Message Board | |
| Charts:- Daily , Weekly | |
| Add SQ to Watchlist: View: Get Complete SQ Trend Analysis ➞ | |
 | WAB Wabtec Corporation |
| Sector: Transports | |
| SubSector: Railroads | |
| MarketCap: 8230.22 Millions | |
| Recent Price: 144.73 Smart Investing & Trading Score: 31 | |
| Day Percent Change: -0.35% Day Change: -0.51 | |
| Week Change: -0.99% Year-to-date Change: 14.1% | |
| WAB Links: Profile News Message Board | |
| Charts:- Daily , Weekly | |
| Add WAB to Watchlist: View: Get Complete WAB Trend Analysis ➞ | |
 | DCI Donaldson Company, Inc. |
| Sector: Industrials | |
| SubSector: Diversified Machinery | |
| MarketCap: 4993.46 Millions | |
| Recent Price: 72.23 Smart Investing & Trading Score: 31 | |
| Day Percent Change: -0.30% Day Change: -0.22 | |
| Week Change: -1.69% Year-to-date Change: 10.5% | |
| DCI Links: Profile News Message Board | |
| Charts:- Daily , Weekly | |
| Add DCI to Watchlist: View: Get Complete DCI Trend Analysis ➞ | |
 | EEFT Euronet Worldwide, Inc. |
| Sector: Services & Goods | |
| SubSector: Business Services | |
| MarketCap: 4809.62 Millions | |
| Recent Price: 101.50 Smart Investing & Trading Score: 31 | |
| Day Percent Change: -0.26% Day Change: -0.26 | |
| Week Change: -2.55% Year-to-date Change: 0.0% | |
| EEFT Links: Profile News Message Board | |
| Charts:- Daily , Weekly | |
| Add EEFT to Watchlist: View: Get Complete EEFT Trend Analysis ➞ | |
 | IR Ingersoll Rand Inc. |
| Sector: Industrials | |
| SubSector: Diversified Machinery | |
| MarketCap: 8970.56 Millions | |
| Recent Price: 91.05 Smart Investing & Trading Score: 31 | |
| Day Percent Change: -0.25% Day Change: -0.23 | |
| Week Change: -0.95% Year-to-date Change: 17.7% | |
| IR Links: Profile News Message Board | |
| Charts:- Daily , Weekly | |
| Add IR to Watchlist: View: Get Complete IR Trend Analysis ➞ | |
 | AYI Acuity Brands, Inc. |
| Sector: Technology | |
| SubSector: Diversified Electronics | |
| MarketCap: 3356.66 Millions | |
| Recent Price: 252.18 Smart Investing & Trading Score: 31 | |
| Day Percent Change: -0.11% Day Change: -0.29 | |
| Week Change: -2.1% Year-to-date Change: 23.1% | |
| AYI Links: Profile News Message Board | |
| Charts:- Daily , Weekly | |
| Add AYI to Watchlist: View: Get Complete AYI Trend Analysis ➞ | |
 | TXT Textron Inc. |
| Sector: Industrials | |
| SubSector: Aerospace/Defense - Major Diversified | |
| MarketCap: 6123.09 Millions | |
| Recent Price: 92.97 Smart Investing & Trading Score: 31 | |
| Day Percent Change: -0.09% Day Change: -0.09 | |
| Week Change: -1.05% Year-to-date Change: 15.6% | |
| TXT Links: Profile News Message Board | |
| Charts:- Daily , Weekly | |
| Add TXT to Watchlist: View: Get Complete TXT Trend Analysis ➞ | |
 | APH Amphenol Corporation |
| Sector: Technology | |
| SubSector: Diversified Electronics | |
| MarketCap: 23422 Millions | |
| Recent Price: 112.37 Smart Investing & Trading Score: 31 | |
| Day Percent Change: -0.02% Day Change: -0.02 | |
| Week Change: -0.84% Year-to-date Change: 13.4% | |
| APH Links: Profile News Message Board | |
| Charts:- Daily , Weekly | |
| Add APH to Watchlist: View: Get Complete APH Trend Analysis ➞ | |
 | CR Crane Co. |
| Sector: Industrials | |
| SubSector: Diversified Machinery | |
| MarketCap: 2715.16 Millions | |
| Recent Price: 131.18 Smart Investing & Trading Score: 31 | |
| Day Percent Change: -0.01% Day Change: -0.01 | |
| Week Change: -2.73% Year-to-date Change: 11.0% | |
| CR Links: Profile News Message Board | |
| Charts:- Daily , Weekly | |
| Add CR to Watchlist: View: Get Complete CR Trend Analysis ➞ | |
| For tabular summary view of above stock list: Summary View ➞ 0 - 25 , 25 - 50 , 50 - 75 , 75 - 100 , 100 - 125 , 125 - 150 , 150 - 175 , 175 - 200 , 200 - 225 , 225 - 250 , 250 - 275 , 275 - 300 , 300 - 325 , 325 - 350 , 350 - 375 , 375 - 400 , 400 - 425 , 425 - 450 , 450 - 475 , 475 - 500 , 500 - 525 , 525 - 550 , 550 - 575 , 575 - 600 , 600 - 625 , 625 - 650 , 650 - 675 , 675 - 700 | ||
| Click To Change The Sort Order: By Market Cap or Company Size Performance: Year-to-date, Week and Day | |
| Select Chart Type: | ||
|
Best Stocks Today 12Stocks.com |
© 2024 12Stocks.com Terms & Conditions Privacy Contact Us
All Information Provided Only For Education And Not To Be Used For Investing or Trading. See Terms & Conditions


One More Thing ... Get Best Stocks Delivered Daily!
Never Ever Miss A Move With Our Top Ten Stocks Lists
Find Best Stocks In Any Market - Bull or Bear Market
Take A Peek At Our Top Ten Stocks Lists: Daily, Weekly, Year-to-Date & Top Trends
Find Best Stocks In Any Market - Bull or Bear Market
Take A Peek At Our Top Ten Stocks Lists: Daily, Weekly, Year-to-Date & Top Trends
Midcap Stocks With Best Up Trends [0-bearish to 100-bullish]: Medical Properties[93], HEICO [90], Formula One[83], BioMarin Pharmaceutical[68], Virtu Financial[66], Targa Resources[66], Pilgrim s[66], Diamondback Energy[66], Commerce Bancshares[65], Church & Dwight Co[63], Murphy USA[63]
Best Midcap Stocks Year-to-Date:
ShockWave Medical[71.77%], Vistra Energy[71.42%], EMCOR [61.03%], Spotify [57.84%], Pure Storage[47.2%], Natera [44.57%], NRG Energy[42.03%], Williams-Sonoma [41.99%], Wingstop [40.92%], XPO Logistics[38.21%], Allison Transmission[37.9%] Best Midcap Stocks This Week:
Medical Properties[16.67%], Cardinal Health[2.46%], Coty [2.43%], HEICO [2.14%], Church & Dwight Co[1.96%], New York[1.94%], Lamb Weston[1.83%], M&T Bank[1.79%], Murphy USA[1.79%], Flowers Foods[1.7%], Commerce Bancshares[1.62%] Best Midcap Stocks Daily:
AMC Entertainment[6.28%], Etsy [2.95%], Coty [2.52%], Neurocrine Biosciences[2.30%], Spotify [2.09%], SYNNEX [2.08%], Commerce Bancshares[1.98%], Science Applications[1.82%], Kemper [1.79%], Lumentum [1.79%], Apellis [1.76%]