
 Login Sign Up


| |||||
 |  | ||||

| 12Stocks.com Market Intelligence |
Best MidCap Stocks
|
| In a hurry? Mid Cap Stocks Lists: Performance Trends Table, Stock Charts
Sort midcap stocks: Daily, Weekly, Year-to-Date, Market Cap & Trends. Filter midcap stocks list by sector: Show all, Tech, Finance, Energy, Staples, Retail, Industrial, Materials, Utilities and HealthCare Filter midcap stocks list by size:All MidCap Large Mid-Range Small |
| 12Stocks.com Mid Cap Stocks Performances & Trends Daily | |||||||||
|
|  The overall Smart Investing & Trading Score is 63 (0-bearish to 100-bullish) which puts Mid Cap index in short term neutral to bullish trend. The Smart Investing & Trading Score from previous trading session is 44 and an improvement of trend continues.
| ||||||||
Here are the Smart Investing & Trading Scores of the most requested mid cap stocks at 12Stocks.com (click stock name for detailed review):
|


| 12Stocks.com: Top Performing Mid Cap Index Stocks | ||||||||||||||||||||||||||||||||||||||||||||||||
 The top performing Mid Cap Index stocks year to date are
Now, more recently, over last week, the top performing Mid Cap Index stocks on the move are


|
||||||||||||||||||||||||||||||||||||||||||||||||
| 12Stocks.com: Investing in Midcap Index with Stocks | |
|
The following table helps investors and traders sort through current performance and trends (as measured by Smart Investing & Trading Score) of various
stocks in the Midcap Index. Quick View: Move mouse or cursor over stock symbol (ticker) to view short-term technical chart and over stock name to view long term chart. Click on  to add stock symbol to your watchlist and to add stock symbol to your watchlist and  to view watchlist. Click on any ticker or stock name for detailed market intelligence report for that stock. to view watchlist. Click on any ticker or stock name for detailed market intelligence report for that stock. |
12Stocks.com Performance of Stocks in Midcap Index
| Ticker | Stock Name | Watchlist | Category | Recent Price | Smart Investing & Trading Score | Change % | YTD Change% |
| WSM | Williams-Sonoma |   | Services & Goods | 285.51 | 68 | 0.15% | 41.50% |
| NTRS | Northern Trust | | Financials | 84.30 | 68 | 0.14% | -0.09% |
| CNM | Core & Main | | Industrials | 56.01 | 68 | 0.07% | 38.23% |
| JEF | Jefferies Financial | | Financials | 44.60 | 68 | 0.02% | 10.37% |
| AFG | American Financial | | Financials | 129.72 | 68 | 0.01% | 9.11% |
| DRVN | Driven | | Services & Goods | 14.52 | 68 | -3.49% | 1.15% |
| MEDP | Medpace | | Health Care | 397.56 | 68 | -2.36% | 29.70% |
| A | Agilent Technologies | | Health Care | 137.49 | 68 | -1.23% | -1.11% |
| TOST | Toast | | Technology | 22.91 | 68 | -1.19% | 25.15% |
| ICUI | ICU Medical | | Health Care | 96.72 | 68 | -1.06% | -3.03% |
| LAZ | Lazard | | Financials | 39.30 | 68 | -0.83% | 12.93% |
| CAVA | CAVA | | Services & Goods | 60.73 | 68 | -0.76% | 39.66% |
| HOG | Harley-Davidson | | Consumer Staples | 39.44 | 68 | -0.75% | 7.06% |
| FLS | Flowserve | | Industrials | 46.73 | 68 | -0.74% | 13.37% |
| PSX | Phillips 66 | | Energy | 157.79 | 68 | -0.66% | 18.51% |
| HOLX | Hologic | | Health Care | 76.71 | 68 | -0.62% | 7.36% |
| OWL | Blue Owl | | Financials | 18.59 | 68 | -0.56% | 24.88% |
| WDC | Western Digital | | Technology | 69.55 | 68 | -0.53% | 32.81% |
| CROX | Crocs | | Consumer Staples | 125.77 | 68 | -0.52% | 34.64% |
| MRVI | Maravai LifeSciences | | Health Care | 7.68 | 68 | -0.52% | 17.25% |
| LAMR | Lamar Advertising | | Financials | 114.06 | 68 | -0.51% | 7.32% |
| MTD | Mettler-Toledo | | Health Care | 1235.37 | 68 | -0.48% | 1.85% |
| FTI | TechnipFMC | | Energy | 25.72 | 68 | -0.46% | 27.71% |
| CG | Carlyle | | Financials | 46.12 | 68 | -0.45% | 13.34% |
| DKS | DICK S | | Services & Goods | 205.48 | 68 | -0.30% | 39.83% |
| For chart view version of above stock list: Chart View ➞ 0 - 25 , 25 - 50 , 50 - 75 , 75 - 100 , 100 - 125 , 125 - 150 , 150 - 175 , 175 - 200 , 200 - 225 , 225 - 250 , 250 - 275 , 275 - 300 , 300 - 325 , 325 - 350 , 350 - 375 , 375 - 400 , 400 - 425 , 425 - 450 , 450 - 475 , 475 - 500 , 500 - 525 , 525 - 550 , 550 - 575 , 575 - 600 , 600 - 625 , 625 - 650 , 650 - 675 , 675 - 700 , 700 - 725 , 725 - 750 , 750 - 775 | ||
 | Click To Change The Sort Order: By Market Cap or Company Size Performance: Year-to-date, Week and Day |  |
|
Get the most comprehensive stock market coverage daily at 12Stocks.com ➞ Best Stocks Today ➞ Best Stocks Weekly ➞ Best Stocks Year-to-Date ➞ Best Stocks Trends ➞  Best Stocks Today 12Stocks.com Best Nasdaq Stocks ➞ Best S&P 500 Stocks ➞ Best Tech Stocks ➞ Best Biotech Stocks ➞ |
| Detailed Overview of Midcap Stocks |
| Midcap Technical Overview, Leaders & Laggards, Top Midcap ETF Funds & Detailed Midcap Stocks List, Charts, Trends & More |
| Midcap: Technical Analysis, Trends & YTD Performance | |
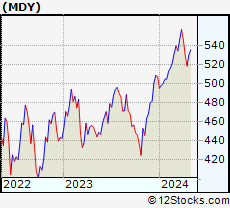
| MidCap segment as represented by
MDY, an exchange-traded fund [ETF], holds basket of about four hundred midcap stocks from across all major sectors of the US stock market. The midcap index (contains stocks like Green Mountain Coffee Roasters and Tractor Supply Company) is up by 4.42% and is currently underperforming the overall market by -1.24% year-to-date. Below is a quick view of technical charts and trends: | |
 MDY Weekly Chart |
|
| Long Term Trend: Very Good | |
| Medium Term Trend: Not Good | |
 MDY Daily Chart |
|
| Short Term Trend: Very Good | |
| Overall Trend Score: 63 | |
| YTD Performance: 4.42% | |
| **Trend Scores & Views Are Only For Educational Purposes And Not For Investing | |
| 12Stocks.com: Investing in Midcap Index using Exchange Traded Funds | |
|
The following table shows list of key exchange traded funds (ETF) that
help investors track Midcap index. The following list also includes leveraged ETF funds that track twice or thrice the daily returns of Midcap indices. Short or inverse ETF funds move in the opposite direction to the index they track and are useful during market pullbacks or during bear markets. Quick View: Move mouse or cursor over ETF symbol (ticker) to view short-term technical chart and over ETF name to view long term chart. Click on ticker or stock name for detailed view. Click on to add stock symbol to your watchlist and to view watchlist. |
12Stocks.com List of ETFs that track Midcap Index
| Ticker | ETF Name | Watchlist | Recent Price | Smart Investing & Trading Score | Change % | Week % | Year-to-date % |
| IJH | iShares Core S&P Mid-Cap | | 57.87 | 68 | 0.03 | 2.28 | 4.4% |
| IWR | iShares Russell Mid-Cap | | 80.41 | 63 | 0.05 | 2.22 | 3.45% |
| IWP | iShares Russell Mid-Cap Growth | | 108.49 | 58 | -0.13 | 2.64 | 3.86% |
| MDY | SPDR S&P MidCap 400 ETF | | 529.80 | 63 | 0.00 | 2.22 | 4.42% |
| IJK | iShares S&P Mid-Cap 400 Growth | | 86.99 | 63 | 0.07 | 2.52 | 9.81% |
| IWS | iShares Russell Mid-Cap Value | | 119.97 | 68 | 0.09 | 1.97 | 3.16% |
| IJJ | iShares S&P Mid-Cap 400 Value | | 112.59 | 51 | 0.11 | 1.85 | -1.27% |
| XMLV | PowerShares S&P MidCap Low Volatil ETF | | 55.04 | 75 | 0.24 | 1.62 | 3.5% |
| MVV | ProShares Ultra MidCap400 | | 61.60 | 41 | 0.10 | 4.41 | 6.41% |
| UMDD | ProShares UltraPro MidCap400 | | 24.09 | 63 | -0.08 | 6.77 | 7.93% |
| SMDD | ProShares UltraPro Short MidCap400 | | 11.84 | 32 | 1.58 | -5.79 | -12.1% |
| MYY | ProShares Short MidCap400 | | 20.74 | 32 | 0.00 | -2.12 | -3.33% |
| MZZ | ProShares UltraShort MidCap400 | | 11.69 | 34 | 0.26 | -3.95 | -7.01% |
| 12Stocks.com: Charts, Trends, Fundamental Data and Performances of MidCap Stocks | |
|
We now take in-depth look at all MidCap stocks including charts, multi-period performances and overall trends (as measured by Smart Investing & Trading Score). One can sort MidCap stocks (click link to choose) by Daily, Weekly and by Year-to-Date performances. Also, one can sort by size of the company or by market capitalization. |
| Select Your Default Chart Type: | |||||
| |||||
| Click on stock symbol or name for detailed view. Click on to add stock symbol to your watchlist and to view watchlist. Quick View: Move mouse or cursor over "Daily" to quickly view daily technical stock chart and over "Weekly" to view weekly technical stock chart. | |||||

 | WSM Williams-Sonoma, Inc. |
| Sector: Services & Goods | |
| SubSector: Home Furnishing Stores | |
| MarketCap: 3370.05 Millions | |
| Recent Price: 285.51 Smart Investing & Trading Score: 68 | |
| Day Percent Change: 0.15% Day Change: 0.44 | |
| Week Change: 2.26% Year-to-date Change: 41.5% | |
| WSM Links: Profile News Message Board | |
| Charts:- Daily , Weekly | |
| Add WSM to Watchlist: View: Get Complete WSM Trend Analysis ➞ | |
 | NTRS Northern Trust Corporation |
| Sector: Financials | |
| SubSector: Asset Management | |
| MarketCap: 15316.8 Millions | |
| Recent Price: 84.30 Smart Investing & Trading Score: 68 | |
| Day Percent Change: 0.14% Day Change: 0.12 | |
| Week Change: 3.5% Year-to-date Change: -0.1% | |
| NTRS Links: Profile News Message Board | |
| Charts:- Daily , Weekly | |
| Add NTRS to Watchlist: View: Get Complete NTRS Trend Analysis ➞ | |
 | CNM Core & Main, Inc. |
| Sector: Industrials | |
| SubSector: Industrial Distribution | |
| MarketCap: 7150 Millions | |
| Recent Price: 56.01 Smart Investing & Trading Score: 68 | |
| Day Percent Change: 0.07% Day Change: 0.04 | |
| Week Change: 3.4% Year-to-date Change: 38.2% | |
| CNM Links: Profile News Message Board | |
| Charts:- Daily , Weekly | |
| Add CNM to Watchlist: View: Get Complete CNM Trend Analysis ➞ | |
 | JEF Jefferies Financial Group Inc. |
| Sector: Financials | |
| SubSector: Investment Brokerage - Regional | |
| MarketCap: 3987.15 Millions | |
| Recent Price: 44.60 Smart Investing & Trading Score: 68 | |
| Day Percent Change: 0.02% Day Change: 0.01 | |
| Week Change: 5.76% Year-to-date Change: 10.4% | |
| JEF Links: Profile News Message Board | |
| Charts:- Daily , Weekly | |
| Add JEF to Watchlist: View: Get Complete JEF Trend Analysis ➞ | |
 | AFG American Financial Group, Inc. |
| Sector: Financials | |
| SubSector: Property & Casualty Insurance | |
| MarketCap: 5353.82 Millions | |
| Recent Price: 129.72 Smart Investing & Trading Score: 68 | |
| Day Percent Change: 0.01% Day Change: 0.01 | |
| Week Change: 1.45% Year-to-date Change: 9.1% | |
| AFG Links: Profile News Message Board | |
| Charts:- Daily , Weekly | |
| Add AFG to Watchlist: View: Get Complete AFG Trend Analysis ➞ | |
 | DRVN Driven Brands Holdings Inc. |
| Sector: Services & Goods | |
| SubSector: Auto & Truck Dealerships | |
| MarketCap: 4490 Millions | |
| Recent Price: 14.52 Smart Investing & Trading Score: 68 | |
| Day Percent Change: -3.49% Day Change: -0.53 | |
| Week Change: 2.91% Year-to-date Change: 1.2% | |
| DRVN Links: Profile News Message Board | |
| Charts:- Daily , Weekly | |
| Add DRVN to Watchlist: View: Get Complete DRVN Trend Analysis ➞ | |
 | MEDP Medpace Holdings, Inc. |
| Sector: Health Care | |
| SubSector: Medical Laboratories & Research | |
| MarketCap: 2888.7 Millions | |
| Recent Price: 397.56 Smart Investing & Trading Score: 68 | |
| Day Percent Change: -2.36% Day Change: -9.59 | |
| Week Change: 6.91% Year-to-date Change: 29.7% | |
| MEDP Links: Profile News Message Board | |
| Charts:- Daily , Weekly | |
| Add MEDP to Watchlist: View: Get Complete MEDP Trend Analysis ➞ | |
 | A Agilent Technologies, Inc. |
| Sector: Health Care | |
| SubSector: Medical Laboratories & Research | |
| MarketCap: 22337.9 Millions | |
| Recent Price: 137.49 Smart Investing & Trading Score: 68 | |
| Day Percent Change: -1.23% Day Change: -1.71 | |
| Week Change: 3.59% Year-to-date Change: -1.1% | |
| A Links: Profile News Message Board | |
| Charts:- Daily , Weekly | |
| Add A to Watchlist: View: Get Complete A Trend Analysis ➞ | |
 | TOST Toast, Inc. |
| Sector: Technology | |
| SubSector: Software - Infrastructure | |
| MarketCap: 11680 Millions | |
| Recent Price: 22.91 Smart Investing & Trading Score: 68 | |
| Day Percent Change: -1.19% Day Change: -0.28 | |
| Week Change: 5.99% Year-to-date Change: 25.2% | |
| TOST Links: Profile News Message Board | |
| Charts:- Daily , Weekly | |
| Add TOST to Watchlist: View: Get Complete TOST Trend Analysis ➞ | |
 | ICUI ICU Medical, Inc. |
| Sector: Health Care | |
| SubSector: Medical Instruments & Supplies | |
| MarketCap: 3640.7 Millions | |
| Recent Price: 96.72 Smart Investing & Trading Score: 68 | |
| Day Percent Change: -1.06% Day Change: -1.04 | |
| Week Change: 0.99% Year-to-date Change: -3.0% | |
| ICUI Links: Profile News Message Board | |
| Charts:- Daily , Weekly | |
| Add ICUI to Watchlist: View: Get Complete ICUI Trend Analysis ➞ | |
 | LAZ Lazard Ltd |
| Sector: Financials | |
| SubSector: Asset Management | |
| MarketCap: 3061.13 Millions | |
| Recent Price: 39.30 Smart Investing & Trading Score: 68 | |
| Day Percent Change: -0.83% Day Change: -0.33 | |
| Week Change: 3.67% Year-to-date Change: 12.9% | |
| LAZ Links: Profile News Message Board | |
| Charts:- Daily , Weekly | |
| Add LAZ to Watchlist: View: Get Complete LAZ Trend Analysis ➞ | |
 | CAVA CAVA Group, Inc. |
| Sector: Services & Goods | |
| SubSector: Restaurants | |
| MarketCap: 4510 Millions | |
| Recent Price: 60.73 Smart Investing & Trading Score: 68 | |
| Day Percent Change: -0.76% Day Change: -0.46 | |
| Week Change: 1.77% Year-to-date Change: 39.7% | |
| CAVA Links: Profile News Message Board | |
| Charts:- Daily , Weekly | |
| Add CAVA to Watchlist: View: Get Complete CAVA Trend Analysis ➞ | |
 | HOG Harley-Davidson, Inc. |
| Sector: Consumer Staples | |
| SubSector: Recreational Vehicles | |
| MarketCap: 2808.49 Millions | |
| Recent Price: 39.44 Smart Investing & Trading Score: 68 | |
| Day Percent Change: -0.75% Day Change: -0.30 | |
| Week Change: 3.68% Year-to-date Change: 7.1% | |
| HOG Links: Profile News Message Board | |
| Charts:- Daily , Weekly | |
| Add HOG to Watchlist: View: Get Complete HOG Trend Analysis ➞ | |
 | FLS Flowserve Corporation |
| Sector: Industrials | |
| SubSector: Diversified Machinery | |
| MarketCap: 2974.66 Millions | |
| Recent Price: 46.73 Smart Investing & Trading Score: 68 | |
| Day Percent Change: -0.74% Day Change: -0.35 | |
| Week Change: 2.03% Year-to-date Change: 13.4% | |
| FLS Links: Profile News Message Board | |
| Charts:- Daily , Weekly | |
| Add FLS to Watchlist: View: Get Complete FLS Trend Analysis ➞ | |
 | PSX Phillips 66 |
| Sector: Energy | |
| SubSector: Oil & Gas Refining & Marketing | |
| MarketCap: 25253.6 Millions | |
| Recent Price: 157.79 Smart Investing & Trading Score: 68 | |
| Day Percent Change: -0.66% Day Change: -1.05 | |
| Week Change: 1.99% Year-to-date Change: 18.5% | |
| PSX Links: Profile News Message Board | |
| Charts:- Daily , Weekly | |
| Add PSX to Watchlist: View: Get Complete PSX Trend Analysis ➞ | |
 | HOLX Hologic, Inc. |
| Sector: Health Care | |
| SubSector: Medical Instruments & Supplies | |
| MarketCap: 9075.2 Millions | |
| Recent Price: 76.71 Smart Investing & Trading Score: 68 | |
| Day Percent Change: -0.62% Day Change: -0.48 | |
| Week Change: 1.76% Year-to-date Change: 7.4% | |
| HOLX Links: Profile News Message Board | |
| Charts:- Daily , Weekly | |
| Add HOLX to Watchlist: View: Get Complete HOLX Trend Analysis ➞ | |
 | OWL Blue Owl Capital Inc. |
| Sector: Financials | |
| SubSector: Asset Management | |
| MarketCap: 16240 Millions | |
| Recent Price: 18.59 Smart Investing & Trading Score: 68 | |
| Day Percent Change: -0.56% Day Change: -0.11 | |
| Week Change: 1.83% Year-to-date Change: 24.9% | |
| OWL Links: Profile News Message Board | |
| Charts:- Daily , Weekly | |
| Add OWL to Watchlist: View: Get Complete OWL Trend Analysis ➞ | |
 | WDC Western Digital Corporation |
| Sector: Technology | |
| SubSector: Data Storage Devices | |
| MarketCap: 10712.9 Millions | |
| Recent Price: 69.55 Smart Investing & Trading Score: 68 | |
| Day Percent Change: -0.53% Day Change: -0.37 | |
| Week Change: 5.3% Year-to-date Change: 32.8% | |
| WDC Links: Profile News Message Board | |
| Charts:- Daily , Weekly | |
| Add WDC to Watchlist: View: Get Complete WDC Trend Analysis ➞ | |
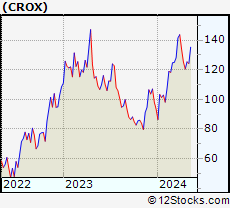 | CROX Crocs, Inc. |
| Sector: Consumer Staples | |
| SubSector: Textile - Apparel Footwear & Accessories | |
| MarketCap: 823.47 Millions | |
| Recent Price: 125.77 Smart Investing & Trading Score: 68 | |
| Day Percent Change: -0.52% Day Change: -0.66 | |
| Week Change: 4.34% Year-to-date Change: 34.6% | |
| CROX Links: Profile News Message Board | |
| Charts:- Daily , Weekly | |
| Add CROX to Watchlist: View: Get Complete CROX Trend Analysis ➞ | |
 | MRVI Maravai LifeSciences Holdings, Inc. |
| Sector: Health Care | |
| SubSector: Biotechnology | |
| MarketCap: 67887 Millions | |
| Recent Price: 7.68 Smart Investing & Trading Score: 68 | |
| Day Percent Change: -0.52% Day Change: -0.04 | |
| Week Change: 4.35% Year-to-date Change: 17.3% | |
| MRVI Links: Profile News Message Board | |
| Charts:- Daily , Weekly | |
| Add MRVI to Watchlist: View: Get Complete MRVI Trend Analysis ➞ | |
 | LAMR Lamar Advertising Company (REIT) |
| Sector: Financials | |
| SubSector: REIT - Diversified | |
| MarketCap: 4838.33 Millions | |
| Recent Price: 114.06 Smart Investing & Trading Score: 68 | |
| Day Percent Change: -0.51% Day Change: -0.58 | |
| Week Change: 2.35% Year-to-date Change: 7.3% | |
| LAMR Links: Profile News Message Board | |
| Charts:- Daily , Weekly | |
| Add LAMR to Watchlist: View: Get Complete LAMR Trend Analysis ➞ | |
 | MTD Mettler-Toledo International Inc. |
| Sector: Health Care | |
| SubSector: Medical Instruments & Supplies | |
| MarketCap: 15973.1 Millions | |
| Recent Price: 1235.37 Smart Investing & Trading Score: 68 | |
| Day Percent Change: -0.48% Day Change: -5.95 | |
| Week Change: 3.94% Year-to-date Change: 1.9% | |
| MTD Links: Profile News Message Board | |
| Charts:- Daily , Weekly | |
| Add MTD to Watchlist: View: Get Complete MTD Trend Analysis ➞ | |
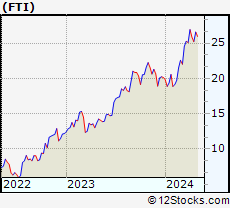 | FTI TechnipFMC plc |
| Sector: Energy | |
| SubSector: Oil & Gas Equipment & Services | |
| MarketCap: 3406.71 Millions | |
| Recent Price: 25.72 Smart Investing & Trading Score: 68 | |
| Day Percent Change: -0.46% Day Change: -0.12 | |
| Week Change: 1.98% Year-to-date Change: 27.7% | |
| FTI Links: Profile News Message Board | |
| Charts:- Daily , Weekly | |
| Add FTI to Watchlist: View: Get Complete FTI Trend Analysis ➞ | |
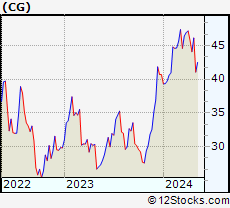 | CG The Carlyle Group Inc. |
| Sector: Financials | |
| SubSector: Asset Management | |
| MarketCap: 7269.33 Millions | |
| Recent Price: 46.12 Smart Investing & Trading Score: 68 | |
| Day Percent Change: -0.45% Day Change: -0.21 | |
| Week Change: 4.63% Year-to-date Change: 13.3% | |
| CG Links: Profile News Message Board | |
| Charts:- Daily , Weekly | |
| Add CG to Watchlist: View: Get Complete CG Trend Analysis ➞ | |
 | DKS DICK S Sporting Goods, Inc. |
| Sector: Services & Goods | |
| SubSector: Sporting Goods Stores | |
| MarketCap: 1672.04 Millions | |
| Recent Price: 205.48 Smart Investing & Trading Score: 68 | |
| Day Percent Change: -0.30% Day Change: -0.61 | |
| Week Change: 5.33% Year-to-date Change: 39.8% | |
| DKS Links: Profile News Message Board | |
| Charts:- Daily , Weekly | |
| Add DKS to Watchlist: View: Get Complete DKS Trend Analysis ➞ | |
| For tabular summary view of above stock list: Summary View ➞ 0 - 25 , 25 - 50 , 50 - 75 , 75 - 100 , 100 - 125 , 125 - 150 , 150 - 175 , 175 - 200 , 200 - 225 , 225 - 250 , 250 - 275 , 275 - 300 , 300 - 325 , 325 - 350 , 350 - 375 , 375 - 400 , 400 - 425 , 425 - 450 , 450 - 475 , 475 - 500 , 500 - 525 , 525 - 550 , 550 - 575 , 575 - 600 , 600 - 625 , 625 - 650 , 650 - 675 , 675 - 700 , 700 - 725 , 725 - 750 , 750 - 775 | ||
| Click To Change The Sort Order: By Market Cap or Company Size Performance: Year-to-date, Week and Day | |
| Select Chart Type: | ||
|
Best Stocks Today 12Stocks.com |
© 2024 12Stocks.com Terms & Conditions Privacy Contact Us
All Information Provided Only For Education And Not To Be Used For Investing or Trading. See Terms & Conditions


One More Thing ... Get Best Stocks Delivered Daily!
Never Ever Miss A Move With Our Top Ten Stocks Lists
Find Best Stocks In Any Market - Bull or Bear Market
Take A Peek At Our Top Ten Stocks Lists: Daily, Weekly, Year-to-Date & Top Trends
Find Best Stocks In Any Market - Bull or Bear Market
Take A Peek At Our Top Ten Stocks Lists: Daily, Weekly, Year-to-Date & Top Trends
Midcap Stocks With Best Up Trends [0-bearish to 100-bullish]: Hasbro [100], Wabtec [100], Allegro Micro[100], Microchip [100], Synchrony Financial[100], EQT [100], Prosperity Bancshares[100], Range Resources[100], Virtu Financial[100], Crane Co[100], National Fuel[100]
Best Midcap Stocks Year-to-Date:
Vistra Energy[82.92%], AppLovin [74.52%], ShockWave Medical[72.58%], Constellation Energy[59.4%], EMCOR [57.31%], Spotify [49.66%], Natera [46.07%], Pure Storage[42.04%], Williams-Sonoma [41.5%], Wingstop [41.38%], NRG Energy[40.44%] Best Midcap Stocks This Week:
HashiCorp [23.7%], Globe Life[17.77%], Hasbro [17.66%], Tandem Diabetes[15.41%], Wabtec [13.32%], MongoDB [12.82%], Ryder System[12.4%], Microchip [11.02%], Watsco [11%], Crane Co[9.77%], Coinbase Global[9.74%] Best Midcap Stocks Daily:
Hasbro [11.85%], Wabtec [10.04%], CoStar [8.66%], Allegro Micro[8.24%], GameStop [7.58%], Watsco [6.54%], ON Semiconductor[6.24%], Hertz Global[6.23%], Sarepta [6.09%], Lattice Semiconductor[5.31%], Microchip [5.21%]