
 Login Sign Up


| |||||
 |  | ||||

| 12Stocks.com Market Intelligence |
Best MidCap Stocks
|
| In a hurry? Mid Cap Stocks Lists: Performance Trends Table, Stock Charts
Sort midcap stocks: Daily, Weekly, Year-to-Date, Market Cap & Trends. Filter midcap stocks list by sector: Show all, Tech, Finance, Energy, Staples, Retail, Industrial, Materials, Utilities and HealthCare Filter midcap stocks list by size:All MidCap Large Mid-Range Small |
| 12Stocks.com Mid Cap Stocks Performances & Trends Daily | |||||||||
|
|  The overall Smart Investing & Trading Score is 70 (0-bearish to 100-bullish) which puts Mid Cap index in short term neutral to bullish trend. The Smart Investing & Trading Score from previous trading session is 56 and hence an improvement of trend.
| ||||||||
Here are the Smart Investing & Trading Scores of the most requested mid cap stocks at 12Stocks.com (click stock name for detailed review):
|


| 12Stocks.com: Top Performing Mid Cap Index Stocks | ||||||||||||||||||||||||||||||||||||||||||||||||
 The top performing Mid Cap Index stocks year to date are
Now, more recently, over last week, the top performing Mid Cap Index stocks on the move are


|
||||||||||||||||||||||||||||||||||||||||||||||||
| 12Stocks.com: Investing in Midcap Index with Stocks | |
|
The following table helps investors and traders sort through current performance and trends (as measured by Smart Investing & Trading Score) of various
stocks in the Midcap Index. Quick View: Move mouse or cursor over stock symbol (ticker) to view short-term technical chart and over stock name to view long term chart. Click on  to add stock symbol to your watchlist and to add stock symbol to your watchlist and  to view watchlist. Click on any ticker or stock name for detailed market intelligence report for that stock. to view watchlist. Click on any ticker or stock name for detailed market intelligence report for that stock. |
12Stocks.com Performance of Stocks in Midcap Index
| Ticker | Stock Name | Watchlist | Category | Recent Price | Smart Investing & Trading Score | Change % | YTD Change% |
| PTON | Peloton Interactive |   | Consumer Staples | 3.27 | 47 | 3.32% | -46.39% |
| SEB | Seaboard | | Industrials | 3296.05 | 47 | 2.77% | -7.68% |
| AGCO | AGCO | | Industrials | 119.55 | 47 | 2.52% | -1.53% |
| NOV | National Oilwell | | Energy | 19.26 | 47 | 2.07% | -5.03% |
| WPC | W. P. | | Financials | 55.65 | 47 | 1.13% | -14.13% |
| MKL | Markel | | Financials | 1456.17 | 47 | 1.37% | 2.55% |
| RNR | RenaissanceRe | | Financials | 221.04 | 47 | 0.89% | 12.78% |
| OGN | Organon | | Health Care | 18.99 | 46 | 2.37% | 32.43% |
| CAVA | CAVA | | Services & Goods | 70.34 | 46 | 1.71% | 61.78% |
| HAYW | Hayward | | Industrials | 13.96 | 46 | 1.34% | 2.53% |
| INFA | Informatica | | Technology | 32.06 | 46 | 0.49% | 12.79% |
| CEG | Constellation Energy | | Utilities | 189.02 | 46 | 0.34% | 61.40% |
| TOST | Toast | | Technology | 23.93 | 46 | 0.08% | 30.69% |
| COIN | Coinbase Global | | Financials | 221.13 | 46 | -6.48% | 27.98% |
| CFLT | Confluent | | Technology | 28.94 | 46 | -2.76% | 21.90% |
| HOOD | Robinhood Markets | | Technology | 17.49 | 46 | -2.24% | 37.93% |
| ESAB | ESAB | | Industrials | 107.43 | 46 | -0.40% | 23.51% |
| CPNG | Coupang | | Services & Goods | 22.87 | 46 | -0.17% | 41.17% |
| FIS | Fidelity National | | Technology | 69.56 | 46 | -0.06% | 15.80% |
| TW | Tradeweb Markets | | Services & Goods | 101.28 | 46 | -0.55% | 11.44% |
| PTC | PTC | | Technology | 180.07 | 45 | -0.51% | 2.92% |
| PODD | Insulet | | Health Care | 169.38 | 45 | 1.92% | -21.94% |
| SNV | Synovus Financial | | Financials | 36.66 | 45 | -0.50% | -2.62% |
| FFIV | F5 Networks | | Technology | 181.69 | 45 | -0.14% | 1.51% |
| PLNT | Planet Fitness | | Services & Goods | 60.23 | 45 | -0.07% | -17.49% |
| For chart view version of above stock list: Chart View ➞ 0 - 25 , 25 - 50 , 50 - 75 , 75 - 100 , 100 - 125 , 125 - 150 , 150 - 175 , 175 - 200 , 200 - 225 , 225 - 250 , 250 - 275 , 275 - 300 , 300 - 325 , 325 - 350 , 350 - 375 , 375 - 400 , 400 - 425 , 425 - 450 , 450 - 475 , 475 - 500 , 500 - 525 , 525 - 550 , 550 - 575 , 575 - 600 , 600 - 625 , 625 - 650 , 650 - 675 , 675 - 700 , 700 - 725 , 725 - 750 , 750 - 775 | ||
 | Click To Change The Sort Order: By Market Cap or Company Size Performance: Year-to-date, Week and Day |  |
|
Get the most comprehensive stock market coverage daily at 12Stocks.com ➞ Best Stocks Today ➞ Best Stocks Weekly ➞ Best Stocks Year-to-Date ➞ Best Stocks Trends ➞  Best Stocks Today 12Stocks.com Best Nasdaq Stocks ➞ Best S&P 500 Stocks ➞ Best Tech Stocks ➞ Best Biotech Stocks ➞ |
| Detailed Overview of Midcap Stocks |
| Midcap Technical Overview, Leaders & Laggards, Top Midcap ETF Funds & Detailed Midcap Stocks List, Charts, Trends & More |
| Midcap: Technical Analysis, Trends & YTD Performance | |
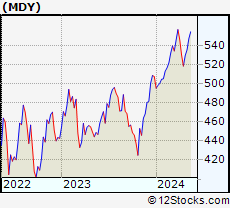
| MidCap segment as represented by
MDY, an exchange-traded fund [ETF], holds basket of about four hundred midcap stocks from across all major sectors of the US stock market. The midcap index (contains stocks like Green Mountain Coffee Roasters and Tractor Supply Company) is up by 4.92% and is currently underperforming the overall market by -1.37% year-to-date. Below is a quick view of technical charts and trends: | |
 MDY Weekly Chart |
|
| Long Term Trend: Very Good | |
| Medium Term Trend: Good | |
 MDY Daily Chart |
|
| Short Term Trend: Very Good | |
| Overall Trend Score: 70 | |
| YTD Performance: 4.92% | |
| **Trend Scores & Views Are Only For Educational Purposes And Not For Investing | |
| 12Stocks.com: Investing in Midcap Index using Exchange Traded Funds | |
|
The following table shows list of key exchange traded funds (ETF) that
help investors track Midcap index. The following list also includes leveraged ETF funds that track twice or thrice the daily returns of Midcap indices. Short or inverse ETF funds move in the opposite direction to the index they track and are useful during market pullbacks or during bear markets. Quick View: Move mouse or cursor over ETF symbol (ticker) to view short-term technical chart and over ETF name to view long term chart. Click on ticker or stock name for detailed view. Click on to add stock symbol to your watchlist and to view watchlist. |
12Stocks.com List of ETFs that track Midcap Index
| Ticker | ETF Name | Watchlist | Recent Price | Smart Investing & Trading Score | Change % | Week % | Year-to-date % |
| IWR | iShares Russell Mid-Cap | | 80.94 | 75 | 0.52 | 0.52 | 4.12% |
| IJH | iShares Core S&P Mid-Cap | | 58.08 | 75 | 0.44 | 0.44 | 4.77% |
| IWP | iShares Russell Mid-Cap Growth | | 109.38 | 78 | 0.37 | 0.37 | 4.71% |
| MDY | SPDR S&P MidCap 400 ETF | | 532.34 | 70 | 0.56 | 0.56 | 4.92% |
| IWS | iShares Russell Mid-Cap Value | | 120.78 | 75 | 0.66 | 0.66 | 3.86% |
| IJK | iShares S&P Mid-Cap 400 Growth | | 87.42 | 70 | 0.48 | 0.48 | 10.35% |
| IJJ | iShares S&P Mid-Cap 400 Value | | 113.04 | 88 | 0.72 | 0.72 | -0.88% |
| UMDD | ProShares UltraPro MidCap400 | | 24.45 | 78 | 2.05 | 2.05 | 9.55% |
| XMLV | PowerShares S&P MidCap Low Volatil ETF | | 54.95 | 83 | 0.54 | 0.54 | 3.32% |
| SMDD | ProShares UltraPro Short MidCap400 | | 11.57 | 10 | -2.20 | -2.2 | -14.07% |
| MYY | ProShares Short MidCap400 | | 20.64 | 25 | -0.72 | -0.72 | -3.8% |
| MZZ | ProShares UltraShort MidCap400 | | 11.58 | 27 | -0.86 | -0.86 | -7.88% |
| MVV | ProShares Ultra MidCap400 | | 62.18 | 83 | 1.22 | 1.22 | 7.41% |
| 12Stocks.com: Charts, Trends, Fundamental Data and Performances of MidCap Stocks | |
|
We now take in-depth look at all MidCap stocks including charts, multi-period performances and overall trends (as measured by Smart Investing & Trading Score). One can sort MidCap stocks (click link to choose) by Daily, Weekly and by Year-to-Date performances. Also, one can sort by size of the company or by market capitalization. |
| Select Your Default Chart Type: | |||||
| |||||
| Click on stock symbol or name for detailed view. Click on to add stock symbol to your watchlist and to view watchlist. Quick View: Move mouse or cursor over "Daily" to quickly view daily technical stock chart and over "Weekly" to view weekly technical stock chart. | |||||

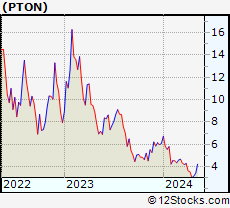 | PTON Peloton Interactive, Inc. |
| Sector: Consumer Staples | |
| SubSector: Sporting Goods | |
| MarketCap: 7282.44 Millions | |
| Recent Price: 3.27 Smart Investing & Trading Score: 47 | |
| Day Percent Change: 3.32% Day Change: 0.10 | |
| Week Change: 3.32% Year-to-date Change: -46.4% | |
| PTON Links: Profile News Message Board | |
| Charts:- Daily , Weekly | |
| Add PTON to Watchlist: View: Get Complete PTON Trend Analysis ➞ | |
 | SEB Seaboard Corporation |
| Sector: Industrials | |
| SubSector: Conglomerates | |
| MarketCap: 3161.78 Millions | |
| Recent Price: 3296.05 Smart Investing & Trading Score: 47 | |
| Day Percent Change: 2.77% Day Change: 88.83 | |
| Week Change: 2.77% Year-to-date Change: -7.7% | |
| SEB Links: Profile News Message Board | |
| Charts:- Daily , Weekly | |
| Add SEB to Watchlist: View: Get Complete SEB Trend Analysis ➞ | |
 | AGCO AGCO Corporation |
| Sector: Industrials | |
| SubSector: Farm & Construction Machinery | |
| MarketCap: 3399.57 Millions | |
| Recent Price: 119.55 Smart Investing & Trading Score: 47 | |
| Day Percent Change: 2.52% Day Change: 2.94 | |
| Week Change: 2.52% Year-to-date Change: -1.5% | |
| AGCO Links: Profile News Message Board | |
| Charts:- Daily , Weekly | |
| Add AGCO to Watchlist: View: Get Complete AGCO Trend Analysis ➞ | |
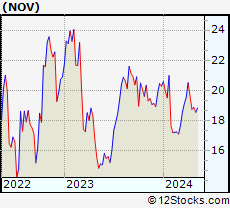 | NOV National Oilwell Varco, Inc. |
| Sector: Energy | |
| SubSector: Oil & Gas Equipment & Services | |
| MarketCap: 4737.41 Millions | |
| Recent Price: 19.26 Smart Investing & Trading Score: 47 | |
| Day Percent Change: 2.07% Day Change: 0.39 | |
| Week Change: 2.07% Year-to-date Change: -5.0% | |
| NOV Links: Profile News Message Board | |
| Charts:- Daily , Weekly | |
| Add NOV to Watchlist: View: Get Complete NOV Trend Analysis ➞ | |
 | WPC W. P. Carey Inc. |
| Sector: Financials | |
| SubSector: REIT - Diversified | |
| MarketCap: 9560.03 Millions | |
| Recent Price: 55.65 Smart Investing & Trading Score: 47 | |
| Day Percent Change: 1.13% Day Change: 0.62 | |
| Week Change: 1.13% Year-to-date Change: -14.1% | |
| WPC Links: Profile News Message Board | |
| Charts:- Daily , Weekly | |
| Add WPC to Watchlist: View: Get Complete WPC Trend Analysis ➞ | |
 | MKL Markel Corporation |
| Sector: Financials | |
| SubSector: Property & Casualty Insurance | |
| MarketCap: 12405.9 Millions | |
| Recent Price: 1456.17 Smart Investing & Trading Score: 47 | |
| Day Percent Change: 1.37% Day Change: 19.65 | |
| Week Change: 1.37% Year-to-date Change: 2.6% | |
| MKL Links: Profile News Message Board | |
| Charts:- Daily , Weekly | |
| Add MKL to Watchlist: View: Get Complete MKL Trend Analysis ➞ | |
 | RNR RenaissanceRe Holdings Ltd. |
| Sector: Financials | |
| SubSector: Property & Casualty Insurance | |
| MarketCap: 6153.32 Millions | |
| Recent Price: 221.04 Smart Investing & Trading Score: 47 | |
| Day Percent Change: 0.89% Day Change: 1.96 | |
| Week Change: 0.89% Year-to-date Change: 12.8% | |
| RNR Links: Profile News Message Board | |
| Charts:- Daily , Weekly | |
| Add RNR to Watchlist: View: Get Complete RNR Trend Analysis ➞ | |
 | OGN Organon & Co. |
| Sector: Health Care | |
| SubSector: Drug Manufacturers - General | |
| MarketCap: 5230 Millions | |
| Recent Price: 18.99 Smart Investing & Trading Score: 46 | |
| Day Percent Change: 2.37% Day Change: 0.44 | |
| Week Change: 2.37% Year-to-date Change: 32.4% | |
| OGN Links: Profile News Message Board | |
| Charts:- Daily , Weekly | |
| Add OGN to Watchlist: View: Get Complete OGN Trend Analysis ➞ | |
 | CAVA CAVA Group, Inc. |
| Sector: Services & Goods | |
| SubSector: Restaurants | |
| MarketCap: 4510 Millions | |
| Recent Price: 70.34 Smart Investing & Trading Score: 46 | |
| Day Percent Change: 1.71% Day Change: 1.18 | |
| Week Change: 1.71% Year-to-date Change: 61.8% | |
| CAVA Links: Profile News Message Board | |
| Charts:- Daily , Weekly | |
| Add CAVA to Watchlist: View: Get Complete CAVA Trend Analysis ➞ | |
 | HAYW Hayward Holdings, Inc. |
| Sector: Industrials | |
| SubSector: Electrical Equipment & Parts | |
| MarketCap: 2670 Millions | |
| Recent Price: 13.96 Smart Investing & Trading Score: 46 | |
| Day Percent Change: 1.34% Day Change: 0.19 | |
| Week Change: 1.34% Year-to-date Change: 2.5% | |
| HAYW Links: Profile News Message Board | |
| Charts:- Daily , Weekly | |
| Add HAYW to Watchlist: View: Get Complete HAYW Trend Analysis ➞ | |
 | INFA Informatica Inc. |
| Sector: Technology | |
| SubSector: Software - Infrastructure | |
| MarketCap: 5340 Millions | |
| Recent Price: 32.06 Smart Investing & Trading Score: 46 | |
| Day Percent Change: 0.49% Day Change: 0.16 | |
| Week Change: 0.49% Year-to-date Change: 12.8% | |
| INFA Links: Profile News Message Board | |
| Charts:- Daily , Weekly | |
| Add INFA to Watchlist: View: Get Complete INFA Trend Analysis ➞ | |
 | CEG Constellation Energy Corporation |
| Sector: Utilities | |
| SubSector: Utilities - Renewable | |
| MarketCap: 29600 Millions | |
| Recent Price: 189.02 Smart Investing & Trading Score: 46 | |
| Day Percent Change: 0.34% Day Change: 0.64 | |
| Week Change: 0.34% Year-to-date Change: 61.4% | |
| CEG Links: Profile News Message Board | |
| Charts:- Daily , Weekly | |
| Add CEG to Watchlist: View: Get Complete CEG Trend Analysis ➞ | |
 | TOST Toast, Inc. |
| Sector: Technology | |
| SubSector: Software - Infrastructure | |
| MarketCap: 11680 Millions | |
| Recent Price: 23.93 Smart Investing & Trading Score: 46 | |
| Day Percent Change: 0.08% Day Change: 0.02 | |
| Week Change: 0.08% Year-to-date Change: 30.7% | |
| TOST Links: Profile News Message Board | |
| Charts:- Daily , Weekly | |
| Add TOST to Watchlist: View: Get Complete TOST Trend Analysis ➞ | |
 | COIN Coinbase Global, Inc. |
| Sector: Financials | |
| SubSector: Financial Data & Stock Exchanges | |
| MarketCap: 16390 Millions | |
| Recent Price: 221.13 Smart Investing & Trading Score: 46 | |
| Day Percent Change: -6.48% Day Change: -15.32 | |
| Week Change: -6.48% Year-to-date Change: 28.0% | |
| COIN Links: Profile News Message Board | |
| Charts:- Daily , Weekly | |
| Add COIN to Watchlist: View: Get Complete COIN Trend Analysis ➞ | |
 | CFLT Confluent, Inc. |
| Sector: Technology | |
| SubSector: Software - Infrastructure | |
| MarketCap: 10820 Millions | |
| Recent Price: 28.94 Smart Investing & Trading Score: 46 | |
| Day Percent Change: -2.76% Day Change: -0.82 | |
| Week Change: -2.76% Year-to-date Change: 21.9% | |
| CFLT Links: Profile News Message Board | |
| Charts:- Daily , Weekly | |
| Add CFLT to Watchlist: View: Get Complete CFLT Trend Analysis ➞ | |
 | HOOD Robinhood Markets, Inc. |
| Sector: Technology | |
| SubSector: Software - Infrastructure | |
| MarketCap: 9200 Millions | |
| Recent Price: 17.49 Smart Investing & Trading Score: 46 | |
| Day Percent Change: -2.24% Day Change: -0.40 | |
| Week Change: -2.24% Year-to-date Change: 37.9% | |
| HOOD Links: Profile News Message Board | |
| Charts:- Daily , Weekly | |
| Add HOOD to Watchlist: View: Get Complete HOOD Trend Analysis ➞ | |
 | ESAB ESAB Corporation |
| Sector: Industrials | |
| SubSector: Metal Fabrication | |
| MarketCap: 3940 Millions | |
| Recent Price: 107.43 Smart Investing & Trading Score: 46 | |
| Day Percent Change: -0.40% Day Change: -0.43 | |
| Week Change: -0.4% Year-to-date Change: 23.5% | |
| ESAB Links: Profile News Message Board | |
| Charts:- Daily , Weekly | |
| Add ESAB to Watchlist: View: Get Complete ESAB Trend Analysis ➞ | |
 | CPNG Coupang, Inc. |
| Sector: Services & Goods | |
| SubSector: Internet Retail | |
| MarketCap: 30840 Millions | |
| Recent Price: 22.87 Smart Investing & Trading Score: 46 | |
| Day Percent Change: -0.17% Day Change: -0.04 | |
| Week Change: -0.17% Year-to-date Change: 41.2% | |
| CPNG Links: Profile News Message Board | |
| Charts:- Daily , Weekly | |
| Add CPNG to Watchlist: View: Get Complete CPNG Trend Analysis ➞ | |
 | FIS Fidelity National Information Services, Inc. |
| Sector: Technology | |
| SubSector: Information Technology Services | |
| MarketCap: 71126.8 Millions | |
| Recent Price: 69.56 Smart Investing & Trading Score: 46 | |
| Day Percent Change: -0.06% Day Change: -0.04 | |
| Week Change: -0.06% Year-to-date Change: 15.8% | |
| FIS Links: Profile News Message Board | |
| Charts:- Daily , Weekly | |
| Add FIS to Watchlist: View: Get Complete FIS Trend Analysis ➞ | |
 | TW Tradeweb Markets Inc. |
| Sector: Services & Goods | |
| SubSector: Management Services | |
| MarketCap: 9913.35 Millions | |
| Recent Price: 101.28 Smart Investing & Trading Score: 46 | |
| Day Percent Change: -0.55% Day Change: -0.56 | |
| Week Change: -0.55% Year-to-date Change: 11.4% | |
| TW Links: Profile News Message Board | |
| Charts:- Daily , Weekly | |
| Add TW to Watchlist: View: Get Complete TW Trend Analysis ➞ | |
 | PTC PTC Inc. |
| Sector: Technology | |
| SubSector: Technical & System Software | |
| MarketCap: 6166.7 Millions | |
| Recent Price: 180.07 Smart Investing & Trading Score: 45 | |
| Day Percent Change: -0.51% Day Change: -0.92 | |
| Week Change: -0.51% Year-to-date Change: 2.9% | |
| PTC Links: Profile News Message Board | |
| Charts:- Daily , Weekly | |
| Add PTC to Watchlist: View: Get Complete PTC Trend Analysis ➞ | |
 | PODD Insulet Corporation |
| Sector: Health Care | |
| SubSector: Medical Instruments & Supplies | |
| MarketCap: 9313.2 Millions | |
| Recent Price: 169.38 Smart Investing & Trading Score: 45 | |
| Day Percent Change: 1.92% Day Change: 3.19 | |
| Week Change: 1.92% Year-to-date Change: -21.9% | |
| PODD Links: Profile News Message Board | |
| Charts:- Daily , Weekly | |
| Add PODD to Watchlist: View: Get Complete PODD Trend Analysis ➞ | |
 | SNV Synovus Financial Corp. |
| Sector: Financials | |
| SubSector: Regional - Mid-Atlantic Banks | |
| MarketCap: 2697.29 Millions | |
| Recent Price: 36.66 Smart Investing & Trading Score: 45 | |
| Day Percent Change: -0.50% Day Change: -0.19 | |
| Week Change: -0.5% Year-to-date Change: -2.6% | |
| SNV Links: Profile News Message Board | |
| Charts:- Daily , Weekly | |
| Add SNV to Watchlist: View: Get Complete SNV Trend Analysis ➞ | |
 | FFIV F5 Networks, Inc. |
| Sector: Technology | |
| SubSector: Business Software & Services | |
| MarketCap: 6675.38 Millions | |
| Recent Price: 181.69 Smart Investing & Trading Score: 45 | |
| Day Percent Change: -0.14% Day Change: -0.25 | |
| Week Change: -0.14% Year-to-date Change: 1.5% | |
| FFIV Links: Profile News Message Board | |
| Charts:- Daily , Weekly | |
| Add FFIV to Watchlist: View: Get Complete FFIV Trend Analysis ➞ | |
 | PLNT Planet Fitness, Inc. |
| Sector: Services & Goods | |
| SubSector: Sporting Activities | |
| MarketCap: 3485.94 Millions | |
| Recent Price: 60.23 Smart Investing & Trading Score: 45 | |
| Day Percent Change: -0.07% Day Change: -0.04 | |
| Week Change: -0.07% Year-to-date Change: -17.5% | |
| PLNT Links: Profile News Message Board | |
| Charts:- Daily , Weekly | |
| Add PLNT to Watchlist: View: Get Complete PLNT Trend Analysis ➞ | |
| For tabular summary view of above stock list: Summary View ➞ 0 - 25 , 25 - 50 , 50 - 75 , 75 - 100 , 100 - 125 , 125 - 150 , 150 - 175 , 175 - 200 , 200 - 225 , 225 - 250 , 250 - 275 , 275 - 300 , 300 - 325 , 325 - 350 , 350 - 375 , 375 - 400 , 400 - 425 , 425 - 450 , 450 - 475 , 475 - 500 , 500 - 525 , 525 - 550 , 550 - 575 , 575 - 600 , 600 - 625 , 625 - 650 , 650 - 675 , 675 - 700 , 700 - 725 , 725 - 750 , 750 - 775 | ||
| Click To Change The Sort Order: By Market Cap or Company Size Performance: Year-to-date, Week and Day | |
| Select Chart Type: | ||
|
Best Stocks Today 12Stocks.com |
© 2024 12Stocks.com Terms & Conditions Privacy Contact Us
All Information Provided Only For Education And Not To Be Used For Investing or Trading. See Terms & Conditions


One More Thing ... Get Best Stocks Delivered Daily!
Never Ever Miss A Move With Our Top Ten Stocks Lists
Find Best Stocks In Any Market - Bull or Bear Market
Take A Peek At Our Top Ten Stocks Lists: Daily, Weekly, Year-to-Date & Top Trends
Find Best Stocks In Any Market - Bull or Bear Market
Take A Peek At Our Top Ten Stocks Lists: Daily, Weekly, Year-to-Date & Top Trends
Midcap Stocks With Best Up Trends [0-bearish to 100-bullish]: Albemarle [100], Tandem Diabetes[100], Domino s[100], Quest Diagnostics[100], Skyworks Solutions[100], Carrier Global[100], Teradyne [100], LPL Financial[100], Aptar [100], United [100], Cirrus Logic[100]
Best Midcap Stocks Year-to-Date:
Vistra Energy[100.05%], AppLovin [81.61%], ShockWave Medical[73.32%], EMCOR [69.17%], CAVA [61.78%], Constellation Energy[61.4%], Spotify [53.34%], Wingstop [50.33%], Natera [49.98%], Antero Resources[49.78%], Pure Storage[47.04%] Best Midcap Stocks This Week:
Ginkgo Bioworks[16.85%], Hertz Global[8.26%], Albemarle [7.36%], Tandem Diabetes[7.07%], Vistra Energy[6%], Liberty SiriusXM[5.49%], Liberty SiriusXM[5.32%], Sunrun [5.25%], Domino s[5.08%], Sirius XM[4.8%], Medical Properties[4.66%] Best Midcap Stocks Daily:
Ginkgo Bioworks[16.85%], Hertz Global[8.26%], Albemarle [7.36%], Tandem Diabetes[7.07%], Vistra Energy[6.00%], Liberty SiriusXM[5.49%], Liberty SiriusXM[5.32%], Sunrun [5.25%], Domino s[5.08%], Sirius XM[4.80%], Medical Properties[4.66%]