
 Login Sign Up


| |||||
 |  | ||||

| 12Stocks.com Market Intelligence |
Best MidCap Stocks
|
| In a hurry? Mid Cap Stocks Lists: Performance Trends Table, Stock Charts
Sort midcap stocks: Daily, Weekly, Year-to-Date, Market Cap & Trends. Filter midcap stocks list by sector: Show all, Tech, Finance, Energy, Staples, Retail, Industrial, Materials, Utilities and HealthCare Filter midcap stocks list by size:All MidCap Large Mid-Range Small |
| 12Stocks.com Mid Cap Stocks Performances & Trends Daily | |||||||||
|
|  The overall Smart Investing & Trading Score is 49 (0-bearish to 100-bullish) which puts Mid Cap index in short term neutral trend. The Smart Investing & Trading Score from previous trading session is 63 and hence a deterioration of trend.
| ||||||||
Here are the Smart Investing & Trading Scores of the most requested mid cap stocks at 12Stocks.com (click stock name for detailed review):
|


| 12Stocks.com: Top Performing Mid Cap Index Stocks | ||||||||||||||||||||||||||||||||||||||||||||||||
 The top performing Mid Cap Index stocks year to date are
Now, more recently, over last week, the top performing Mid Cap Index stocks on the move are


|
||||||||||||||||||||||||||||||||||||||||||||||||
| 12Stocks.com: Investing in Midcap Index with Stocks | |
|
The following table helps investors and traders sort through current performance and trends (as measured by Smart Investing & Trading Score) of various
stocks in the Midcap Index. Quick View: Move mouse or cursor over stock symbol (ticker) to view short-term technical chart and over stock name to view long term chart. Click on  to add stock symbol to your watchlist and to add stock symbol to your watchlist and  to view watchlist. Click on any ticker or stock name for detailed market intelligence report for that stock. to view watchlist. Click on any ticker or stock name for detailed market intelligence report for that stock. |
12Stocks.com Performance of Stocks in Midcap Index
| Ticker | Stock Name | Watchlist | Category | Recent Price | Smart Investing & Trading Score | Change % | YTD Change% |
| PHM | Pulte |   | Industrials | 111.36 | 58 | -0.80% | 7.89% |
| BLDR | Builders FirstSource | | Industrials | 185.26 | 58 | -0.77% | 10.97% |
| RL | Ralph Lauren | | Consumer Staples | 166.93 | 58 | -0.76% | 15.76% |
| JLL | Jones Lang | | Financials | 180.51 | 58 | -0.74% | -4.43% |
| TPG | TPG | | Financials | 43.43 | 58 | -0.60% | 0.38% |
| HLT | Hilton Worldwide | | Services & Goods | 203.93 | 58 | -0.38% | 11.99% |
| ITT | ITT | | Industrials | 130.15 | 58 | -0.25% | 9.08% |
| EHC | Encompass Health | | Health Care | 82.73 | 58 | -0.08% | 24.00% |
| FHN | First Horizon | | Financials | 14.80 | 58 | -0.87% | 4.52% |
| ROKU | Roku | | Technology | 62.82 | 57 | 1.60% | -31.46% |
| ESTC | Elastic N.V | | Technology | 104.79 | 57 | 1.04% | -7.02% |
| EXPE | Expedia | | Services & Goods | 136.25 | 57 | 0.33% | -10.24% |
| AMC | AMC Entertainment | | Services & Goods | 3.28 | 57 | 0.00% | -46.41% |
| COTY | Coty | | Consumer Staples | 11.42 | 57 | -2.39% | -8.05% |
| PVH | PVH | | Consumer Staples | 110.79 | 57 | -1.84% | -9.28% |
| SKX | Skechers U.S.A | | Consumer Staples | 58.82 | 57 | -0.56% | -5.65% |
| DT | Dynatrace | | Technology | 46.60 | 57 | -0.30% | -14.79% |
| CCL | Carnival | | Services & Goods | 15.18 | 57 | 1.13% | -18.12% |
| CBOE | Cboe Global | | Financials | 181.52 | 57 | 1.02% | 1.66% |
| BIIB | Biogen | | Health Care | 202.46 | 57 | 0.23% | -21.76% |
| SAM | Boston Beer | | Consumer Staples | 287.27 | 57 | -2.06% | -16.88% |
| XEL | Xcel Energy | | Utilities | 55.01 | 57 | -0.58% | -11.15% |
| PSTG | Pure Storage | | Technology | 52.22 | 56 | 3.10% | 46.44% |
| NU | Nu | | Financials | 10.87 | 56 | 1.87% | 30.34% |
| HUBB | Hubbell | | Technology | 402.27 | 56 | 0.93% | 22.30% |
| For chart view version of above stock list: Chart View ➞ 0 - 25 , 25 - 50 , 50 - 75 , 75 - 100 , 100 - 125 , 125 - 150 , 150 - 175 , 175 - 200 , 200 - 225 , 225 - 250 , 250 - 275 , 275 - 300 , 300 - 325 , 325 - 350 , 350 - 375 , 375 - 400 , 400 - 425 , 425 - 450 , 450 - 475 , 475 - 500 , 500 - 525 , 525 - 550 , 550 - 575 , 575 - 600 , 600 - 625 , 625 - 650 , 650 - 675 , 675 - 700 , 700 - 725 , 725 - 750 , 750 - 775 | ||
 | Click To Change The Sort Order: By Market Cap or Company Size Performance: Year-to-date, Week and Day |  |
|
Get the most comprehensive stock market coverage daily at 12Stocks.com ➞ Best Stocks Today ➞ Best Stocks Weekly ➞ Best Stocks Year-to-Date ➞ Best Stocks Trends ➞  Best Stocks Today 12Stocks.com Best Nasdaq Stocks ➞ Best S&P 500 Stocks ➞ Best Tech Stocks ➞ Best Biotech Stocks ➞ |
| Detailed Overview of Midcap Stocks |
| Midcap Technical Overview, Leaders & Laggards, Top Midcap ETF Funds & Detailed Midcap Stocks List, Charts, Trends & More |
| Midcap: Technical Analysis, Trends & YTD Performance | |
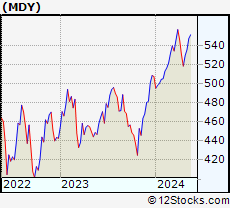
| MidCap segment as represented by
MDY, an exchange-traded fund [ETF], holds basket of about four hundred midcap stocks from across all major sectors of the US stock market. The midcap index (contains stocks like Green Mountain Coffee Roasters and Tractor Supply Company) is up by 4.04% and is currently underperforming the overall market by -1.12% year-to-date. Below is a quick view of technical charts and trends: | |
 MDY Weekly Chart |
|
| Long Term Trend: Good | |
| Medium Term Trend: Not Good | |
 MDY Daily Chart |
|
| Short Term Trend: Very Good | |
| Overall Trend Score: 49 | |
| YTD Performance: 4.04% | |
| **Trend Scores & Views Are Only For Educational Purposes And Not For Investing | |
| 12Stocks.com: Investing in Midcap Index using Exchange Traded Funds | |
|
The following table shows list of key exchange traded funds (ETF) that
help investors track Midcap index. The following list also includes leveraged ETF funds that track twice or thrice the daily returns of Midcap indices. Short or inverse ETF funds move in the opposite direction to the index they track and are useful during market pullbacks or during bear markets. Quick View: Move mouse or cursor over ETF symbol (ticker) to view short-term technical chart and over ETF name to view long term chart. Click on ticker or stock name for detailed view. Click on to add stock symbol to your watchlist and to view watchlist. |
12Stocks.com List of ETFs that track Midcap Index
| Ticker | ETF Name | Watchlist | Recent Price | Smart Investing & Trading Score | Change % | Week % | Year-to-date % |
| IJH | iShares Core S&P Mid-Cap | | 57.68 | 61 | -0.33 | 1.94 | 4.06% |
| IWP | iShares Russell Mid-Cap Growth | | 108.46 | 51 | -0.03 | 2.61 | 3.83% |
| IWR | iShares Russell Mid-Cap | | 80.27 | 56 | -0.17 | 2.05 | 3.27% |
| MDY | SPDR S&P MidCap 400 ETF | | 527.86 | 49 | -0.37 | 1.85 | 4.04% |
| IWS | iShares Russell Mid-Cap Value | | 119.79 | 61 | -0.15 | 1.82 | 3.01% |
| IJK | iShares S&P Mid-Cap 400 Growth | | 86.74 | 56 | -0.29 | 2.23 | 9.49% |
| IJJ | iShares S&P Mid-Cap 400 Value | | 111.95 | 51 | -0.57 | 1.27 | -1.83% |
| XMLV | PowerShares S&P MidCap Low Volatil ETF | | 54.74 | 68 | -0.55 | 1.07 | 2.93% |
| SMDD | ProShares UltraPro Short MidCap400 | | 11.89 | 39 | 0.46 | -5.36 | -11.69% |
| UMDD | ProShares UltraPro MidCap400 | | 23.72 | 49 | -1.54 | 5.13 | 6.27% |
| MVV | ProShares Ultra MidCap400 | | 61.03 | 41 | -0.93 | 3.44 | 5.42% |
| MZZ | ProShares UltraShort MidCap400 | | 11.75 | 34 | 0.51 | -3.46 | -6.53% |
| MYY | ProShares Short MidCap400 | | 20.97 | 39 | 1.11 | -1.03 | -2.26% |
| 12Stocks.com: Charts, Trends, Fundamental Data and Performances of MidCap Stocks | |
|
We now take in-depth look at all MidCap stocks including charts, multi-period performances and overall trends (as measured by Smart Investing & Trading Score). One can sort MidCap stocks (click link to choose) by Daily, Weekly and by Year-to-Date performances. Also, one can sort by size of the company or by market capitalization. |
| Select Your Default Chart Type: | |||||
| |||||
| Click on stock symbol or name for detailed view. Click on to add stock symbol to your watchlist and to view watchlist. Quick View: Move mouse or cursor over "Daily" to quickly view daily technical stock chart and over "Weekly" to view weekly technical stock chart. | |||||

 | PHM PulteGroup, Inc. |
| Sector: Industrials | |
| SubSector: Residential Construction | |
| MarketCap: 6186.46 Millions | |
| Recent Price: 111.36 Smart Investing & Trading Score: 58 | |
| Day Percent Change: -0.80% Day Change: -0.90 | |
| Week Change: 5.62% Year-to-date Change: 7.9% | |
| PHM Links: Profile News Message Board | |
| Charts:- Daily , Weekly | |
| Add PHM to Watchlist: View: Get Complete PHM Trend Analysis ➞ | |
 | BLDR Builders FirstSource, Inc. |
| Sector: Industrials | |
| SubSector: General Building Materials | |
| MarketCap: 1714.63 Millions | |
| Recent Price: 185.26 Smart Investing & Trading Score: 58 | |
| Day Percent Change: -0.77% Day Change: -1.43 | |
| Week Change: 4.65% Year-to-date Change: 11.0% | |
| BLDR Links: Profile News Message Board | |
| Charts:- Daily , Weekly | |
| Add BLDR to Watchlist: View: Get Complete BLDR Trend Analysis ➞ | |
 | RL Ralph Lauren Corporation |
| Sector: Consumer Staples | |
| SubSector: Textile - Apparel Clothing | |
| MarketCap: 5589.95 Millions | |
| Recent Price: 166.93 Smart Investing & Trading Score: 58 | |
| Day Percent Change: -0.76% Day Change: -1.28 | |
| Week Change: 5.35% Year-to-date Change: 15.8% | |
| RL Links: Profile News Message Board | |
| Charts:- Daily , Weekly | |
| Add RL to Watchlist: View: Get Complete RL Trend Analysis ➞ | |
 | JLL Jones Lang LaSalle Incorporated |
| Sector: Financials | |
| SubSector: Property Management | |
| MarketCap: 5259.32 Millions | |
| Recent Price: 180.51 Smart Investing & Trading Score: 58 | |
| Day Percent Change: -0.74% Day Change: -1.35 | |
| Week Change: 3.08% Year-to-date Change: -4.4% | |
| JLL Links: Profile News Message Board | |
| Charts:- Daily , Weekly | |
| Add JLL to Watchlist: View: Get Complete JLL Trend Analysis ➞ | |
 | TPG TPG Inc. |
| Sector: Financials | |
| SubSector: Asset Management | |
| MarketCap: 8700 Millions | |
| Recent Price: 43.43 Smart Investing & Trading Score: 58 | |
| Day Percent Change: -0.60% Day Change: -0.26 | |
| Week Change: 2.24% Year-to-date Change: 0.4% | |
| TPG Links: Profile News Message Board | |
| Charts:- Daily , Weekly | |
| Add TPG to Watchlist: View: Get Complete TPG Trend Analysis ➞ | |
 | HLT Hilton Worldwide Holdings Inc. |
| Sector: Services & Goods | |
| SubSector: Lodging | |
| MarketCap: 18064.6 Millions | |
| Recent Price: 203.93 Smart Investing & Trading Score: 58 | |
| Day Percent Change: -0.38% Day Change: -0.77 | |
| Week Change: 4.86% Year-to-date Change: 12.0% | |
| HLT Links: Profile News Message Board | |
| Charts:- Daily , Weekly | |
| Add HLT to Watchlist: View: Get Complete HLT Trend Analysis ➞ | |
 | ITT ITT Inc. |
| Sector: Industrials | |
| SubSector: Diversified Machinery | |
| MarketCap: 3783.06 Millions | |
| Recent Price: 130.15 Smart Investing & Trading Score: 58 | |
| Day Percent Change: -0.25% Day Change: -0.33 | |
| Week Change: 4.15% Year-to-date Change: 9.1% | |
| ITT Links: Profile News Message Board | |
| Charts:- Daily , Weekly | |
| Add ITT to Watchlist: View: Get Complete ITT Trend Analysis ➞ | |
 | EHC Encompass Health Corporation |
| Sector: Health Care | |
| SubSector: Hospitals | |
| MarketCap: 5384.06 Millions | |
| Recent Price: 82.73 Smart Investing & Trading Score: 58 | |
| Day Percent Change: -0.08% Day Change: -0.07 | |
| Week Change: 4.43% Year-to-date Change: 24.0% | |
| EHC Links: Profile News Message Board | |
| Charts:- Daily , Weekly | |
| Add EHC to Watchlist: View: Get Complete EHC Trend Analysis ➞ | |
 | FHN First Horizon National Corporation |
| Sector: Financials | |
| SubSector: Regional - Southeast Banks | |
| MarketCap: 2661.05 Millions | |
| Recent Price: 14.80 Smart Investing & Trading Score: 58 | |
| Day Percent Change: -0.87% Day Change: -0.13 | |
| Week Change: 1.16% Year-to-date Change: 4.5% | |
| FHN Links: Profile News Message Board | |
| Charts:- Daily , Weekly | |
| Add FHN to Watchlist: View: Get Complete FHN Trend Analysis ➞ | |
 | ROKU Roku, Inc. |
| Sector: Technology | |
| SubSector: CATV Systems | |
| MarketCap: 10503.6 Millions | |
| Recent Price: 62.82 Smart Investing & Trading Score: 57 | |
| Day Percent Change: 1.60% Day Change: 0.99 | |
| Week Change: 10.4% Year-to-date Change: -31.5% | |
| ROKU Links: Profile News Message Board | |
| Charts:- Daily , Weekly | |
| Add ROKU to Watchlist: View: Get Complete ROKU Trend Analysis ➞ | |
 | ESTC Elastic N.V. |
| Sector: Technology | |
| SubSector: Application Software | |
| MarketCap: 4420.92 Millions | |
| Recent Price: 104.79 Smart Investing & Trading Score: 57 | |
| Day Percent Change: 1.04% Day Change: 1.08 | |
| Week Change: 8.94% Year-to-date Change: -7.0% | |
| ESTC Links: Profile News Message Board | |
| Charts:- Daily , Weekly | |
| Add ESTC to Watchlist: View: Get Complete ESTC Trend Analysis ➞ | |
 | EXPE Expedia Group, Inc. |
| Sector: Services & Goods | |
| SubSector: Lodging | |
| MarketCap: 8052.96 Millions | |
| Recent Price: 136.25 Smart Investing & Trading Score: 57 | |
| Day Percent Change: 0.33% Day Change: 0.45 | |
| Week Change: 5.62% Year-to-date Change: -10.2% | |
| EXPE Links: Profile News Message Board | |
| Charts:- Daily , Weekly | |
| Add EXPE to Watchlist: View: Get Complete EXPE Trend Analysis ➞ | |
 | AMC AMC Entertainment Holdings, Inc. |
| Sector: Services & Goods | |
| SubSector: Movie Production, Theaters | |
| MarketCap: 415.929 Millions | |
| Recent Price: 3.28 Smart Investing & Trading Score: 57 | |
| Day Percent Change: 0.00% Day Change: 0.00 | |
| Week Change: 3.8% Year-to-date Change: -46.4% | |
| AMC Links: Profile News Message Board | |
| Charts:- Daily , Weekly | |
| Add AMC to Watchlist: View: Get Complete AMC Trend Analysis ➞ | |
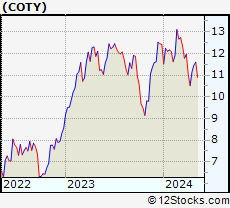 | COTY Coty Inc. |
| Sector: Consumer Staples | |
| SubSector: Personal Products | |
| MarketCap: 4023.65 Millions | |
| Recent Price: 11.42 Smart Investing & Trading Score: 57 | |
| Day Percent Change: -2.39% Day Change: -0.28 | |
| Week Change: 2.42% Year-to-date Change: -8.1% | |
| COTY Links: Profile News Message Board | |
| Charts:- Daily , Weekly | |
| Add COTY to Watchlist: View: Get Complete COTY Trend Analysis ➞ | |
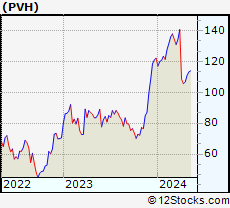 | PVH PVH Corp. |
| Sector: Consumer Staples | |
| SubSector: Textile - Apparel Clothing | |
| MarketCap: 2947.65 Millions | |
| Recent Price: 110.79 Smart Investing & Trading Score: 57 | |
| Day Percent Change: -1.84% Day Change: -2.08 | |
| Week Change: 3.76% Year-to-date Change: -9.3% | |
| PVH Links: Profile News Message Board | |
| Charts:- Daily , Weekly | |
| Add PVH to Watchlist: View: Get Complete PVH Trend Analysis ➞ | |
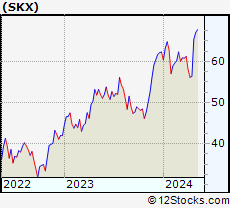 | SKX Skechers U.S.A., Inc. |
| Sector: Consumer Staples | |
| SubSector: Textile - Apparel Footwear & Accessories | |
| MarketCap: 3620.1 Millions | |
| Recent Price: 58.82 Smart Investing & Trading Score: 57 | |
| Day Percent Change: -0.56% Day Change: -0.33 | |
| Week Change: 4.27% Year-to-date Change: -5.7% | |
| SKX Links: Profile News Message Board | |
| Charts:- Daily , Weekly | |
| Add SKX to Watchlist: View: Get Complete SKX Trend Analysis ➞ | |
 | DT Dynatrace, Inc. |
| Sector: Technology | |
| SubSector: Application Software | |
| MarketCap: 7007.12 Millions | |
| Recent Price: 46.60 Smart Investing & Trading Score: 57 | |
| Day Percent Change: -0.30% Day Change: -0.14 | |
| Week Change: 2.64% Year-to-date Change: -14.8% | |
| DT Links: Profile News Message Board | |
| Charts:- Daily , Weekly | |
| Add DT to Watchlist: View: Get Complete DT Trend Analysis ➞ | |
 | CCL Carnival Corporation & Plc |
| Sector: Services & Goods | |
| SubSector: Resorts & Casinos | |
| MarketCap: 11725.4 Millions | |
| Recent Price: 15.18 Smart Investing & Trading Score: 57 | |
| Day Percent Change: 1.13% Day Change: 0.17 | |
| Week Change: 7.51% Year-to-date Change: -18.1% | |
| CCL Links: Profile News Message Board | |
| Charts:- Daily , Weekly | |
| Add CCL to Watchlist: View: Get Complete CCL Trend Analysis ➞ | |
 | CBOE Cboe Global Markets, Inc. |
| Sector: Financials | |
| SubSector: Diversified Investments | |
| MarketCap: 8834.5 Millions | |
| Recent Price: 181.52 Smart Investing & Trading Score: 57 | |
| Day Percent Change: 1.02% Day Change: 1.84 | |
| Week Change: 0.37% Year-to-date Change: 1.7% | |
| CBOE Links: Profile News Message Board | |
| Charts:- Daily , Weekly | |
| Add CBOE to Watchlist: View: Get Complete CBOE Trend Analysis ➞ | |
 | BIIB Biogen Inc. |
| Sector: Health Care | |
| SubSector: Biotechnology | |
| MarketCap: 53102.6 Millions | |
| Recent Price: 202.46 Smart Investing & Trading Score: 57 | |
| Day Percent Change: 0.23% Day Change: 0.47 | |
| Week Change: 4.16% Year-to-date Change: -21.8% | |
| BIIB Links: Profile News Message Board | |
| Charts:- Daily , Weekly | |
| Add BIIB to Watchlist: View: Get Complete BIIB Trend Analysis ➞ | |
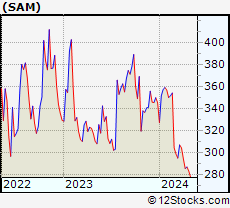 | SAM The Boston Beer Company, Inc. |
| Sector: Consumer Staples | |
| SubSector: Beverages - Brewers | |
| MarketCap: 4063.67 Millions | |
| Recent Price: 287.27 Smart Investing & Trading Score: 57 | |
| Day Percent Change: -2.06% Day Change: -6.03 | |
| Week Change: 0.1% Year-to-date Change: -16.9% | |
| SAM Links: Profile News Message Board | |
| Charts:- Daily , Weekly | |
| Add SAM to Watchlist: View: Get Complete SAM Trend Analysis ➞ | |
 | XEL Xcel Energy Inc. |
| Sector: Utilities | |
| SubSector: Electric Utilities | |
| MarketCap: 28960.8 Millions | |
| Recent Price: 55.01 Smart Investing & Trading Score: 57 | |
| Day Percent Change: -0.58% Day Change: -0.32 | |
| Week Change: 0.53% Year-to-date Change: -11.2% | |
| XEL Links: Profile News Message Board | |
| Charts:- Daily , Weekly | |
| Add XEL to Watchlist: View: Get Complete XEL Trend Analysis ➞ | |
 | PSTG Pure Storage, Inc. |
| Sector: Technology | |
| SubSector: Data Storage Devices | |
| MarketCap: 2993.99 Millions | |
| Recent Price: 52.22 Smart Investing & Trading Score: 56 | |
| Day Percent Change: 3.10% Day Change: 1.57 | |
| Week Change: 5.58% Year-to-date Change: 46.4% | |
| PSTG Links: Profile News Message Board | |
| Charts:- Daily , Weekly | |
| Add PSTG to Watchlist: View: Get Complete PSTG Trend Analysis ➞ | |
 | NU Nu Holdings Ltd. |
| Sector: Financials | |
| SubSector: Banks - Diversified | |
| MarketCap: 37240 Millions | |
| Recent Price: 10.87 Smart Investing & Trading Score: 56 | |
| Day Percent Change: 1.87% Day Change: 0.20 | |
| Week Change: 3.72% Year-to-date Change: 30.3% | |
| NU Links: Profile News Message Board | |
| Charts:- Daily , Weekly | |
| Add NU to Watchlist: View: Get Complete NU Trend Analysis ➞ | |
 | HUBB Hubbell Incorporated |
| Sector: Technology | |
| SubSector: Diversified Electronics | |
| MarketCap: 6002.46 Millions | |
| Recent Price: 402.27 Smart Investing & Trading Score: 56 | |
| Day Percent Change: 0.93% Day Change: 3.72 | |
| Week Change: 3.67% Year-to-date Change: 22.3% | |
| HUBB Links: Profile News Message Board | |
| Charts:- Daily , Weekly | |
| Add HUBB to Watchlist: View: Get Complete HUBB Trend Analysis ➞ | |
| For tabular summary view of above stock list: Summary View ➞ 0 - 25 , 25 - 50 , 50 - 75 , 75 - 100 , 100 - 125 , 125 - 150 , 150 - 175 , 175 - 200 , 200 - 225 , 225 - 250 , 250 - 275 , 275 - 300 , 300 - 325 , 325 - 350 , 350 - 375 , 375 - 400 , 400 - 425 , 425 - 450 , 450 - 475 , 475 - 500 , 500 - 525 , 525 - 550 , 550 - 575 , 575 - 600 , 600 - 625 , 625 - 650 , 650 - 675 , 675 - 700 , 700 - 725 , 725 - 750 , 750 - 775 | ||
| Click To Change The Sort Order: By Market Cap or Company Size Performance: Year-to-date, Week and Day | |
| Select Chart Type: | ||
|
Best Stocks Today 12Stocks.com |
© 2024 12Stocks.com Terms & Conditions Privacy Contact Us
All Information Provided Only For Education And Not To Be Used For Investing or Trading. See Terms & Conditions


One More Thing ... Get Best Stocks Delivered Daily!
Never Ever Miss A Move With Our Top Ten Stocks Lists
Find Best Stocks In Any Market - Bull or Bear Market
Take A Peek At Our Top Ten Stocks Lists: Daily, Weekly, Year-to-Date & Top Trends
Find Best Stocks In Any Market - Bull or Bear Market
Take A Peek At Our Top Ten Stocks Lists: Daily, Weekly, Year-to-Date & Top Trends
Midcap Stocks With Best Up Trends [0-bearish to 100-bullish]: Kirby [100], HashiCorp [100], Ardagh Metal[100], Teradyne [100], Antero Resources[100], Churchill Downs[100], Dover [100], Tractor Supply[100], Virtu Financial[100], EQT [100], Microchip [100]
Best Midcap Stocks Year-to-Date:
Vistra Energy[88.16%], AppLovin [73.92%], ShockWave Medical[72.7%], EMCOR [62.16%], Constellation Energy[60.54%], Spotify [53.81%], Antero Resources[47.22%], Pure Storage[46.44%], Natera [45.72%], Wingstop [44.17%], CAVA [43.95%] Best Midcap Stocks This Week:
HashiCorp [36.92%], Hasbro [17.55%], Kirby [17.07%], Tandem Diabetes[16.86%], Ardagh Metal[14.9%], First Citizens[14.87%], Antero Resources[14%], Tyler Technologies[13.57%], Teradyne [13.48%], Wabtec [13.19%], Globe Life[13.19%] Best Midcap Stocks Daily:
Kirby [10.99%], HashiCorp [10.69%], First Citizens[9.80%], Tyler Technologies[9.32%], Ardagh Metal[8.82%], TransUnion [8.17%], Teradyne [8.15%], Carrier Global[7.19%], Antero Resources[6.20%], CACI [5.93%], United Rentals[5.45%]