
 Login Sign Up


| |||||
 |  | ||||

| 12Stocks.com Market Intelligence |
Best MidCap Stocks
|
| In a hurry? Mid Cap Stocks Lists: Performance Trends Table, Stock Charts
Sort midcap stocks: Daily, Weekly, Year-to-Date, Market Cap & Trends. Filter midcap stocks list by sector: Show all, Tech, Finance, Energy, Staples, Retail, Industrial, Materials, Utilities and HealthCare Filter midcap stocks list by size:All MidCap Large Mid-Range Small |
| 12Stocks.com Mid Cap Stocks Performances & Trends Daily | |||||||||
|
|  The overall Smart Investing & Trading Score is 36 (0-bearish to 100-bullish) which puts Mid Cap index in short term bearish to neutral trend. The Smart Investing & Trading Score from previous trading session is 26 and hence an improvement of trend.
| ||||||||
Here are the Smart Investing & Trading Scores of the most requested mid cap stocks at 12Stocks.com (click stock name for detailed review):
|


| 12Stocks.com: Top Performing Mid Cap Index Stocks | ||||||||||||||||||||||||||||||||||||||||||||||||
 The top performing Mid Cap Index stocks year to date are
Now, more recently, over last week, the top performing Mid Cap Index stocks on the move are


|
||||||||||||||||||||||||||||||||||||||||||||||||
| 12Stocks.com: Investing in Midcap Index with Stocks | |
|
The following table helps investors and traders sort through current performance and trends (as measured by Smart Investing & Trading Score) of various
stocks in the Midcap Index. Quick View: Move mouse or cursor over stock symbol (ticker) to view short-term technical chart and over stock name to view long term chart. Click on  to add stock symbol to your watchlist and to add stock symbol to your watchlist and  to view watchlist. Click on any ticker or stock name for detailed market intelligence report for that stock. to view watchlist. Click on any ticker or stock name for detailed market intelligence report for that stock. |
12Stocks.com Performance of Stocks in Midcap Index
| Ticker | Stock Name | Watchlist | Category | Recent Price | Smart Investing & Trading Score | Change % | YTD Change% |
| WAB | Wabtec |   | Transports | 145.35 | 56 | 0.55% | 14.54% |
| HIG | Hartford Financial | | Financials | 97.26 | 56 | 1.55% | 21.00% |
| NVR | NVR | | Industrials | 7760.00 | 56 | 1.17% | 10.85% |
| PWR | Quanta Services | | Industrials | 247.98 | 56 | 0.82% | 14.91% |
| PH | Parker-Hannifin | | Industrials | 544.36 | 56 | 0.70% | 18.16% |
| CNM | Core & Main | | Industrials | 55.10 | 56 | 0.60% | 35.98% |
| CHK | Chesapeake Energy | | Energy | 87.63 | 56 | 0.55% | 13.89% |
| GRMN | Garmin | | Technology | 141.78 | 56 | 0.50% | 10.30% |
| RBA | Ritchie Bros. | | Services & Goods | 73.48 | 56 | 0.37% | 9.85% |
| CW | Curtiss-Wright | | Industrials | 250.48 | 56 | 0.32% | 12.43% |
| LAMR | Lamar Advertising | | Financials | 110.88 | 56 | 0.22% | 4.33% |
| DCI | Donaldson | | Industrials | 72.04 | 56 | 0.11% | 10.24% |
| CNP | CenterPoint Energy | | Utilities | 27.77 | 55 | 0.25% | -2.80% |
| LNT | Alliant Energy | | Utilities | 48.50 | 55 | 0.17% | -5.46% |
| ATO | Atmos Energy | | Utilities | 114.73 | 55 | 0.15% | -1.01% |
| EBAY | eBay | | Services & Goods | 50.62 | 54 | 2.37% | 16.05% |
| CINF | Cinnati Financial | | Financials | 116.87 | 54 | 1.36% | 12.96% |
| AFG | American Financial | | Financials | 125.85 | 54 | 1.03% | 5.85% |
| ACM | AECOM | | Services & Goods | 93.41 | 54 | 0.95% | 1.06% |
| CSL | Carlisle | | Consumer Staples | 372.07 | 54 | 0.87% | 19.09% |
| ARMK | Aramark | | Services & Goods | 31.34 | 54 | 0.56% | 11.51% |
| KR | Kroger Co | | Services & Goods | 55.56 | 54 | 0.55% | 21.56% |
| CFR | Cullen/Frost Bankers | | Financials | 107.76 | 54 | 0.44% | -0.67% |
| FIS | Fidelity National | | Technology | 70.62 | 54 | 0.38% | 17.56% |
| RJF | Raymond James | | Financials | 122.21 | 54 | 0.22% | 9.61% |
| For chart view version of above stock list: Chart View ➞ 0 - 25 , 25 - 50 , 50 - 75 , 75 - 100 , 100 - 125 , 125 - 150 , 150 - 175 , 175 - 200 , 200 - 225 , 225 - 250 , 250 - 275 , 275 - 300 , 300 - 325 , 325 - 350 , 350 - 375 , 375 - 400 , 400 - 425 , 425 - 450 , 450 - 475 , 475 - 500 , 500 - 525 , 525 - 550 , 550 - 575 , 575 - 600 , 600 - 625 , 625 - 650 , 650 - 675 , 675 - 700 | ||
 | Click To Change The Sort Order: By Market Cap or Company Size Performance: Year-to-date, Week and Day |  |
|
Get the most comprehensive stock market coverage daily at 12Stocks.com ➞ Best Stocks Today ➞ Best Stocks Weekly ➞ Best Stocks Year-to-Date ➞ Best Stocks Trends ➞  Best Stocks Today 12Stocks.com Best Nasdaq Stocks ➞ Best S&P 500 Stocks ➞ Best Tech Stocks ➞ Best Biotech Stocks ➞ |
| Detailed Overview of Midcap Stocks |
| Midcap Technical Overview, Leaders & Laggards, Top Midcap ETF Funds & Detailed Midcap Stocks List, Charts, Trends & More |
| Midcap: Technical Analysis, Trends & YTD Performance | |
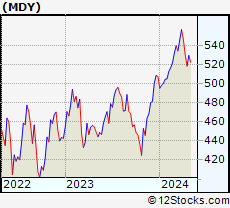
| MidCap segment as represented by
MDY, an exchange-traded fund [ETF], holds basket of about four hundred midcap stocks from across all major sectors of the US stock market. The midcap index (contains stocks like Green Mountain Coffee Roasters and Tractor Supply Company) is up by 2.36% and is currently underperforming the overall market by -2.19% year-to-date. Below is a quick view of technical charts and trends: | |
 MDY Weekly Chart |
|
| Long Term Trend: Good | |
| Medium Term Trend: Not Good | |
 MDY Daily Chart |
|
| Short Term Trend: Deteriorating | |
| Overall Trend Score: 36 | |
| YTD Performance: 2.36% | |
| **Trend Scores & Views Are Only For Educational Purposes And Not For Investing | |
| 12Stocks.com: Investing in Midcap Index using Exchange Traded Funds | |
|
The following table shows list of key exchange traded funds (ETF) that
help investors track Midcap index. The following list also includes leveraged ETF funds that track twice or thrice the daily returns of Midcap indices. Short or inverse ETF funds move in the opposite direction to the index they track and are useful during market pullbacks or during bear markets. Quick View: Move mouse or cursor over ETF symbol (ticker) to view short-term technical chart and over ETF name to view long term chart. Click on ticker or stock name for detailed view. Click on to add stock symbol to your watchlist and to view watchlist. |
12Stocks.com List of ETFs that track Midcap Index
| Ticker | ETF Name | Watchlist | Recent Price | Smart Investing & Trading Score | Change % | Week % | Year-to-date % |
| IJH | iShares Core S&P Mid-Cap | | 56.74 | 26 | 0.42 | -1.98 | 2.37% |
| IWR | iShares Russell Mid-Cap | | 78.86 | 33 | 0.05 | -2.18 | 1.45% |
| MDY | SPDR S&P MidCap 400 ETF | | 519.34 | 36 | 0.40 | -2 | 2.36% |
| IWP | iShares Russell Mid-Cap Growth | | 106.89 | 26 | -0.12 | -2.69 | 2.33% |
| IWS | iShares Russell Mid-Cap Value | | 117.38 | 38 | -0.03 | -2.09 | 0.94% |
| IJK | iShares S&P Mid-Cap 400 Growth | | 85.47 | 31 | 0.15 | -2.3 | 7.89% |
| UMDD | ProShares UltraPro MidCap400 | | 22.43 | 36 | -0.08 | -7.2 | 0.5% |
| IJJ | iShares S&P Mid-Cap 400 Value | | 109.66 | 0 | 0.20 | -2.09 | -3.85% |
| SMDD | ProShares UltraPro Short MidCap400 | | 12.58 | 52 | 0.32 | 7.06 | -6.56% |
| XMLV | PowerShares S&P MidCap Low Volatil ETF | | 53.53 | 36 | 0.30 | -1.33 | 0.66% |
| MYY | ProShares Short MidCap400 | | 21.22 | 69 | 0.05 | 2.5 | -1.09% |
| MZZ | ProShares UltraShort MidCap400 | | 12.17 | 34 | 0.87 | 4.91 | -3.19% |
| 12Stocks.com: Charts, Trends, Fundamental Data and Performances of MidCap Stocks | |
|
We now take in-depth look at all MidCap stocks including charts, multi-period performances and overall trends (as measured by Smart Investing & Trading Score). One can sort MidCap stocks (click link to choose) by Daily, Weekly and by Year-to-Date performances. Also, one can sort by size of the company or by market capitalization. |
| Select Your Default Chart Type: | |||||
| |||||
| Click on stock symbol or name for detailed view. Click on to add stock symbol to your watchlist and to view watchlist. Quick View: Move mouse or cursor over "Daily" to quickly view daily technical stock chart and over "Weekly" to view weekly technical stock chart. | |||||

 | WAB Wabtec Corporation |
| Sector: Transports | |
| SubSector: Railroads | |
| MarketCap: 8230.22 Millions | |
| Recent Price: 145.35 Smart Investing & Trading Score: 56 | |
| Day Percent Change: 0.55% Day Change: 0.80 | |
| Week Change: -0.57% Year-to-date Change: 14.5% | |
| WAB Links: Profile News Message Board | |
| Charts:- Daily , Weekly | |
| Add WAB to Watchlist: View: Get Complete WAB Trend Analysis ➞ | |
 | HIG The Hartford Financial Services Group, Inc. |
| Sector: Financials | |
| SubSector: Property & Casualty Insurance | |
| MarketCap: 12582.8 Millions | |
| Recent Price: 97.26 Smart Investing & Trading Score: 56 | |
| Day Percent Change: 1.55% Day Change: 1.48 | |
| Week Change: -0.53% Year-to-date Change: 21.0% | |
| HIG Links: Profile News Message Board | |
| Charts:- Daily , Weekly | |
| Add HIG to Watchlist: View: Get Complete HIG Trend Analysis ➞ | |
 | NVR NVR, Inc. |
| Sector: Industrials | |
| SubSector: Residential Construction | |
| MarketCap: 9912.56 Millions | |
| Recent Price: 7760.00 Smart Investing & Trading Score: 56 | |
| Day Percent Change: 1.17% Day Change: 90.06 | |
| Week Change: -0.74% Year-to-date Change: 10.9% | |
| NVR Links: Profile News Message Board | |
| Charts:- Daily , Weekly | |
| Add NVR to Watchlist: View: Get Complete NVR Trend Analysis ➞ | |
 | PWR Quanta Services, Inc. |
| Sector: Industrials | |
| SubSector: General Contractors | |
| MarketCap: 3936.63 Millions | |
| Recent Price: 247.98 Smart Investing & Trading Score: 56 | |
| Day Percent Change: 0.82% Day Change: 2.02 | |
| Week Change: -2.63% Year-to-date Change: 14.9% | |
| PWR Links: Profile News Message Board | |
| Charts:- Daily , Weekly | |
| Add PWR to Watchlist: View: Get Complete PWR Trend Analysis ➞ | |
 | PH Parker-Hannifin Corporation |
| Sector: Industrials | |
| SubSector: Industrial Equipment & Components | |
| MarketCap: 14888.9 Millions | |
| Recent Price: 544.36 Smart Investing & Trading Score: 56 | |
| Day Percent Change: 0.70% Day Change: 3.78 | |
| Week Change: -1.08% Year-to-date Change: 18.2% | |
| PH Links: Profile News Message Board | |
| Charts:- Daily , Weekly | |
| Add PH to Watchlist: View: Get Complete PH Trend Analysis ➞ | |
 | CNM Core & Main, Inc. |
| Sector: Industrials | |
| SubSector: Industrial Distribution | |
| MarketCap: 7150 Millions | |
| Recent Price: 55.10 Smart Investing & Trading Score: 56 | |
| Day Percent Change: 0.60% Day Change: 0.33 | |
| Week Change: -2.2% Year-to-date Change: 36.0% | |
| CNM Links: Profile News Message Board | |
| Charts:- Daily , Weekly | |
| Add CNM to Watchlist: View: Get Complete CNM Trend Analysis ➞ | |
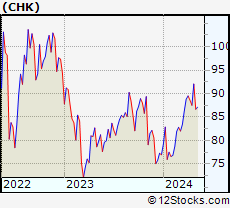 | CHK Chesapeake Energy Corporation |
| Sector: Energy | |
| SubSector: Oil & Gas E&P | |
| MarketCap: 10840 Millions | |
| Recent Price: 87.63 Smart Investing & Trading Score: 56 | |
| Day Percent Change: 0.55% Day Change: 0.48 | |
| Week Change: -1.08% Year-to-date Change: 13.9% | |
| CHK Links: Profile News Message Board | |
| Charts:- Daily , Weekly | |
| Add CHK to Watchlist: View: Get Complete CHK Trend Analysis ➞ | |
 | GRMN Garmin Ltd. |
| Sector: Technology | |
| SubSector: Scientific & Technical Instruments | |
| MarketCap: 13909.3 Millions | |
| Recent Price: 141.78 Smart Investing & Trading Score: 56 | |
| Day Percent Change: 0.50% Day Change: 0.71 | |
| Week Change: -0.93% Year-to-date Change: 10.3% | |
| GRMN Links: Profile News Message Board | |
| Charts:- Daily , Weekly | |
| Add GRMN to Watchlist: View: Get Complete GRMN Trend Analysis ➞ | |
 | RBA Ritchie Bros. Auctioneers Incorporated |
| Sector: Services & Goods | |
| SubSector: Business Services | |
| MarketCap: 3491.02 Millions | |
| Recent Price: 73.48 Smart Investing & Trading Score: 56 | |
| Day Percent Change: 0.37% Day Change: 0.27 | |
| Week Change: 0.22% Year-to-date Change: 9.9% | |
| RBA Links: Profile News Message Board | |
| Charts:- Daily , Weekly | |
| Add RBA to Watchlist: View: Get Complete RBA Trend Analysis ➞ | |
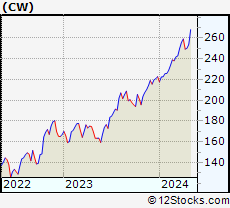 | CW Curtiss-Wright Corporation |
| Sector: Industrials | |
| SubSector: Diversified Machinery | |
| MarketCap: 4057.56 Millions | |
| Recent Price: 250.48 Smart Investing & Trading Score: 56 | |
| Day Percent Change: 0.32% Day Change: 0.81 | |
| Week Change: 0.43% Year-to-date Change: 12.4% | |
| CW Links: Profile News Message Board | |
| Charts:- Daily , Weekly | |
| Add CW to Watchlist: View: Get Complete CW Trend Analysis ➞ | |
 | LAMR Lamar Advertising Company (REIT) |
| Sector: Financials | |
| SubSector: REIT - Diversified | |
| MarketCap: 4838.33 Millions | |
| Recent Price: 110.88 Smart Investing & Trading Score: 56 | |
| Day Percent Change: 0.22% Day Change: 0.24 | |
| Week Change: -0.71% Year-to-date Change: 4.3% | |
| LAMR Links: Profile News Message Board | |
| Charts:- Daily , Weekly | |
| Add LAMR to Watchlist: View: Get Complete LAMR Trend Analysis ➞ | |
 | DCI Donaldson Company, Inc. |
| Sector: Industrials | |
| SubSector: Diversified Machinery | |
| MarketCap: 4993.46 Millions | |
| Recent Price: 72.04 Smart Investing & Trading Score: 56 | |
| Day Percent Change: 0.11% Day Change: 0.08 | |
| Week Change: -1.95% Year-to-date Change: 10.2% | |
| DCI Links: Profile News Message Board | |
| Charts:- Daily , Weekly | |
| Add DCI to Watchlist: View: Get Complete DCI Trend Analysis ➞ | |
 | CNP CenterPoint Energy, Inc. |
| Sector: Utilities | |
| SubSector: Gas Utilities | |
| MarketCap: 7444.07 Millions | |
| Recent Price: 27.77 Smart Investing & Trading Score: 55 | |
| Day Percent Change: 0.25% Day Change: 0.07 | |
| Week Change: 1.13% Year-to-date Change: -2.8% | |
| CNP Links: Profile News Message Board | |
| Charts:- Daily , Weekly | |
| Add CNP to Watchlist: View: Get Complete CNP Trend Analysis ➞ | |
 | LNT Alliant Energy Corporation |
| Sector: Utilities | |
| SubSector: Electric Utilities | |
| MarketCap: 10678.4 Millions | |
| Recent Price: 48.50 Smart Investing & Trading Score: 55 | |
| Day Percent Change: 0.17% Day Change: 0.08 | |
| Week Change: 1.04% Year-to-date Change: -5.5% | |
| LNT Links: Profile News Message Board | |
| Charts:- Daily , Weekly | |
| Add LNT to Watchlist: View: Get Complete LNT Trend Analysis ➞ | |
 | ATO Atmos Energy Corporation |
| Sector: Utilities | |
| SubSector: Gas Utilities | |
| MarketCap: 11449 Millions | |
| Recent Price: 114.73 Smart Investing & Trading Score: 55 | |
| Day Percent Change: 0.15% Day Change: 0.17 | |
| Week Change: 0.65% Year-to-date Change: -1.0% | |
| ATO Links: Profile News Message Board | |
| Charts:- Daily , Weekly | |
| Add ATO to Watchlist: View: Get Complete ATO Trend Analysis ➞ | |
 | EBAY eBay Inc. |
| Sector: Services & Goods | |
| SubSector: Specialty Retail, Other | |
| MarketCap: 23152.3 Millions | |
| Recent Price: 50.62 Smart Investing & Trading Score: 54 | |
| Day Percent Change: 2.37% Day Change: 1.17 | |
| Week Change: -1.34% Year-to-date Change: 16.1% | |
| EBAY Links: Profile News Message Board | |
| Charts:- Daily , Weekly | |
| Add EBAY to Watchlist: View: Get Complete EBAY Trend Analysis ➞ | |
 | CINF Cincinnati Financial Corporation |
| Sector: Financials | |
| SubSector: Property & Casualty Insurance | |
| MarketCap: 13637 Millions | |
| Recent Price: 116.87 Smart Investing & Trading Score: 54 | |
| Day Percent Change: 1.36% Day Change: 1.57 | |
| Week Change: -1.48% Year-to-date Change: 13.0% | |
| CINF Links: Profile News Message Board | |
| Charts:- Daily , Weekly | |
| Add CINF to Watchlist: View: Get Complete CINF Trend Analysis ➞ | |
 | AFG American Financial Group, Inc. |
| Sector: Financials | |
| SubSector: Property & Casualty Insurance | |
| MarketCap: 5353.82 Millions | |
| Recent Price: 125.85 Smart Investing & Trading Score: 54 | |
| Day Percent Change: 1.03% Day Change: 1.28 | |
| Week Change: -1.15% Year-to-date Change: 5.9% | |
| AFG Links: Profile News Message Board | |
| Charts:- Daily , Weekly | |
| Add AFG to Watchlist: View: Get Complete AFG Trend Analysis ➞ | |
 | ACM AECOM |
| Sector: Services & Goods | |
| SubSector: Technical Services | |
| MarketCap: 4781.9 Millions | |
| Recent Price: 93.41 Smart Investing & Trading Score: 54 | |
| Day Percent Change: 0.95% Day Change: 0.88 | |
| Week Change: -0.21% Year-to-date Change: 1.1% | |
| ACM Links: Profile News Message Board | |
| Charts:- Daily , Weekly | |
| Add ACM to Watchlist: View: Get Complete ACM Trend Analysis ➞ | |
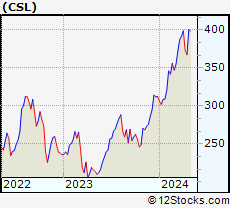 | CSL Carlisle Companies Incorporated |
| Sector: Consumer Staples | |
| SubSector: Rubber & Plastics | |
| MarketCap: 6542.7 Millions | |
| Recent Price: 372.07 Smart Investing & Trading Score: 54 | |
| Day Percent Change: 0.87% Day Change: 3.23 | |
| Week Change: -0.29% Year-to-date Change: 19.1% | |
| CSL Links: Profile News Message Board | |
| Charts:- Daily , Weekly | |
| Add CSL to Watchlist: View: Get Complete CSL Trend Analysis ➞ | |
 | ARMK Aramark |
| Sector: Services & Goods | |
| SubSector: Specialty Eateries | |
| MarketCap: 5242.27 Millions | |
| Recent Price: 31.34 Smart Investing & Trading Score: 54 | |
| Day Percent Change: 0.56% Day Change: 0.18 | |
| Week Change: -0.81% Year-to-date Change: 11.5% | |
| ARMK Links: Profile News Message Board | |
| Charts:- Daily , Weekly | |
| Add ARMK to Watchlist: View: Get Complete ARMK Trend Analysis ➞ | |
 | KR The Kroger Co. |
| Sector: Services & Goods | |
| SubSector: Grocery Stores | |
| MarketCap: 26718.5 Millions | |
| Recent Price: 55.56 Smart Investing & Trading Score: 54 | |
| Day Percent Change: 0.55% Day Change: 0.30 | |
| Week Change: 0.66% Year-to-date Change: 21.6% | |
| KR Links: Profile News Message Board | |
| Charts:- Daily , Weekly | |
| Add KR to Watchlist: View: Get Complete KR Trend Analysis ➞ | |
 | CFR Cullen/Frost Bankers, Inc. |
| Sector: Financials | |
| SubSector: Regional - Southwest Banks | |
| MarketCap: 3536.75 Millions | |
| Recent Price: 107.76 Smart Investing & Trading Score: 54 | |
| Day Percent Change: 0.44% Day Change: 0.47 | |
| Week Change: -0.23% Year-to-date Change: -0.7% | |
| CFR Links: Profile News Message Board | |
| Charts:- Daily , Weekly | |
| Add CFR to Watchlist: View: Get Complete CFR Trend Analysis ➞ | |
 | FIS Fidelity National Information Services, Inc. |
| Sector: Technology | |
| SubSector: Information Technology Services | |
| MarketCap: 71126.8 Millions | |
| Recent Price: 70.62 Smart Investing & Trading Score: 54 | |
| Day Percent Change: 0.38% Day Change: 0.27 | |
| Week Change: -0.47% Year-to-date Change: 17.6% | |
| FIS Links: Profile News Message Board | |
| Charts:- Daily , Weekly | |
| Add FIS to Watchlist: View: Get Complete FIS Trend Analysis ➞ | |
 | RJF Raymond James Financial, Inc. |
| Sector: Financials | |
| SubSector: Investment Brokerage - Regional | |
| MarketCap: 9490.65 Millions | |
| Recent Price: 122.21 Smart Investing & Trading Score: 54 | |
| Day Percent Change: 0.22% Day Change: 0.27 | |
| Week Change: -0.28% Year-to-date Change: 9.6% | |
| RJF Links: Profile News Message Board | |
| Charts:- Daily , Weekly | |
| Add RJF to Watchlist: View: Get Complete RJF Trend Analysis ➞ | |
| For tabular summary view of above stock list: Summary View ➞ 0 - 25 , 25 - 50 , 50 - 75 , 75 - 100 , 100 - 125 , 125 - 150 , 150 - 175 , 175 - 200 , 200 - 225 , 225 - 250 , 250 - 275 , 275 - 300 , 300 - 325 , 325 - 350 , 350 - 375 , 375 - 400 , 400 - 425 , 425 - 450 , 450 - 475 , 475 - 500 , 500 - 525 , 525 - 550 , 550 - 575 , 575 - 600 , 600 - 625 , 625 - 650 , 650 - 675 , 675 - 700 | ||
| Click To Change The Sort Order: By Market Cap or Company Size Performance: Year-to-date, Week and Day | |
| Select Chart Type: | ||
|
Best Stocks Today 12Stocks.com |
© 2024 12Stocks.com Terms & Conditions Privacy Contact Us
All Information Provided Only For Education And Not To Be Used For Investing or Trading. See Terms & Conditions


One More Thing ... Get Best Stocks Delivered Daily!
Never Ever Miss A Move With Our Top Ten Stocks Lists
Find Best Stocks In Any Market - Bull or Bear Market
Take A Peek At Our Top Ten Stocks Lists: Daily, Weekly, Year-to-Date & Top Trends
Find Best Stocks In Any Market - Bull or Bear Market
Take A Peek At Our Top Ten Stocks Lists: Daily, Weekly, Year-to-Date & Top Trends
Midcap Stocks With Best Up Trends [0-bearish to 100-bullish]: Genuine Parts[100], Alaska Air[100], United Airlines[100], Medical Properties[100], HEICO [100], Conagra [95], Delta Air[93], Royal Gold[93], Bunge [93], Coupang [90], United [88]
Best Midcap Stocks Year-to-Date:
AppLovin [75.68%], Constellation Energy[58.15%], EMCOR [57.23%], Pure Storage[45.32%], Natera [43.1%], Williams-Sonoma [41.57%], NRG Energy[40.48%], Wingstop [40.39%], CAVA [40.2%], Allison Transmission[37.71%], Coupang [37.04%] Best Midcap Stocks This Week:
United Airlines[22.18%], Medical Properties[21.3%], Iridium [11.96%], Genuine Parts[9.13%], Alaska Air[8.43%], American Airlines[7.91%], Advance Auto[6.6%], Southwest Airlines[5.68%], Cable One[5.61%], Ally Financial[4.97%], AMC Entertainment[4.91%] Best Midcap Stocks Daily:
Iridium [11.78%], Genuine Parts[10.13%], Ally Financial[7.75%], Manpower [6.37%], Alaska Air[4.82%], United Airlines[4.78%], Cable One[3.78%], Allstate [3.53%], Hawaiian Electric[3.33%], CF Industries[3.15%], Olaplex [3.09%]