
 Login Sign Up


| |||||
 |  | ||||

| 12Stocks.com Market Intelligence |
Best Healthcare Stocks
 | "Discover best trending healthcare stocks with 12Stocks.com." |
| - Subu Vdaygiri, Founder, 12Stocks.com |
| In a hurry? Healthcare Stocks Lists: Performance Trends Table, Stock Charts
Sort Healthcare stocks: Daily, Weekly, Year-to-Date, Market Cap & Trends. Filter Healthcare stocks list by size:All Healthcare Large Mid-Range Small |
| 12Stocks.com Healthcare Stocks Performances & Trends Daily | |||||||||
|
|  The overall Smart Investing & Trading Score is 83 (0-bearish to 100-bullish) which puts Healthcare sector in short term bullish trend. The Smart Investing & Trading Score from previous trading session is 88 and a deterioration of trend continues.
| ||||||||
Here are the Smart Investing & Trading Scores of the most requested Healthcare stocks at 12Stocks.com (click stock name for detailed review):
|


| 12Stocks.com: Investing in Healthcare sector with Stocks | |
|
The following table helps investors and traders sort through current performance and trends (as measured by Smart Investing & Trading Score) of various
stocks in the Healthcare sector. Quick View: Move mouse or cursor over stock symbol (ticker) to view short-term Technical chart and over stock name to view long term chart. Click on  to add stock symbol to your watchlist and to add stock symbol to your watchlist and  to view watchlist. Click on any ticker or stock name for detailed market intelligence report for that stock. to view watchlist. Click on any ticker or stock name for detailed market intelligence report for that stock. |
12Stocks.com Performance of Stocks in Healthcare Sector
| Ticker | Stock Name | Watchlist | Category | Recent Price | Smart Investing & Trading Score | Change % | YTD Change% |
| AVTE | Aerovate |   | Biotechnology | 20.36 | 12 | 0.94% | -9.79% |
| INBX | Inhibrx | | Biotechnology | 34.26 | 25 | -0.59% | -9.88% |
| CMPS | COMPASS Pathways | | Medical Care Facilities | 7.85 | 17 | -0.88% | -10.18% |
| TCMD | Tactile Systems | | Instruments | 12.84 | 0 | -5.93% | -10.21% |
| BIO | Bio-Rad | | Laboratories | 289.45 | 42 | -0.83% | -10.36% |
| VMD | Viemed | | Equipment | 7.01 | 10 | -1.27% | -10.70% |
| CLPT | ClearPoint Neuro | | Equipment | 6.08 | 35 | -0.82% | -10.79% |
| AXGN | AxoGen | | Equipment | 6.09 | 57 | -1.77% | -10.83% |
| BAX | Baxter | | Instruments | 34.45 | 10 | -1.63% | -10.89% |
| IPSC | Century | | Biotechnology | 2.94 | 15 | -2.00% | -10.91% |
| CORT | Corcept | | Biotechnology | 28.80 | 90 | -0.28% | -11.33% |
| URGN | UroGen Pharma | | Biotechnology | 13.25 | 28 | 2.63% | -11.67% |
| GLTO | Galecto | | Biotechnology | 0.64 | 20 | 0.00% | -11.68% |
| PSTX | Poseida | | Biotechnology | 2.96 | 37 | -6.17% | -11.89% |
| BIIB | Biogen | | Biotechnology | 227.69 | 68 | -1.68% | -12.01% |
| ALKS | Alkermes | | Biotechnology | 24.34 | 52 | -0.16% | -12.26% |
| EHAB | Enhabit | | Medical Care Facilities | 9.08 | 55 | 1.45% | -12.27% |
| CALT | Calliditas | | Drug Manufacturers Specialty & Generic | 22.50 | 90 | 2.27% | -12.35% |
| EXEL | Exelixis | | Biotechnology | 21.02 | 10 | -0.19% | -12.38% |
| ZTS | Zoetis | | Pharmaceutical | 172.79 | 47 | -0.92% | -12.45% |
| MIRM | Mirum | | Biotechnology | 25.83 | 42 | 2.09% | -12.50% |
| CRSP | CRISPR | | Biotechnology | 54.76 | 17 | -1.28% | -12.52% |
| RFL | Rafael | | Biotechnology | 1.60 | 15 | -0.62% | -12.57% |
| PRME | Prime Medicine | | Biotechnology | 7.96 | 69 | 5.71% | -12.72% |
| BNTX | BioNTech SE | | Biotechnology | 92.07 | 54 | -0.43% | -12.76% |
| For chart view version of above stock list: Chart View ➞ 0 - 25 , 25 - 50 , 50 - 75 , 75 - 100 , 100 - 125 , 125 - 150 , 150 - 175 , 175 - 200 , 200 - 225 , 225 - 250 , 250 - 275 , 275 - 300 , 300 - 325 , 325 - 350 , 350 - 375 , 375 - 400 , 400 - 425 , 425 - 450 , 450 - 475 , 475 - 500 , 500 - 525 , 525 - 550 , 550 - 575 , 575 - 600 , 600 - 625 , 625 - 650 , 650 - 675 , 675 - 700 , 700 - 725 | ||
 | Click To Change The Sort Order: By Market Cap or Company Size Performance: Year-to-date, Week and Day |  |
|
Get the most comprehensive stock market coverage daily at 12Stocks.com ➞ Best Stocks Today ➞ Best Stocks Weekly ➞ Best Stocks Year-to-Date ➞ Best Stocks Trends ➞  Best Stocks Today 12Stocks.com Best Nasdaq Stocks ➞ Best S&P 500 Stocks ➞ Best Tech Stocks ➞ Best Biotech Stocks ➞ |
| Detailed Overview of Healthcare Stocks |
| Healthcare Technical Overview, Leaders & Laggards, Top Healthcare ETF Funds & Detailed Healthcare Stocks List, Charts, Trends & More |
| Healthcare Sector: Technical Analysis, Trends & YTD Performance | |
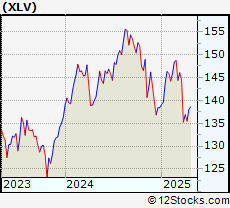
| Healthcare sector is composed of stocks
from pharmaceutical, biotech, diagnostics labs, insurance providers
and healthcare services. Healthcare sector, as represented by XLV, an exchange-traded fund [ETF] that holds basket of Healthcare stocks (e.g, Merck, Amgen) is up by 7.24% and is currently underperforming the overall market by -3.67% year-to-date. Below is a quick view of Technical charts and trends: |
|
 XLV Weekly Chart |
|
| Long Term Trend: Very Good | |
| Medium Term Trend: Very Good | |
 XLV Daily Chart |
|
| Short Term Trend: Good | |
| Overall Trend Score: 83 | |
| YTD Performance: 7.24% | |
| **Trend Scores & Views Are Only For Educational Purposes And Not For Investing | |
| 12Stocks.com: Top Performing Healthcare Sector Stocks | ||||||||||||||||||||||||||||||||||||||||||||||||
 The top performing Healthcare sector stocks year to date are
Now, more recently, over last week, the top performing Healthcare sector stocks on the move are


|
||||||||||||||||||||||||||||||||||||||||||||||||
| 12Stocks.com: Investing in Healthcare Sector using Exchange Traded Funds | |
|
The following table shows list of key exchange traded funds (ETF) that
help investors track Healthcare Index. For detailed view, check out our ETF Funds section of our website. Quick View: Move mouse or cursor over ETF symbol (ticker) to view short-term Technical chart and over ETF name to view long term chart. Click on ticker or stock name for detailed view. Click on to add stock symbol to your watchlist and to view watchlist. |
12Stocks.com List of ETFs that track Healthcare Index
| Ticker | ETF Name | Watchlist | Recent Price | Smart Investing & Trading Score | Change % | Week % | Year-to-date % |
| XLV | Health Care | | 146.25 | 83 | 0.17 | -0.04 | 7.24% |
| XBI | Biotech | | 91.57 | 45 | -0.76 | 0.43 | 2.55% |
| IBB | Biotechnology | | 136.91 | 63 | -0.44 | 0.16 | 0.78% |
| BBH | Biotech | | 168.15 | 83 | -0.26 | 0.1 | 1.72% |
| VHT | Health Care | | 266.91 | 67 | 0.02 | -0.07 | 6.47% |
| IYH | Healthcare | | 61.39 | 62 | 0.24 | 0.08 | 7.24% |
| IHF | Healthcare Providers | | 53.71 | 76 | 0.32 | -0.37 | 2.29% |
| IHI | Medical Devices | | 56.36 | 30 | -0.16 | -0.58 | 4.43% |
| BIB | Biotechnology | | 57.47 | 63 | -0.73 | 0.9 | 0.74% |
| BIS | Short Biotech | | 17.59 | 45 | 1.47 | -0.03 | -2.68% |
| XHE | Health Care Equipment | | 86.97 | 61 | -0.61 | -0.55 | 3.22% |
| CURE | Healthcare Bull 3X | | 118.89 | 70 | 0.55 | -0.18 | 16.86% |
| LABU | Biotech Bull 3X | | 113.12 | 32 | -2.31 | 1.19 | -7.26% |
| LABD | Biotech Bear 3X | | 7.83 | 61 | 2.09 | -1.51 | -19.2% |
| PSCH | SmallCap Health Care | | 43.31 | 64 | -0.31 | -0.19 | 1.2% |
| XHS | Health Care Services | | 91.28 | 76 | -0.65 | -0.29 | 2.62% |
| PTH | DWA Healthcare Momentum | | 42.76 | 43 | -0.81 | 0.3 | 9.25% |
| BTEC | Principal Healthcare Innovators | | 36.49 | 30 | -1.23 | 0.02 | 0.43% |
| RXL | Health Care | | 103.09 | 83 | 0.19 | 0.32 | 12.79% |
| RXD | Short Health Care | | 10.57 | 25 | 0.00 | 0.07 | -11.36% |
| 12Stocks.com: Charts, Trends, Fundamental Data and Performances of Healthcare Stocks | |
|
We now take in-depth look at all Healthcare stocks including charts, multi-period performances and overall trends (as measured by Smart Investing & Trading Score). One can sort Healthcare stocks (click link to choose) by Daily, Weekly and by Year-to-Date performances. Also, one can sort by size of the company or by market capitalization. |
| Select Your Default Chart Type: | |||||
| |||||
| Click on stock symbol or name for detailed view. Click on to add stock symbol to your watchlist and to view watchlist. Quick View: Move mouse or cursor over "Daily" to quickly view daily Technical stock chart and over "Weekly" to view weekly Technical stock chart. | |||||

 | AVTE Aerovate Therapeutics, Inc. |
| Sector: Health Care | |
| SubSector: Biotechnology | |
| MarketCap: 478 Millions | |
| Recent Price: 20.36 Smart Investing & Trading Score: 12 | |
| Day Percent Change: 0.94% Day Change: 0.19 | |
| Week Change: -1.02% Year-to-date Change: -9.8% | |
| AVTE Links: Profile News Message Board | |
| Charts:- Daily , Weekly | |
| Add AVTE to Watchlist: View: Get Complete AVTE Trend Analysis ➞ | |
 | INBX Inhibrx, Inc. |
| Sector: Health Care | |
| SubSector: Biotechnology | |
| MarketCap: 14187 Millions | |
| Recent Price: 34.26 Smart Investing & Trading Score: 25 | |
| Day Percent Change: -0.59% Day Change: -0.20 | |
| Week Change: -1.28% Year-to-date Change: -9.9% | |
| INBX Links: Profile News Message Board | |
| Charts:- Daily , Weekly | |
| Add INBX to Watchlist: View: Get Complete INBX Trend Analysis ➞ | |
 | CMPS COMPASS Pathways plc |
| Sector: Health Care | |
| SubSector: Medical Care Facilities | |
| MarketCap: 19587 Millions | |
| Recent Price: 7.85 Smart Investing & Trading Score: 17 | |
| Day Percent Change: -0.88% Day Change: -0.07 | |
| Week Change: 0.13% Year-to-date Change: -10.2% | |
| CMPS Links: Profile News Message Board | |
| Charts:- Daily , Weekly | |
| Add CMPS to Watchlist: View: Get Complete CMPS Trend Analysis ➞ | |
 | TCMD Tactile Systems Technology, Inc. |
| Sector: Health Care | |
| SubSector: Medical Instruments & Supplies | |
| MarketCap: 655.96 Millions | |
| Recent Price: 12.84 Smart Investing & Trading Score: 0 | |
| Day Percent Change: -5.93% Day Change: -0.81 | |
| Week Change: -6.48% Year-to-date Change: -10.2% | |
| TCMD Links: Profile News Message Board | |
| Charts:- Daily , Weekly | |
| Add TCMD to Watchlist: View: Get Complete TCMD Trend Analysis ➞ | |
 | BIO Bio-Rad Laboratories, Inc. |
| Sector: Health Care | |
| SubSector: Medical Laboratories & Research | |
| MarketCap: 10660 Millions | |
| Recent Price: 289.45 Smart Investing & Trading Score: 42 | |
| Day Percent Change: -0.83% Day Change: -2.43 | |
| Week Change: -1.5% Year-to-date Change: -10.4% | |
| BIO Links: Profile News Message Board | |
| Charts:- Daily , Weekly | |
| Add BIO to Watchlist: View: Get Complete BIO Trend Analysis ➞ | |
 | VMD Viemed Healthcare, Inc. |
| Sector: Health Care | |
| SubSector: Medical Appliances & Equipment | |
| MarketCap: 177.28 Millions | |
| Recent Price: 7.01 Smart Investing & Trading Score: 10 | |
| Day Percent Change: -1.27% Day Change: -0.09 | |
| Week Change: -1.41% Year-to-date Change: -10.7% | |
| VMD Links: Profile News Message Board | |
| Charts:- Daily , Weekly | |
| Add VMD to Watchlist: View: Get Complete VMD Trend Analysis ➞ | |
 | CLPT ClearPoint Neuro, Inc. |
| Sector: Health Care | |
| SubSector: Medical Appliances & Equipment | |
| MarketCap: 55.108 Millions | |
| Recent Price: 6.08 Smart Investing & Trading Score: 35 | |
| Day Percent Change: -0.82% Day Change: -0.05 | |
| Week Change: -1.94% Year-to-date Change: -10.8% | |
| CLPT Links: Profile News Message Board | |
| Charts:- Daily , Weekly | |
| Add CLPT to Watchlist: View: Get Complete CLPT Trend Analysis ➞ | |
 | AXGN AxoGen, Inc. |
| Sector: Health Care | |
| SubSector: Medical Appliances & Equipment | |
| MarketCap: 349.28 Millions | |
| Recent Price: 6.09 Smart Investing & Trading Score: 57 | |
| Day Percent Change: -1.77% Day Change: -0.11 | |
| Week Change: 0.83% Year-to-date Change: -10.8% | |
| AXGN Links: Profile News Message Board | |
| Charts:- Daily , Weekly | |
| Add AXGN to Watchlist: View: Get Complete AXGN Trend Analysis ➞ | |
 | BAX Baxter International Inc. |
| Sector: Health Care | |
| SubSector: Medical Instruments & Supplies | |
| MarketCap: 39955.8 Millions | |
| Recent Price: 34.45 Smart Investing & Trading Score: 10 | |
| Day Percent Change: -1.63% Day Change: -0.57 | |
| Week Change: -2.27% Year-to-date Change: -10.9% | |
| BAX Links: Profile News Message Board | |
| Charts:- Daily , Weekly | |
| Add BAX to Watchlist: View: Get Complete BAX Trend Analysis ➞ | |
 | IPSC Century Therapeutics, Inc. |
| Sector: Health Care | |
| SubSector: Biotechnology | |
| MarketCap: 187 Millions | |
| Recent Price: 2.94 Smart Investing & Trading Score: 15 | |
| Day Percent Change: -2.00% Day Change: -0.06 | |
| Week Change: -2.33% Year-to-date Change: -10.9% | |
| IPSC Links: Profile News Message Board | |
| Charts:- Daily , Weekly | |
| Add IPSC to Watchlist: View: Get Complete IPSC Trend Analysis ➞ | |
 | CORT Corcept Therapeutics Incorporated |
| Sector: Health Care | |
| SubSector: Biotechnology | |
| MarketCap: 1228.45 Millions | |
| Recent Price: 28.80 Smart Investing & Trading Score: 90 | |
| Day Percent Change: -0.28% Day Change: -0.08 | |
| Week Change: 2.53% Year-to-date Change: -11.3% | |
| CORT Links: Profile News Message Board | |
| Charts:- Daily , Weekly | |
| Add CORT to Watchlist: View: Get Complete CORT Trend Analysis ➞ | |
 | URGN UroGen Pharma Ltd. |
| Sector: Health Care | |
| SubSector: Biotechnology | |
| MarketCap: 373.485 Millions | |
| Recent Price: 13.25 Smart Investing & Trading Score: 28 | |
| Day Percent Change: 2.63% Day Change: 0.34 | |
| Week Change: 0.23% Year-to-date Change: -11.7% | |
| URGN Links: Profile News Message Board | |
| Charts:- Daily , Weekly | |
| Add URGN to Watchlist: View: Get Complete URGN Trend Analysis ➞ | |
 | GLTO Galecto, Inc. |
| Sector: Health Care | |
| SubSector: Biotechnology | |
| MarketCap: 34487 Millions | |
| Recent Price: 0.64 Smart Investing & Trading Score: 20 | |
| Day Percent Change: 0.00% Day Change: 0.00 | |
| Week Change: 2.38% Year-to-date Change: -11.7% | |
| GLTO Links: Profile News Message Board | |
| Charts:- Daily , Weekly | |
| Add GLTO to Watchlist: View: Get Complete GLTO Trend Analysis ➞ | |
 | PSTX Poseida Therapeutics, Inc. |
| Sector: Health Care | |
| SubSector: Biotechnology | |
| MarketCap: 64487 Millions | |
| Recent Price: 2.96 Smart Investing & Trading Score: 37 | |
| Day Percent Change: -6.17% Day Change: -0.20 | |
| Week Change: -7.05% Year-to-date Change: -11.9% | |
| PSTX Links: Profile News Message Board | |
| Charts:- Daily , Weekly | |
| Add PSTX to Watchlist: View: Get Complete PSTX Trend Analysis ➞ | |
 | BIIB Biogen Inc. |
| Sector: Health Care | |
| SubSector: Biotechnology | |
| MarketCap: 53102.6 Millions | |
| Recent Price: 227.69 Smart Investing & Trading Score: 68 | |
| Day Percent Change: -1.68% Day Change: -3.89 | |
| Week Change: -1.25% Year-to-date Change: -12.0% | |
| BIIB Links: Profile News Message Board | |
| Charts:- Daily , Weekly | |
| Add BIIB to Watchlist: View: Get Complete BIIB Trend Analysis ➞ | |
 | ALKS Alkermes plc |
| Sector: Health Care | |
| SubSector: Biotechnology | |
| MarketCap: 2311.95 Millions | |
| Recent Price: 24.34 Smart Investing & Trading Score: 52 | |
| Day Percent Change: -0.16% Day Change: -0.04 | |
| Week Change: 0.79% Year-to-date Change: -12.3% | |
| ALKS Links: Profile News Message Board | |
| Charts:- Daily , Weekly | |
| Add ALKS to Watchlist: View: Get Complete ALKS Trend Analysis ➞ | |
 | EHAB Enhabit, Inc. |
| Sector: Health Care | |
| SubSector: Medical Care Facilities | |
| MarketCap: 569 Millions | |
| Recent Price: 9.08 Smart Investing & Trading Score: 55 | |
| Day Percent Change: 1.45% Day Change: 0.13 | |
| Week Change: 10.06% Year-to-date Change: -12.3% | |
| EHAB Links: Profile News Message Board | |
| Charts:- Daily , Weekly | |
| Add EHAB to Watchlist: View: Get Complete EHAB Trend Analysis ➞ | |
 | CALT Calliditas Therapeutics AB (publ) |
| Sector: Health Care | |
| SubSector: Drug Manufacturers Specialty & Generic | |
| MarketCap: 83487 Millions | |
| Recent Price: 22.50 Smart Investing & Trading Score: 90 | |
| Day Percent Change: 2.27% Day Change: 0.50 | |
| Week Change: 1.4% Year-to-date Change: -12.4% | |
| CALT Links: Profile News Message Board | |
| Charts:- Daily , Weekly | |
| Add CALT to Watchlist: View: Get Complete CALT Trend Analysis ➞ | |
 | EXEL Exelixis, Inc. |
| Sector: Health Care | |
| SubSector: Biotechnology | |
| MarketCap: 5254.75 Millions | |
| Recent Price: 21.02 Smart Investing & Trading Score: 10 | |
| Day Percent Change: -0.19% Day Change: -0.04 | |
| Week Change: 0.53% Year-to-date Change: -12.4% | |
| EXEL Links: Profile News Message Board | |
| Charts:- Daily , Weekly | |
| Add EXEL to Watchlist: View: Get Complete EXEL Trend Analysis ➞ | |
 | ZTS Zoetis Inc. |
| Sector: Health Care | |
| SubSector: Drugs - Generic | |
| MarketCap: 51921.5 Millions | |
| Recent Price: 172.79 Smart Investing & Trading Score: 47 | |
| Day Percent Change: -0.92% Day Change: -1.60 | |
| Week Change: -0.73% Year-to-date Change: -12.5% | |
| ZTS Links: Profile News Message Board | |
| Charts:- Daily , Weekly | |
| Add ZTS to Watchlist: View: Get Complete ZTS Trend Analysis ➞ | |
 | MIRM Mirum Pharmaceuticals, Inc. |
| Sector: Health Care | |
| SubSector: Biotechnology | |
| MarketCap: 309.585 Millions | |
| Recent Price: 25.83 Smart Investing & Trading Score: 42 | |
| Day Percent Change: 2.09% Day Change: 0.53 | |
| Week Change: 7.31% Year-to-date Change: -12.5% | |
| MIRM Links: Profile News Message Board | |
| Charts:- Daily , Weekly | |
| Add MIRM to Watchlist: View: Get Complete MIRM Trend Analysis ➞ | |
 | CRSP CRISPR Therapeutics AG |
| Sector: Health Care | |
| SubSector: Biotechnology | |
| MarketCap: 2691.35 Millions | |
| Recent Price: 54.76 Smart Investing & Trading Score: 17 | |
| Day Percent Change: -1.28% Day Change: -0.71 | |
| Week Change: -2.6% Year-to-date Change: -12.5% | |
| CRSP Links: Profile News Message Board | |
| Charts:- Daily , Weekly | |
| Add CRSP to Watchlist: View: Get Complete CRSP Trend Analysis ➞ | |
 | RFL Rafael Holdings, Inc. |
| Sector: Health Care | |
| SubSector: Biotechnology | |
| MarketCap: 203.685 Millions | |
| Recent Price: 1.60 Smart Investing & Trading Score: 15 | |
| Day Percent Change: -0.62% Day Change: -0.01 | |
| Week Change: 0% Year-to-date Change: -12.6% | |
| RFL Links: Profile News Message Board | |
| Charts:- Daily , Weekly | |
| Add RFL to Watchlist: View: Get Complete RFL Trend Analysis ➞ | |
 | PRME Prime Medicine, Inc. |
| Sector: Health Care | |
| SubSector: Biotechnology | |
| MarketCap: 1440 Millions | |
| Recent Price: 7.96 Smart Investing & Trading Score: 69 | |
| Day Percent Change: 5.71% Day Change: 0.43 | |
| Week Change: 12.43% Year-to-date Change: -12.7% | |
| PRME Links: Profile News Message Board | |
| Charts:- Daily , Weekly | |
| Add PRME to Watchlist: View: Get Complete PRME Trend Analysis ➞ | |
 | BNTX BioNTech SE |
| Sector: Health Care | |
| SubSector: Biotechnology | |
| MarketCap: 11933.7 Millions | |
| Recent Price: 92.07 Smart Investing & Trading Score: 54 | |
| Day Percent Change: -0.43% Day Change: -0.40 | |
| Week Change: 1.61% Year-to-date Change: -12.8% | |
| BNTX Links: Profile News Message Board | |
| Charts:- Daily , Weekly | |
| Add BNTX to Watchlist: View: Get Complete BNTX Trend Analysis ➞ | |
| For tabular summary view of above stock list: Summary View ➞ 0 - 25 , 25 - 50 , 50 - 75 , 75 - 100 , 100 - 125 , 125 - 150 , 150 - 175 , 175 - 200 , 200 - 225 , 225 - 250 , 250 - 275 , 275 - 300 , 300 - 325 , 325 - 350 , 350 - 375 , 375 - 400 , 400 - 425 , 425 - 450 , 450 - 475 , 475 - 500 , 500 - 525 , 525 - 550 , 550 - 575 , 575 - 600 , 600 - 625 , 625 - 650 , 650 - 675 , 675 - 700 , 700 - 725 | ||
| Click To Change The Sort Order: By Market Cap or Company Size Performance: Year-to-date, Week and Day | |
| Select Chart Type: | ||
|
Best Stocks Today 12Stocks.com |
© 2024 12Stocks.com Terms & Conditions Privacy Contact Us
All Information Provided Only For Education And Not To Be Used For Investing or Trading. See Terms & Conditions


One More Thing ... Get Best Stocks Delivered Daily!
Never Ever Miss A Move With Our Top Ten Stocks Lists
Find Best Stocks In Any Market - Bull or Bear Market
Take A Peek At Our Top Ten Stocks Lists: Daily, Weekly, Year-to-Date & Top Trends
Find Best Stocks In Any Market - Bull or Bear Market
Take A Peek At Our Top Ten Stocks Lists: Daily, Weekly, Year-to-Date & Top Trends
Healthcare Stocks With Best Up Trends [0-bearish to 100-bullish]: DURECT [100], Brainstorm Cell[100], Third Harmonic[100], Concord [100], Arbutus Biopharma[100], Madrigal [100], Tandem Diabetes[100], PureTech Health[100], Genfit SA[100], AstraZeneca [100], Moderna [100]
Best Healthcare Stocks Year-to-Date:
Pieris [6042.86%], Precision BioSciences[3472.6%], Avenue [2266.46%], Inovio [2054.9%], Assembly Biosciences[1748.56%], Aurora Cannabis[1398.32%], Agenus [1243.16%], NuCana [1103.52%], Adverum Biotechnologies[944.1%], Affimed N.V[724%], Burning Rock[690.76%] Best Healthcare Stocks This Week:
DURECT [37.07%], Genelux [31.78%], Nobilis Health[29.53%], Concord [29.19%], iBio [26.29%], Pulse Biosciences[24.58%], Accelerate Diagnostics[23.02%], Scilex Holding[22.22%], Dyne [17.88%], PTC [17.39%], CareMax [16.61%] Best Healthcare Stocks Daily:
DURECT [24.04%], Accelerate Diagnostics[23.66%], CareMax [17.83%], RAPT [15.00%], Pulse Biosciences[13.40%], Genelux [11.86%], Relay [11.58%], Sol-Gel Technologies[10.62%], Brainstorm Cell[9.35%], Vaxxinity [9.30%], Third Harmonic[8.54%]