
 Login Sign Up


| |||||
 |  | ||||

| 12Stocks.com Market Intelligence |
Best Healthcare Stocks
 | "Discover best trending healthcare stocks with 12Stocks.com." |
| - Subu Vdaygiri, Founder, 12Stocks.com |
| In a hurry? Healthcare Stocks Lists: Performance Trends Table, Stock Charts
Sort Healthcare stocks: Daily, Weekly, Year-to-Date, Market Cap & Trends. Filter Healthcare stocks list by size:All Healthcare Large Mid-Range Small |
| 12Stocks.com Healthcare Stocks Performances & Trends Daily | |||||||||
|
|  The overall Smart Investing & Trading Score is 83 (0-bearish to 100-bullish) which puts Healthcare sector in short term bullish trend. The Smart Investing & Trading Score from previous trading session is 88 and a deterioration of trend continues.
| ||||||||
Here are the Smart Investing & Trading Scores of the most requested Healthcare stocks at 12Stocks.com (click stock name for detailed review):
|


| 12Stocks.com: Investing in Healthcare sector with Stocks | |
|
The following table helps investors and traders sort through current performance and trends (as measured by Smart Investing & Trading Score) of various
stocks in the Healthcare sector. Quick View: Move mouse or cursor over stock symbol (ticker) to view short-term Technical chart and over stock name to view long term chart. Click on  to add stock symbol to your watchlist and to add stock symbol to your watchlist and  to view watchlist. Click on any ticker or stock name for detailed market intelligence report for that stock. to view watchlist. Click on any ticker or stock name for detailed market intelligence report for that stock. |
12Stocks.com Performance of Stocks in Healthcare Sector
| Ticker | Stock Name | Watchlist | Category | Recent Price | Smart Investing & Trading Score | Change % | YTD Change% |
| MOLN | Molecular Partners |   | Biotechnology | 3.73 | 15 | 0.00% | -7.10% |
| DNLI | Denali | | Biotechnology | 19.91 | 66 | -1.09% | -7.22% |
| HRMY | Harmony Biosciences | | Biotechnology | 29.86 | 52 | 0.47% | -7.53% |
| PRGO | Perrigo | | Pharmaceutical | 29.75 | 36 | 0.73% | -7.54% |
| TAK | Takeda | | Pharmaceutical | 13.19 | 23 | -0.68% | -7.57% |
| NATR | Nature s | | Pharmaceutical | 15.96 | 18 | 5.84% | -7.69% |
| RGEN | Repligen | | Biotechnology | 165.66 | 40 | -3.56% | -7.86% |
| IPSC | Century | | Biotechnology | 3.04 | 25 | 1.33% | -7.88% |
| IMAB | I Mab | | Biotechnology | 1.75 | 22 | -0.28% | -7.89% |
| USNA | USANA Health | | Pharmaceutical | 49.33 | 63 | 1.41% | -7.98% |
| BEAM | Beam | | Biotechnology | 25.05 | 30 | 0.83% | -7.99% |
| PCRX | Pacira BioSciences | | Pharmaceutical | 31.03 | 68 | 1.37% | -8.03% |
| IRMD | IRadimed | | Equipment | 43.61 | 85 | -0.46% | -8.13% |
| GMAB | Genmab A/S | | Biotechnology | 29.23 | 54 | -1.55% | -8.20% |
| BHVN | Biohaven | | Biotechnology | 39.05 | 15 | -0.69% | -8.76% |
| INCY | yte | | Biotechnology | 57.23 | 50 | 0.07% | -8.85% |
| BFLY | Butterfly Network | | Medical Devices | 1.03 | 49 | -0.96% | -8.85% |
| TCMD | Tactile Systems | | Instruments | 13.03 | 0 | -4.54% | -8.88% |
| NEO | NeoGenomics | | Laboratories | 14.73 | 0 | -1.24% | -8.99% |
| CPIX | Cumberland | | Pharmaceutical | 1.63 | 64 | 4.49% | -9.02% |
| SVRA | Savara | | Biotechnology | 4.28 | 0 | 2.52% | -9.04% |
| PSTX | Poseida | | Biotechnology | 3.06 | 37 | -3.32% | -9.21% |
| RFL | Rafael | | Biotechnology | 1.66 | 62 | 3.04% | -9.34% |
| MDXG | MiMedx | | Equipment | 7.95 | 29 | -0.63% | -9.35% |
| DRTS | Alpha Tau | | Biotechnology | 2.71 | 64 | 0.00% | -9.36% |
| For chart view version of above stock list: Chart View ➞ 0 - 25 , 25 - 50 , 50 - 75 , 75 - 100 , 100 - 125 , 125 - 150 , 150 - 175 , 175 - 200 , 200 - 225 , 225 - 250 , 250 - 275 , 275 - 300 , 300 - 325 , 325 - 350 , 350 - 375 , 375 - 400 , 400 - 425 , 425 - 450 , 450 - 475 , 475 - 500 , 500 - 525 , 525 - 550 , 550 - 575 , 575 - 600 , 600 - 625 , 625 - 650 , 650 - 675 , 675 - 700 , 700 - 725 | ||
 | Click To Change The Sort Order: By Market Cap or Company Size Performance: Year-to-date, Week and Day |  |
|
Get the most comprehensive stock market coverage daily at 12Stocks.com ➞ Best Stocks Today ➞ Best Stocks Weekly ➞ Best Stocks Year-to-Date ➞ Best Stocks Trends ➞  Best Stocks Today 12Stocks.com Best Nasdaq Stocks ➞ Best S&P 500 Stocks ➞ Best Tech Stocks ➞ Best Biotech Stocks ➞ |
| Detailed Overview of Healthcare Stocks |
| Healthcare Technical Overview, Leaders & Laggards, Top Healthcare ETF Funds & Detailed Healthcare Stocks List, Charts, Trends & More |
| Healthcare Sector: Technical Analysis, Trends & YTD Performance | |
| Healthcare sector is composed of stocks
from pharmaceutical, biotech, diagnostics labs, insurance providers
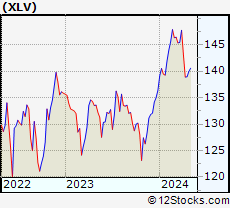
and healthcare services. Healthcare sector, as represented by XLV, an exchange-traded fund [ETF] that holds basket of Healthcare stocks (e.g, Merck, Amgen) is up by 7.01% and is currently underperforming the overall market by -3.71% year-to-date. Below is a quick view of Technical charts and trends: |
|
 XLV Weekly Chart |
|
| Long Term Trend: Very Good | |
| Medium Term Trend: Very Good | |
 XLV Daily Chart |
|
| Short Term Trend: Good | |
| Overall Trend Score: 83 | |
| YTD Performance: 7.01% | |
| **Trend Scores & Views Are Only For Educational Purposes And Not For Investing | |
| 12Stocks.com: Top Performing Healthcare Sector Stocks | ||||||||||||||||||||||||||||||||||||||||||||||||
 The top performing Healthcare sector stocks year to date are
Now, more recently, over last week, the top performing Healthcare sector stocks on the move are


|
||||||||||||||||||||||||||||||||||||||||||||||||
| 12Stocks.com: Investing in Healthcare Sector using Exchange Traded Funds | |
|
The following table shows list of key exchange traded funds (ETF) that
help investors track Healthcare Index. For detailed view, check out our ETF Funds section of our website. Quick View: Move mouse or cursor over ETF symbol (ticker) to view short-term Technical chart and over ETF name to view long term chart. Click on ticker or stock name for detailed view. Click on to add stock symbol to your watchlist and to view watchlist. |
12Stocks.com List of ETFs that track Healthcare Index
| Ticker | ETF Name | Watchlist | Recent Price | Smart Investing & Trading Score | Change % | Week % | Year-to-date % |
| XLV | Health Care | | 145.94 | 83 | -0.04 | -0.26 | 7.01% |
| XBI | Biotech | | 91.28 | 45 | -1.07 | 0.11 | 2.23% |
| IBB | Biotechnology | | 136.38 | 70 | -0.82 | -0.23 | 0.39% |
| BBH | Biotech | | 168.05 | 83 | -0.32 | 0.04 | 1.66% |
| VHT | Health Care | | 266.49 | 53 | -0.13 | -0.23 | 6.3% |
| IYH | Healthcare | | 61.23 | 48 | -0.02 | -0.19 | 6.95% |
| IHF | Healthcare Providers | | 53.62 | 76 | 0.15 | -0.54 | 2.11% |
| IHI | Medical Devices | | 56.26 | 30 | -0.34 | -0.76 | 4.24% |
| BIB | Biotechnology | | 57.88 | 63 | -0.02 | 1.62 | 1.45% |
| BIS | Short Biotech | | 17.32 | 10 | -0.06 | -1.53 | -4.15% |
| XHE | Health Care Equipment | | 86.82 | 61 | -0.78 | -0.72 | 3.04% |
| CURE | Healthcare Bull 3X | | 118.32 | 70 | 0.06 | -0.65 | 16.3% |
| LABU | Biotech Bull 3X | | 111.80 | 32 | -3.45 | 0.01 | -8.34% |
| LABD | Biotech Bear 3X | | 7.93 | 61 | 3.39 | -0.25 | -18.16% |
| PSCH | SmallCap Health Care | | 43.44 | 56 | -0.02 | 0.1 | 1.5% |
| XHS | Health Care Services | | 91.28 | 73 | -0.65 | -0.29 | 2.62% |
| PTH | DWA Healthcare Momentum | | 43.07 | 35 | -0.09 | 1.03 | 10.04% |
| BTEC | Principal Healthcare Innovators | | 36.83 | 28 | -0.30 | 0.96 | 1.38% |
| RXL | Health Care | | 103.09 | 83 | 0.19 | 0.32 | 12.79% |
| RXD | Short Health Care | | 10.61 | 10 | 0.39 | 0.46 | -11.02% |
| 12Stocks.com: Charts, Trends, Fundamental Data and Performances of Healthcare Stocks | |
|
We now take in-depth look at all Healthcare stocks including charts, multi-period performances and overall trends (as measured by Smart Investing & Trading Score). One can sort Healthcare stocks (click link to choose) by Daily, Weekly and by Year-to-Date performances. Also, one can sort by size of the company or by market capitalization. |
| Select Your Default Chart Type: | |||||
| |||||
| Click on stock symbol or name for detailed view. Click on to add stock symbol to your watchlist and to view watchlist. Quick View: Move mouse or cursor over "Daily" to quickly view daily Technical stock chart and over "Weekly" to view weekly Technical stock chart. | |||||

 | MOLN Molecular Partners AG |
| Sector: Health Care | |
| SubSector: Biotechnology | |
| MarketCap: 216 Millions | |
| Recent Price: 3.73 Smart Investing & Trading Score: 15 | |
| Day Percent Change: 0.00% Day Change: 0.00 | |
| Week Change: -1.32% Year-to-date Change: -7.1% | |
| MOLN Links: Profile News Message Board | |
| Charts:- Daily , Weekly | |
| Add MOLN to Watchlist: View: Get Complete MOLN Trend Analysis ➞ | |
 | DNLI Denali Therapeutics Inc. |
| Sector: Health Care | |
| SubSector: Biotechnology | |
| MarketCap: 2020.05 Millions | |
| Recent Price: 19.91 Smart Investing & Trading Score: 66 | |
| Day Percent Change: -1.09% Day Change: -0.22 | |
| Week Change: -2.93% Year-to-date Change: -7.2% | |
| DNLI Links: Profile News Message Board | |
| Charts:- Daily , Weekly | |
| Add DNLI to Watchlist: View: Get Complete DNLI Trend Analysis ➞ | |
 | HRMY Harmony Biosciences Holdings, Inc. |
| Sector: Health Care | |
| SubSector: Biotechnology | |
| MarketCap: 24487 Millions | |
| Recent Price: 29.86 Smart Investing & Trading Score: 52 | |
| Day Percent Change: 0.47% Day Change: 0.14 | |
| Week Change: 2.86% Year-to-date Change: -7.5% | |
| HRMY Links: Profile News Message Board | |
| Charts:- Daily , Weekly | |
| Add HRMY to Watchlist: View: Get Complete HRMY Trend Analysis ➞ | |
 | PRGO Perrigo Company plc |
| Sector: Health Care | |
| SubSector: Drug Related Products | |
| MarketCap: 6493.93 Millions | |
| Recent Price: 29.75 Smart Investing & Trading Score: 36 | |
| Day Percent Change: 0.73% Day Change: 0.21 | |
| Week Change: -0.25% Year-to-date Change: -7.5% | |
| PRGO Links: Profile News Message Board | |
| Charts:- Daily , Weekly | |
| Add PRGO to Watchlist: View: Get Complete PRGO Trend Analysis ➞ | |
 | TAK Takeda Pharmaceutical Company Limited |
| Sector: Health Care | |
| SubSector: Drugs - Generic | |
| MarketCap: 41342.5 Millions | |
| Recent Price: 13.19 Smart Investing & Trading Score: 23 | |
| Day Percent Change: -0.68% Day Change: -0.09 | |
| Week Change: -0.23% Year-to-date Change: -7.6% | |
| TAK Links: Profile News Message Board | |
| Charts:- Daily , Weekly | |
| Add TAK to Watchlist: View: Get Complete TAK Trend Analysis ➞ | |
 | NATR Nature s Sunshine Products, Inc. |
| Sector: Health Care | |
| SubSector: Drugs - Generic | |
| MarketCap: 153.285 Millions | |
| Recent Price: 15.96 Smart Investing & Trading Score: 18 | |
| Day Percent Change: 5.84% Day Change: 0.88 | |
| Week Change: 2.31% Year-to-date Change: -7.7% | |
| NATR Links: Profile News Message Board | |
| Charts:- Daily , Weekly | |
| Add NATR to Watchlist: View: Get Complete NATR Trend Analysis ➞ | |
 | RGEN Repligen Corporation |
| Sector: Health Care | |
| SubSector: Biotechnology | |
| MarketCap: 4711.75 Millions | |
| Recent Price: 165.66 Smart Investing & Trading Score: 40 | |
| Day Percent Change: -3.56% Day Change: -6.12 | |
| Week Change: -3.65% Year-to-date Change: -7.9% | |
| RGEN Links: Profile News Message Board | |
| Charts:- Daily , Weekly | |
| Add RGEN to Watchlist: View: Get Complete RGEN Trend Analysis ➞ | |
 | IPSC Century Therapeutics, Inc. |
| Sector: Health Care | |
| SubSector: Biotechnology | |
| MarketCap: 187 Millions | |
| Recent Price: 3.04 Smart Investing & Trading Score: 25 | |
| Day Percent Change: 1.33% Day Change: 0.04 | |
| Week Change: 1% Year-to-date Change: -7.9% | |
| IPSC Links: Profile News Message Board | |
| Charts:- Daily , Weekly | |
| Add IPSC to Watchlist: View: Get Complete IPSC Trend Analysis ➞ | |
 | IMAB I Mab |
| Sector: Health Care | |
| SubSector: Biotechnology | |
| MarketCap: 26187 Millions | |
| Recent Price: 1.75 Smart Investing & Trading Score: 22 | |
| Day Percent Change: -0.28% Day Change: 0.00 | |
| Week Change: 0% Year-to-date Change: -7.9% | |
| IMAB Links: Profile News Message Board | |
| Charts:- Daily , Weekly | |
| Add IMAB to Watchlist: View: Get Complete IMAB Trend Analysis ➞ | |
 | USNA USANA Health Sciences, Inc. |
| Sector: Health Care | |
| SubSector: Drug Related Products | |
| MarketCap: 1185.13 Millions | |
| Recent Price: 49.33 Smart Investing & Trading Score: 63 | |
| Day Percent Change: 1.41% Day Change: 0.69 | |
| Week Change: 0.68% Year-to-date Change: -8.0% | |
| USNA Links: Profile News Message Board | |
| Charts:- Daily , Weekly | |
| Add USNA to Watchlist: View: Get Complete USNA Trend Analysis ➞ | |
 | BEAM Beam Therapeutics Inc. |
| Sector: Health Care | |
| SubSector: Biotechnology | |
| MarketCap: 44987 Millions | |
| Recent Price: 25.05 Smart Investing & Trading Score: 30 | |
| Day Percent Change: 0.83% Day Change: 0.21 | |
| Week Change: 1.73% Year-to-date Change: -8.0% | |
| BEAM Links: Profile News Message Board | |
| Charts:- Daily , Weekly | |
| Add BEAM to Watchlist: View: Get Complete BEAM Trend Analysis ➞ | |
 | PCRX Pacira BioSciences, Inc. |
| Sector: Health Care | |
| SubSector: Drugs - Generic | |
| MarketCap: 1403.95 Millions | |
| Recent Price: 31.03 Smart Investing & Trading Score: 68 | |
| Day Percent Change: 1.37% Day Change: 0.42 | |
| Week Change: 0.68% Year-to-date Change: -8.0% | |
| PCRX Links: Profile News Message Board | |
| Charts:- Daily , Weekly | |
| Add PCRX to Watchlist: View: Get Complete PCRX Trend Analysis ➞ | |
 | IRMD IRadimed Corporation |
| Sector: Health Care | |
| SubSector: Medical Appliances & Equipment | |
| MarketCap: 207.78 Millions | |
| Recent Price: 43.61 Smart Investing & Trading Score: 85 | |
| Day Percent Change: -0.46% Day Change: -0.20 | |
| Week Change: 2.98% Year-to-date Change: -8.1% | |
| IRMD Links: Profile News Message Board | |
| Charts:- Daily , Weekly | |
| Add IRMD to Watchlist: View: Get Complete IRMD Trend Analysis ➞ | |
 | GMAB Genmab A/S |
| Sector: Health Care | |
| SubSector: Biotechnology | |
| MarketCap: 12482.3 Millions | |
| Recent Price: 29.23 Smart Investing & Trading Score: 54 | |
| Day Percent Change: -1.55% Day Change: -0.46 | |
| Week Change: -2.5% Year-to-date Change: -8.2% | |
| GMAB Links: Profile News Message Board | |
| Charts:- Daily , Weekly | |
| Add GMAB to Watchlist: View: Get Complete GMAB Trend Analysis ➞ | |
 | BHVN Biohaven Pharmaceutical Holding Company Ltd. |
| Sector: Health Care | |
| SubSector: Biotechnology | |
| MarketCap: 2024.25 Millions | |
| Recent Price: 39.05 Smart Investing & Trading Score: 15 | |
| Day Percent Change: -0.69% Day Change: -0.27 | |
| Week Change: 4.5% Year-to-date Change: -8.8% | |
| BHVN Links: Profile News Message Board | |
| Charts:- Daily , Weekly | |
| Add BHVN to Watchlist: View: Get Complete BHVN Trend Analysis ➞ | |
 | INCY Incyte Corporation |
| Sector: Health Care | |
| SubSector: Biotechnology | |
| MarketCap: 15343.2 Millions | |
| Recent Price: 57.23 Smart Investing & Trading Score: 50 | |
| Day Percent Change: 0.07% Day Change: 0.04 | |
| Week Change: 0.23% Year-to-date Change: -8.9% | |
| INCY Links: Profile News Message Board | |
| Charts:- Daily , Weekly | |
| Add INCY to Watchlist: View: Get Complete INCY Trend Analysis ➞ | |
 | BFLY Butterfly Network, Inc. |
| Sector: Health Care | |
| SubSector: Medical Devices | |
| MarketCap: 461 Millions | |
| Recent Price: 1.03 Smart Investing & Trading Score: 49 | |
| Day Percent Change: -0.96% Day Change: -0.01 | |
| Week Change: 0% Year-to-date Change: -8.9% | |
| BFLY Links: Profile News Message Board | |
| Charts:- Daily , Weekly | |
| Add BFLY to Watchlist: View: Get Complete BFLY Trend Analysis ➞ | |
 | TCMD Tactile Systems Technology, Inc. |
| Sector: Health Care | |
| SubSector: Medical Instruments & Supplies | |
| MarketCap: 655.96 Millions | |
| Recent Price: 13.03 Smart Investing & Trading Score: 0 | |
| Day Percent Change: -4.54% Day Change: -0.62 | |
| Week Change: -5.1% Year-to-date Change: -8.9% | |
| TCMD Links: Profile News Message Board | |
| Charts:- Daily , Weekly | |
| Add TCMD to Watchlist: View: Get Complete TCMD Trend Analysis ➞ | |
 | NEO NeoGenomics, Inc. |
| Sector: Health Care | |
| SubSector: Medical Laboratories & Research | |
| MarketCap: 2763.8 Millions | |
| Recent Price: 14.73 Smart Investing & Trading Score: 0 | |
| Day Percent Change: -1.24% Day Change: -0.19 | |
| Week Change: -0.51% Year-to-date Change: -9.0% | |
| NEO Links: Profile News Message Board | |
| Charts:- Daily , Weekly | |
| Add NEO to Watchlist: View: Get Complete NEO Trend Analysis ➞ | |
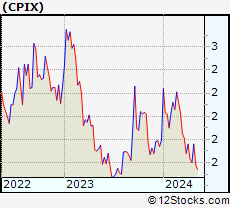 | CPIX Cumberland Pharmaceuticals Inc. |
| Sector: Health Care | |
| SubSector: Drug Manufacturers - Other | |
| MarketCap: 57.4033 Millions | |
| Recent Price: 1.63 Smart Investing & Trading Score: 64 | |
| Day Percent Change: 4.49% Day Change: 0.07 | |
| Week Change: 8.67% Year-to-date Change: -9.0% | |
| CPIX Links: Profile News Message Board | |
| Charts:- Daily , Weekly | |
| Add CPIX to Watchlist: View: Get Complete CPIX Trend Analysis ➞ | |
 | SVRA Savara Inc. |
| Sector: Health Care | |
| SubSector: Biotechnology | |
| MarketCap: 80.3785 Millions | |
| Recent Price: 4.28 Smart Investing & Trading Score: 0 | |
| Day Percent Change: 2.52% Day Change: 0.11 | |
| Week Change: -4.58% Year-to-date Change: -9.0% | |
| SVRA Links: Profile News Message Board | |
| Charts:- Daily , Weekly | |
| Add SVRA to Watchlist: View: Get Complete SVRA Trend Analysis ➞ | |
 | PSTX Poseida Therapeutics, Inc. |
| Sector: Health Care | |
| SubSector: Biotechnology | |
| MarketCap: 64487 Millions | |
| Recent Price: 3.06 Smart Investing & Trading Score: 37 | |
| Day Percent Change: -3.32% Day Change: -0.10 | |
| Week Change: -4.23% Year-to-date Change: -9.2% | |
| PSTX Links: Profile News Message Board | |
| Charts:- Daily , Weekly | |
| Add PSTX to Watchlist: View: Get Complete PSTX Trend Analysis ➞ | |
 | RFL Rafael Holdings, Inc. |
| Sector: Health Care | |
| SubSector: Biotechnology | |
| MarketCap: 203.685 Millions | |
| Recent Price: 1.66 Smart Investing & Trading Score: 62 | |
| Day Percent Change: 3.04% Day Change: 0.05 | |
| Week Change: 3.69% Year-to-date Change: -9.3% | |
| RFL Links: Profile News Message Board | |
| Charts:- Daily , Weekly | |
| Add RFL to Watchlist: View: Get Complete RFL Trend Analysis ➞ | |
 | MDXG MiMedx Group, Inc. |
| Sector: Health Care | |
| SubSector: Medical Appliances & Equipment | |
| MarketCap: 371.08 Millions | |
| Recent Price: 7.95 Smart Investing & Trading Score: 29 | |
| Day Percent Change: -0.63% Day Change: -0.05 | |
| Week Change: 1.92% Year-to-date Change: -9.4% | |
| MDXG Links: Profile News Message Board | |
| Charts:- Daily , Weekly | |
| Add MDXG to Watchlist: View: Get Complete MDXG Trend Analysis ➞ | |
 | DRTS Alpha Tau Medical Ltd. |
| Sector: Health Care | |
| SubSector: Biotechnology | |
| MarketCap: 300 Millions | |
| Recent Price: 2.71 Smart Investing & Trading Score: 64 | |
| Day Percent Change: 0.00% Day Change: 0.00 | |
| Week Change: -4.24% Year-to-date Change: -9.4% | |
| DRTS Links: Profile News Message Board | |
| Charts:- Daily , Weekly | |
| Add DRTS to Watchlist: View: Get Complete DRTS Trend Analysis ➞ | |
| For tabular summary view of above stock list: Summary View ➞ 0 - 25 , 25 - 50 , 50 - 75 , 75 - 100 , 100 - 125 , 125 - 150 , 150 - 175 , 175 - 200 , 200 - 225 , 225 - 250 , 250 - 275 , 275 - 300 , 300 - 325 , 325 - 350 , 350 - 375 , 375 - 400 , 400 - 425 , 425 - 450 , 450 - 475 , 475 - 500 , 500 - 525 , 525 - 550 , 550 - 575 , 575 - 600 , 600 - 625 , 625 - 650 , 650 - 675 , 675 - 700 , 700 - 725 | ||
| Click To Change The Sort Order: By Market Cap or Company Size Performance: Year-to-date, Week and Day | |
| Select Chart Type: | ||
|
Best Stocks Today 12Stocks.com |
© 2024 12Stocks.com Terms & Conditions Privacy Contact Us
All Information Provided Only For Education And Not To Be Used For Investing or Trading. See Terms & Conditions


One More Thing ... Get Best Stocks Delivered Daily!
Never Ever Miss A Move With Our Top Ten Stocks Lists
Find Best Stocks In Any Market - Bull or Bear Market
Take A Peek At Our Top Ten Stocks Lists: Daily, Weekly, Year-to-Date & Top Trends
Find Best Stocks In Any Market - Bull or Bear Market
Take A Peek At Our Top Ten Stocks Lists: Daily, Weekly, Year-to-Date & Top Trends
Healthcare Stocks With Best Up Trends [0-bearish to 100-bullish]: Brainstorm Cell[100], Concord [100], Third Harmonic[100], PureTech Health[100], Genfit SA[100], Tandem Diabetes[100], Arbutus Biopharma[100], AstraZeneca [100], Rockwell [100], Vericel [100], Heron [100]
Best Healthcare Stocks Year-to-Date:
Pieris [6042.86%], Precision BioSciences[3397.26%], Avenue [2266.46%], Inovio [2023.53%], Assembly Biosciences[1707.71%], Aurora Cannabis[1406.72%], Agenus [1214.17%], NuCana [1117.04%], Adverum Biotechnologies[975.98%], Affimed N.V[711.2%], Burning Rock[706.3%] Best Healthcare Stocks This Week:
Genelux [31.78%], Concord [29.15%], iBio [27.37%], Nobilis Health[27.33%], DURECT [26.45%], Scilex Holding[22.22%], Dyne [19.22%], Accelerate Diagnostics[19.05%], Petros [19.01%], PTC [17.6%], Sutro Biopharma[17.08%] Best Healthcare Stocks Daily:
Accelerate Diagnostics[19.67%], CareMax [17.83%], DURECT [14.42%], Genelux [11.86%], Petros [11.60%], Brainstorm Cell[9.42%], iBio [9.30%], Vaxxinity [9.30%], Concord [8.32%], Sage [8.05%], Mesoblast [7.66%]