
 Login Sign Up


| |||||
 |  | ||||

| 12Stocks.com Market Intelligence |
Best Healthcare Stocks
 | "Discover best trending healthcare stocks with 12Stocks.com." |
| - Subu Vdaygiri, Founder, 12Stocks.com |
| In a hurry? Healthcare Stocks Lists: Performance Trends Table, Stock Charts
Sort Healthcare stocks: Daily, Weekly, Year-to-Date, Market Cap & Trends. Filter Healthcare stocks list by size:All Healthcare Large Mid-Range Small |
| 12Stocks.com Healthcare Stocks Performances & Trends Daily | |||||||||
|
|  The overall Smart Investing & Trading Score is 38 (0-bearish to 100-bullish) which puts Healthcare sector in short term bearish to neutral trend. The Smart Investing & Trading Score from previous trading session is 25 and hence an improvement of trend.
| ||||||||
Here are the Smart Investing & Trading Scores of the most requested Healthcare stocks at 12Stocks.com (click stock name for detailed review):
|


| 12Stocks.com: Investing in Healthcare sector with Stocks | |
|
The following table helps investors and traders sort through current performance and trends (as measured by Smart Investing & Trading Score) of various
stocks in the Healthcare sector. Quick View: Move mouse or cursor over stock symbol (ticker) to view short-term Technical chart and over stock name to view long term chart. Click on  to add stock symbol to your watchlist and to add stock symbol to your watchlist and  to view watchlist. Click on any ticker or stock name for detailed market intelligence report for that stock. to view watchlist. Click on any ticker or stock name for detailed market intelligence report for that stock. |
12Stocks.com Performance of Stocks in Healthcare Sector
| Ticker | Stock Name | Watchlist | Category | Recent Price | Smart Investing & Trading Score | Change % | YTD Change% |
| ICLR | ICON Public |   | Laboratories | 297.93 | 58 | 3.37% | 5.25% |
| MRNA | Moderna | | Biotechnology | 104.46 | 83 | 2.98% | 5.04% |
| ARDX | Ardelyx | | Biotechnology | 6.51 | 25 | 0.46% | 5.00% |
| RMD | ResMed | | Instruments | 180.35 | 42 | 0.84% | 4.84% |
| HALO | Halozyme | | Biotechnology | 38.71 | 68 | 0.18% | 4.73% |
| DAWN | Day One | | Biotechnology | 15.38 | 86 | 2.81% | 4.70% |
| LCTX | Lineage Cell | | Biotechnology | 1.14 | 46 | -0.87% | 4.59% |
| BAX | Baxter | | Instruments | 40.40 | 68 | 2.36% | 4.50% |
| ENSG | Ensign | | Long-Term | 117.23 | 58 | -0.87% | 4.47% |
| LIVN | LivaNova | | Equipment | 54.01 | 83 | 3.25% | 4.39% |
| RPHM | Reneo | | Biotechnology | 1.69 | 36 | -2.87% | 4.32% |
| AZN | AstraZeneca | | Pharmaceutical | 70.13 | 100 | 2.30% | 4.13% |
| ITCI | Intra-Cellular Therapies | | Biotechnology | 74.54 | 80 | 3.00% | 4.08% |
| SGHT | Sight Sciences | | Medical Devices | 5.37 | 46 | 4.68% | 3.97% |
| RDY | Dr. Reddy | | Pharmaceutical | 72.15 | 52 | 1.42% | 3.69% |
| CHE | Chemed | | Home Care | 604.42 | 51 | 0.67% | 3.36% |
| TMO | Thermo Fisher | | Laboratories | 548.38 | 61 | 0.66% | 3.31% |
| SOPH | SOPHiA GENETICS | | Health Information | 5.01 | 78 | 1.01% | 3.30% |
| ALC | Alcon | | Instruments | 80.61 | 58 | 1.33% | 3.19% |
| INZY | Inozyme Pharma | | Biotechnology | 4.39 | 10 | -2.12% | 3.17% |
| PGEN | Precigen | | Biotechnology | 1.38 | 45 | 3.76% | 2.99% |
| SUPN | Supernus | | Pharmaceutical | 29.71 | 68 | 1.05% | 2.66% |
| VBIV | VBI Vaccines | | Biotechnology | 0.60 | 32 | -4.84% | 2.64% |
| REGN | Regeneron | | Biotechnology | 900.16 | 25 | 0.37% | 2.49% |
| TCMD | Tactile Systems | | Instruments | 14.65 | 37 | 1.74% | 2.45% |
| For chart view version of above stock list: Chart View ➞ 0 - 25 , 25 - 50 , 50 - 75 , 75 - 100 , 100 - 125 , 125 - 150 , 150 - 175 , 175 - 200 , 200 - 225 , 225 - 250 , 250 - 275 , 275 - 300 , 300 - 325 , 325 - 350 , 350 - 375 , 375 - 400 , 400 - 425 , 425 - 450 , 450 - 475 , 475 - 500 , 500 - 525 , 525 - 550 , 550 - 575 , 575 - 600 , 600 - 625 , 625 - 650 , 650 - 675 , 675 - 700 , 700 - 725 | ||
 | Click To Change The Sort Order: By Market Cap or Company Size Performance: Year-to-date, Week and Day |  |
|
Get the most comprehensive stock market coverage daily at 12Stocks.com ➞ Best Stocks Today ➞ Best Stocks Weekly ➞ Best Stocks Year-to-Date ➞ Best Stocks Trends ➞  Best Stocks Today 12Stocks.com Best Nasdaq Stocks ➞ Best S&P 500 Stocks ➞ Best Tech Stocks ➞ Best Biotech Stocks ➞ |
| Detailed Overview of Healthcare Stocks |
| Healthcare Technical Overview, Leaders & Laggards, Top Healthcare ETF Funds & Detailed Healthcare Stocks List, Charts, Trends & More |
| Healthcare Sector: Technical Analysis, Trends & YTD Performance | |
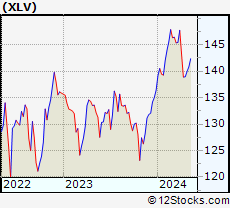
| Healthcare sector is composed of stocks
from pharmaceutical, biotech, diagnostics labs, insurance providers
and healthcare services. Healthcare sector, as represented by XLV, an exchange-traded fund [ETF] that holds basket of Healthcare stocks (e.g, Merck, Amgen) is up by 2.27% and is currently underperforming the overall market by -2.12% year-to-date. Below is a quick view of Technical charts and trends: |
|
 XLV Weekly Chart |
|
| Long Term Trend: Not Good | |
| Medium Term Trend: Not Good | |
 XLV Daily Chart |
|
| Short Term Trend: Very Good | |
| Overall Trend Score: 38 | |
| YTD Performance: 2.27% | |
| **Trend Scores & Views Are Only For Educational Purposes And Not For Investing | |
| 12Stocks.com: Top Performing Healthcare Sector Stocks | ||||||||||||||||||||||||||||||||||||||||||||||||
 The top performing Healthcare sector stocks year to date are
Now, more recently, over last week, the top performing Healthcare sector stocks on the move are


|
||||||||||||||||||||||||||||||||||||||||||||||||
| 12Stocks.com: Investing in Healthcare Sector using Exchange Traded Funds | |
|
The following table shows list of key exchange traded funds (ETF) that
help investors track Healthcare Index. For detailed view, check out our ETF Funds section of our website. Quick View: Move mouse or cursor over ETF symbol (ticker) to view short-term Technical chart and over ETF name to view long term chart. Click on ticker or stock name for detailed view. Click on to add stock symbol to your watchlist and to view watchlist. |
12Stocks.com List of ETFs that track Healthcare Index
| Ticker | ETF Name | Watchlist | Recent Price | Smart Investing & Trading Score | Change % | Week % | Year-to-date % |
| XLV | Health Care | | 139.48 | 38 | 0.38 | 0.38 | 2.27% |
| XBI | Biotech | | 82.81 | 10 | -0.03 | -0.03 | -7.26% |
| IBB | Biotechnology | | 126.11 | 25 | 1.11 | 1.11 | -7.17% |
| BBH | Biotech | | 154.56 | 32 | 1.44 | 1.44 | -6.5% |
| VHT | Health Care | | 254.53 | 25 | 0.47 | 0.47 | 1.53% |
| IYH | Healthcare | | 58.43 | 38 | 0.46 | 0.46 | 2.06% |
| IHF | Healthcare Providers | | 52.08 | 70 | -0.26 | -0.26 | -0.83% |
| IHI | Medical Devices | | 54.70 | 23 | 0.63 | 0.63 | 1.35% |
| BIB | Biotechnology | | 49.10 | 25 | 1.87 | 1.87 | -13.94% |
| BIS | Short Biotech | | 20.47 | 76 | -2.03 | -2.03 | 13.28% |
| XHE | Health Care Equipment | | 81.68 | 28 | 0.50 | 0.5 | -3.06% |
| CURE | Healthcare Bull 3X | | 104.45 | 32 | 1.08 | 1.08 | 2.66% |
| LABU | Biotech Bull 3X | | 86.43 | 10 | 0.44 | 0.44 | -29.14% |
| LABD | Biotech Bear 3X | | 10.75 | 95 | -0.46 | -0.46 | 10.94% |
| PSCH | SmallCap Health Care | | 40.39 | 35 | 0.52 | 0.52 | -5.63% |
| XHS | Health Care Services | | 87.45 | 50 | 0.42 | 0.42 | -1.69% |
| PTH | DWA Healthcare Momentum | | 39.34 | 20 | -0.48 | -0.48 | 0.51% |
| BTEC | Principal Healthcare Innovators | | 33.76 | 10 | -0.30 | -0.3 | -7.07% |
| RXL | Health Care | | 95.32 | 32 | 2.25 | 2.25 | 4.29% |
| RXD | Short Health Care | | 11.50 | 61 | -1.24 | -1.24 | -3.6% |
| 12Stocks.com: Charts, Trends, Fundamental Data and Performances of Healthcare Stocks | |
|
We now take in-depth look at all Healthcare stocks including charts, multi-period performances and overall trends (as measured by Smart Investing & Trading Score). One can sort Healthcare stocks (click link to choose) by Daily, Weekly and by Year-to-Date performances. Also, one can sort by size of the company or by market capitalization. |
| Select Your Default Chart Type: | |||||
| |||||
| Click on stock symbol or name for detailed view. Click on to add stock symbol to your watchlist and to view watchlist. Quick View: Move mouse or cursor over "Daily" to quickly view daily Technical stock chart and over "Weekly" to view weekly Technical stock chart. | |||||

 | ICLR ICON Public Limited Company |
| Sector: Health Care | |
| SubSector: Medical Laboratories & Research | |
| MarketCap: 7011 Millions | |
| Recent Price: 297.93 Smart Investing & Trading Score: 58 | |
| Day Percent Change: 3.37% Day Change: 9.70 | |
| Week Change: 3.37% Year-to-date Change: 5.3% | |
| ICLR Links: Profile News Message Board | |
| Charts:- Daily , Weekly | |
| Add ICLR to Watchlist: View: Get Complete ICLR Trend Analysis ➞ | |
 | MRNA Moderna, Inc. |
| Sector: Health Care | |
| SubSector: Biotechnology | |
| MarketCap: 11006.4 Millions | |
| Recent Price: 104.46 Smart Investing & Trading Score: 83 | |
| Day Percent Change: 2.98% Day Change: 3.02 | |
| Week Change: 2.98% Year-to-date Change: 5.0% | |
| MRNA Links: Profile News Message Board | |
| Charts:- Daily , Weekly | |
| Add MRNA to Watchlist: View: Get Complete MRNA Trend Analysis ➞ | |
 | ARDX Ardelyx, Inc. |
| Sector: Health Care | |
| SubSector: Biotechnology | |
| MarketCap: 541.985 Millions | |
| Recent Price: 6.51 Smart Investing & Trading Score: 25 | |
| Day Percent Change: 0.46% Day Change: 0.03 | |
| Week Change: 0.46% Year-to-date Change: 5.0% | |
| ARDX Links: Profile News Message Board | |
| Charts:- Daily , Weekly | |
| Add ARDX to Watchlist: View: Get Complete ARDX Trend Analysis ➞ | |
 | RMD ResMed Inc. |
| Sector: Health Care | |
| SubSector: Medical Instruments & Supplies | |
| MarketCap: 18660.2 Millions | |
| Recent Price: 180.35 Smart Investing & Trading Score: 42 | |
| Day Percent Change: 0.84% Day Change: 1.50 | |
| Week Change: 0.84% Year-to-date Change: 4.8% | |
| RMD Links: Profile News Message Board | |
| Charts:- Daily , Weekly | |
| Add RMD to Watchlist: View: Get Complete RMD Trend Analysis ➞ | |
 | HALO Halozyme Therapeutics, Inc. |
| Sector: Health Care | |
| SubSector: Biotechnology | |
| MarketCap: 2383.75 Millions | |
| Recent Price: 38.71 Smart Investing & Trading Score: 68 | |
| Day Percent Change: 0.18% Day Change: 0.07 | |
| Week Change: 0.18% Year-to-date Change: 4.7% | |
| HALO Links: Profile News Message Board | |
| Charts:- Daily , Weekly | |
| Add HALO to Watchlist: View: Get Complete HALO Trend Analysis ➞ | |
 | DAWN Day One Biopharmaceuticals, Inc. |
| Sector: Health Care | |
| SubSector: Biotechnology | |
| MarketCap: 1040 Millions | |
| Recent Price: 15.38 Smart Investing & Trading Score: 86 | |
| Day Percent Change: 2.81% Day Change: 0.42 | |
| Week Change: 2.81% Year-to-date Change: 4.7% | |
| DAWN Links: Profile News Message Board | |
| Charts:- Daily , Weekly | |
| Add DAWN to Watchlist: View: Get Complete DAWN Trend Analysis ➞ | |
 | LCTX Lineage Cell Therapeutics, Inc. |
| Sector: Health Care | |
| SubSector: Biotechnology | |
| MarketCap: 141.285 Millions | |
| Recent Price: 1.14 Smart Investing & Trading Score: 46 | |
| Day Percent Change: -0.87% Day Change: -0.01 | |
| Week Change: -0.87% Year-to-date Change: 4.6% | |
| LCTX Links: Profile News Message Board | |
| Charts:- Daily , Weekly | |
| Add LCTX to Watchlist: View: Get Complete LCTX Trend Analysis ➞ | |
 | BAX Baxter International Inc. |
| Sector: Health Care | |
| SubSector: Medical Instruments & Supplies | |
| MarketCap: 39955.8 Millions | |
| Recent Price: 40.40 Smart Investing & Trading Score: 68 | |
| Day Percent Change: 2.36% Day Change: 0.93 | |
| Week Change: 2.36% Year-to-date Change: 4.5% | |
| BAX Links: Profile News Message Board | |
| Charts:- Daily , Weekly | |
| Add BAX to Watchlist: View: Get Complete BAX Trend Analysis ➞ | |
 | ENSG The Ensign Group, Inc. |
| Sector: Health Care | |
| SubSector: Long-Term Care Facilities | |
| MarketCap: 2053.76 Millions | |
| Recent Price: 117.23 Smart Investing & Trading Score: 58 | |
| Day Percent Change: -0.87% Day Change: -1.03 | |
| Week Change: -0.87% Year-to-date Change: 4.5% | |
| ENSG Links: Profile News Message Board | |
| Charts:- Daily , Weekly | |
| Add ENSG to Watchlist: View: Get Complete ENSG Trend Analysis ➞ | |
 | LIVN LivaNova PLC |
| Sector: Health Care | |
| SubSector: Medical Appliances & Equipment | |
| MarketCap: 2060.5 Millions | |
| Recent Price: 54.01 Smart Investing & Trading Score: 83 | |
| Day Percent Change: 3.25% Day Change: 1.70 | |
| Week Change: 3.25% Year-to-date Change: 4.4% | |
| LIVN Links: Profile News Message Board | |
| Charts:- Daily , Weekly | |
| Add LIVN to Watchlist: View: Get Complete LIVN Trend Analysis ➞ | |
 | RPHM Reneo Pharmaceuticals, Inc. |
| Sector: Health Care | |
| SubSector: Biotechnology | |
| MarketCap: 233 Millions | |
| Recent Price: 1.69 Smart Investing & Trading Score: 36 | |
| Day Percent Change: -2.87% Day Change: -0.05 | |
| Week Change: -2.87% Year-to-date Change: 4.3% | |
| RPHM Links: Profile News Message Board | |
| Charts:- Daily , Weekly | |
| Add RPHM to Watchlist: View: Get Complete RPHM Trend Analysis ➞ | |
 | AZN AstraZeneca PLC |
| Sector: Health Care | |
| SubSector: Drug Manufacturers - Major | |
| MarketCap: 113154 Millions | |
| Recent Price: 70.13 Smart Investing & Trading Score: 100 | |
| Day Percent Change: 2.30% Day Change: 1.58 | |
| Week Change: 2.3% Year-to-date Change: 4.1% | |
| AZN Links: Profile News Message Board | |
| Charts:- Daily , Weekly | |
| Add AZN to Watchlist: View: Get Complete AZN Trend Analysis ➞ | |
 | ITCI Intra-Cellular Therapies, Inc. |
| Sector: Health Care | |
| SubSector: Biotechnology | |
| MarketCap: 991.885 Millions | |
| Recent Price: 74.54 Smart Investing & Trading Score: 80 | |
| Day Percent Change: 3.00% Day Change: 2.17 | |
| Week Change: 3% Year-to-date Change: 4.1% | |
| ITCI Links: Profile News Message Board | |
| Charts:- Daily , Weekly | |
| Add ITCI to Watchlist: View: Get Complete ITCI Trend Analysis ➞ | |
 | SGHT Sight Sciences, Inc. |
| Sector: Health Care | |
| SubSector: Medical Devices | |
| MarketCap: 381 Millions | |
| Recent Price: 5.37 Smart Investing & Trading Score: 46 | |
| Day Percent Change: 4.68% Day Change: 0.24 | |
| Week Change: 4.68% Year-to-date Change: 4.0% | |
| SGHT Links: Profile News Message Board | |
| Charts:- Daily , Weekly | |
| Add SGHT to Watchlist: View: Get Complete SGHT Trend Analysis ➞ | |
 | RDY Dr. Reddy s Laboratories Limited |
| Sector: Health Care | |
| SubSector: Drug Manufacturers - Other | |
| MarketCap: 6590.23 Millions | |
| Recent Price: 72.15 Smart Investing & Trading Score: 52 | |
| Day Percent Change: 1.42% Day Change: 1.01 | |
| Week Change: 1.42% Year-to-date Change: 3.7% | |
| RDY Links: Profile News Message Board | |
| Charts:- Daily , Weekly | |
| Add RDY to Watchlist: View: Get Complete RDY Trend Analysis ➞ | |
 | CHE Chemed Corporation |
| Sector: Health Care | |
| SubSector: Home Health Care | |
| MarketCap: 6148.95 Millions | |
| Recent Price: 604.42 Smart Investing & Trading Score: 51 | |
| Day Percent Change: 0.67% Day Change: 4.01 | |
| Week Change: 0.67% Year-to-date Change: 3.4% | |
| CHE Links: Profile News Message Board | |
| Charts:- Daily , Weekly | |
| Add CHE to Watchlist: View: Get Complete CHE Trend Analysis ➞ | |
 | TMO Thermo Fisher Scientific Inc. |
| Sector: Health Care | |
| SubSector: Medical Laboratories & Research | |
| MarketCap: 112999 Millions | |
| Recent Price: 548.38 Smart Investing & Trading Score: 61 | |
| Day Percent Change: 0.66% Day Change: 3.60 | |
| Week Change: 0.66% Year-to-date Change: 3.3% | |
| TMO Links: Profile News Message Board | |
| Charts:- Daily , Weekly | |
| Add TMO to Watchlist: View: Get Complete TMO Trend Analysis ➞ | |
 | SOPH SOPHiA GENETICS SA |
| Sector: Health Care | |
| SubSector: Health Information Services | |
| MarketCap: 278 Millions | |
| Recent Price: 5.01 Smart Investing & Trading Score: 78 | |
| Day Percent Change: 1.01% Day Change: 0.05 | |
| Week Change: 1.01% Year-to-date Change: 3.3% | |
| SOPH Links: Profile News Message Board | |
| Charts:- Daily , Weekly | |
| Add SOPH to Watchlist: View: Get Complete SOPH Trend Analysis ➞ | |
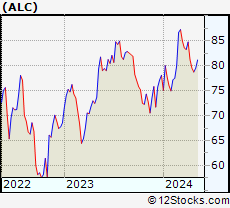 | ALC Alcon, Inc. |
| Sector: Health Care | |
| SubSector: Medical Instruments & Supplies | |
| MarketCap: 20968.1 Millions | |
| Recent Price: 80.61 Smart Investing & Trading Score: 58 | |
| Day Percent Change: 1.33% Day Change: 1.06 | |
| Week Change: 1.33% Year-to-date Change: 3.2% | |
| ALC Links: Profile News Message Board | |
| Charts:- Daily , Weekly | |
| Add ALC to Watchlist: View: Get Complete ALC Trend Analysis ➞ | |
 | INZY Inozyme Pharma, Inc. |
| Sector: Health Care | |
| SubSector: Biotechnology | |
| MarketCap: 53487 Millions | |
| Recent Price: 4.39 Smart Investing & Trading Score: 10 | |
| Day Percent Change: -2.12% Day Change: -0.10 | |
| Week Change: -2.12% Year-to-date Change: 3.2% | |
| INZY Links: Profile News Message Board | |
| Charts:- Daily , Weekly | |
| Add INZY to Watchlist: View: Get Complete INZY Trend Analysis ➞ | |
 | PGEN Precigen, Inc. |
| Sector: Health Care | |
| SubSector: Biotechnology | |
| MarketCap: 564.785 Millions | |
| Recent Price: 1.38 Smart Investing & Trading Score: 45 | |
| Day Percent Change: 3.76% Day Change: 0.05 | |
| Week Change: 3.76% Year-to-date Change: 3.0% | |
| PGEN Links: Profile News Message Board | |
| Charts:- Daily , Weekly | |
| Add PGEN to Watchlist: View: Get Complete PGEN Trend Analysis ➞ | |
 | SUPN Supernus Pharmaceuticals, Inc. |
| Sector: Health Care | |
| SubSector: Drugs - Generic | |
| MarketCap: 833.585 Millions | |
| Recent Price: 29.71 Smart Investing & Trading Score: 68 | |
| Day Percent Change: 1.05% Day Change: 0.31 | |
| Week Change: 1.05% Year-to-date Change: 2.7% | |
| SUPN Links: Profile News Message Board | |
| Charts:- Daily , Weekly | |
| Add SUPN to Watchlist: View: Get Complete SUPN Trend Analysis ➞ | |
 | VBIV VBI Vaccines Inc. |
| Sector: Health Care | |
| SubSector: Biotechnology | |
| MarketCap: 139.785 Millions | |
| Recent Price: 0.60 Smart Investing & Trading Score: 32 | |
| Day Percent Change: -4.84% Day Change: -0.03 | |
| Week Change: -4.84% Year-to-date Change: 2.6% | |
| VBIV Links: Profile News Message Board | |
| Charts:- Daily , Weekly | |
| Add VBIV to Watchlist: View: Get Complete VBIV Trend Analysis ➞ | |
 | REGN Regeneron Pharmaceuticals, Inc. |
| Sector: Health Care | |
| SubSector: Biotechnology | |
| MarketCap: 51903.7 Millions | |
| Recent Price: 900.16 Smart Investing & Trading Score: 25 | |
| Day Percent Change: 0.37% Day Change: 3.34 | |
| Week Change: 0.37% Year-to-date Change: 2.5% | |
| REGN Links: Profile News Message Board | |
| Charts:- Daily , Weekly | |
| Add REGN to Watchlist: View: Get Complete REGN Trend Analysis ➞ | |
 | TCMD Tactile Systems Technology, Inc. |
| Sector: Health Care | |
| SubSector: Medical Instruments & Supplies | |
| MarketCap: 655.96 Millions | |
| Recent Price: 14.65 Smart Investing & Trading Score: 37 | |
| Day Percent Change: 1.74% Day Change: 0.25 | |
| Week Change: 1.74% Year-to-date Change: 2.5% | |
| TCMD Links: Profile News Message Board | |
| Charts:- Daily , Weekly | |
| Add TCMD to Watchlist: View: Get Complete TCMD Trend Analysis ➞ | |
| For tabular summary view of above stock list: Summary View ➞ 0 - 25 , 25 - 50 , 50 - 75 , 75 - 100 , 100 - 125 , 125 - 150 , 150 - 175 , 175 - 200 , 200 - 225 , 225 - 250 , 250 - 275 , 275 - 300 , 300 - 325 , 325 - 350 , 350 - 375 , 375 - 400 , 400 - 425 , 425 - 450 , 450 - 475 , 475 - 500 , 500 - 525 , 525 - 550 , 550 - 575 , 575 - 600 , 600 - 625 , 625 - 650 , 650 - 675 , 675 - 700 , 700 - 725 | ||
| Click To Change The Sort Order: By Market Cap or Company Size Performance: Year-to-date, Week and Day | |
| Select Chart Type: | ||
|
Best Stocks Today 12Stocks.com |
© 2024 12Stocks.com Terms & Conditions Privacy Contact Us
All Information Provided Only For Education And Not To Be Used For Investing or Trading. See Terms & Conditions


One More Thing ... Get Best Stocks Delivered Daily!
Never Ever Miss A Move With Our Top Ten Stocks Lists
Find Best Stocks In Any Market - Bull or Bear Market
Take A Peek At Our Top Ten Stocks Lists: Daily, Weekly, Year-to-Date & Top Trends
Find Best Stocks In Any Market - Bull or Bear Market
Take A Peek At Our Top Ten Stocks Lists: Daily, Weekly, Year-to-Date & Top Trends
Healthcare Stocks With Best Up Trends [0-bearish to 100-bullish]: Fresenius [100], Glaukos [100], AstraZeneca [100], Lantheus [95], Annovis Bio[93], Quest Diagnostics[93], GeneDx [90], Agios [90], Haleon [90], Anika [90], Prestige Consumer[90]
Best Healthcare Stocks Year-to-Date:
Precision BioSciences[2552.05%], Inovio [1864.71%], Assembly Biosciences[1512%], Adverum Biotechnologies[1406.38%], NuCana [1231.98%], Aurora Cannabis[1218.77%], Affimed N.V[700%], Agenus [596.94%], CareMax [561.86%], Corbus [524.17%], Mesoblast [402.73%] Best Healthcare Stocks This Week:
ProKidney [33.33%], MSP Recovery[28.69%], CareMax [24.9%], BeyondSpring [17.22%], Molecular Partners[16.87%], ArTara [16.41%], Regencell Bioscience[16.04%], OptiNose [15.07%], Annovis Bio[14.9%], Seres [11.56%], Cara [10.5%] Best Healthcare Stocks Daily:
ProKidney [33.33%], MSP Recovery[28.69%], CareMax [24.90%], BeyondSpring [17.22%], Molecular Partners[16.87%], ArTara [16.41%], Regencell Bioscience[16.04%], OptiNose [15.07%], Annovis Bio[14.90%], Seres [11.56%], Cara [10.50%]