
 Login Sign Up


| |||||
 |  | ||||

| 12Stocks.com Market Intelligence |
Best Healthcare Stocks
 | "Discover best trending healthcare stocks with 12Stocks.com." |
| - Subu Vdaygiri, Founder, 12Stocks.com |
| In a hurry? Healthcare Stocks Lists: Performance Trends Table, Stock Charts
Sort Healthcare stocks: Daily, Weekly, Year-to-Date, Market Cap & Trends. Filter Healthcare stocks list by size:All Healthcare Large Mid-Range Small |
| 12Stocks.com Healthcare Stocks Performances & Trends Daily | |||||||||
|
|  The overall Smart Investing & Trading Score is 83 (0-bearish to 100-bullish) which puts Healthcare sector in short term bullish trend. The Smart Investing & Trading Score from previous trading session is 88 and a deterioration of trend continues.
| ||||||||
Here are the Smart Investing & Trading Scores of the most requested Healthcare stocks at 12Stocks.com (click stock name for detailed review):
|


| 12Stocks.com: Investing in Healthcare sector with Stocks | |
|
The following table helps investors and traders sort through current performance and trends (as measured by Smart Investing & Trading Score) of various
stocks in the Healthcare sector. Quick View: Move mouse or cursor over stock symbol (ticker) to view short-term Technical chart and over stock name to view long term chart. Click on  to add stock symbol to your watchlist and to add stock symbol to your watchlist and  to view watchlist. Click on any ticker or stock name for detailed market intelligence report for that stock. to view watchlist. Click on any ticker or stock name for detailed market intelligence report for that stock. |
12Stocks.com Performance of Stocks in Healthcare Sector
| Ticker | Stock Name | Watchlist | Category | Recent Price | Smart Investing & Trading Score | Change % | YTD Change% |
| PTGX | Protagonist |   | Biotechnology | 31.74 | 75 | 1.54% | 38.42% |
| FBIOP | Fortress Biotech | | Biotechnology | 16.43 | 59 | 0.00% | 38.37% |
| TYRA | Tyra Biosciences | | Biotechnology | 18.37 | 27 | -1.87% | 37.81% |
| LLY | Eli Lilly | | Pharmaceutical | 803.17 | 95 | 2.55% | 37.78% |
| LYEL | Lyell Immunopharma | | Biotechnology | 2.69 | 42 | 0.94% | 37.15% |
| OCUL | Ocular Therapeutix | | Biotechnology | 6.11 | 25 | -2.86% | 37.00% |
| SLN | Silence | | Biotechnology | 24.00 | 69 | 2.78% | 36.71% |
| GKOS | Glaukos | | Instruments | 108.53 | 58 | -0.68% | 36.53% |
| STAA | STAAR Surgical | | Instruments | 42.51 | 61 | -0.68% | 36.21% |
| ADAP | Adaptimmune | | Biotechnology | 1.08 | 10 | -1.82% | 36.19% |
| CRMD | CorMedix | | Biotechnology | 5.08 | 46 | 0.59% | 35.11% |
| SIGA | SIGA Technologies | | Biotechnology | 7.55 | 46 | 0.00% | 34.82% |
| ATRA | Atara Bio | | Biotechnology | 0.69 | 74 | -2.77% | 34.61% |
| XOMA | XOMA | | Biotechnology | 24.90 | 61 | -0.52% | 34.59% |
| KRYS | Krystal Biotech | | Biotechnology | 166.82 | 73 | 1.44% | 34.46% |
| IMMP | Immutep | | Biotechnology | 3.23 | 100 | 4.03% | 34.38% |
| FGEN | FibroGen | | Biotechnology | 1.19 | 50 | -0.83% | 34.27% |
| SRPT | Sarepta | | Biotechnology | 129.24 | 23 | -1.22% | 34.02% |
| AHCO | AdaptHealth | | Equipment | 9.77 | 17 | -1.21% | 34.02% |
| BLFS | BioLife | | Instruments | 21.76 | 68 | -0.32% | 33.91% |
| CRON | Cronos | | Biotechnology | 2.78 | 46 | 0.00% | 33.01% |
| ENTA | Enanta | | Biotechnology | 12.49 | 27 | 0.16% | 32.73% |
| DVA | DaVita | | Specialized | 138.69 | 75 | -1.59% | 32.39% |
| BSX | Boston Scientific | | Equipment | 75.67 | 100 | 0.41% | 30.89% |
| NVO | Novo Nordisk | | Biotechnology | 135.16 | 90 | 1.69% | 30.65% |
| For chart view version of above stock list: Chart View ➞ 0 - 25 , 25 - 50 , 50 - 75 , 75 - 100 , 100 - 125 , 125 - 150 , 150 - 175 , 175 - 200 , 200 - 225 , 225 - 250 , 250 - 275 , 275 - 300 , 300 - 325 , 325 - 350 , 350 - 375 , 375 - 400 , 400 - 425 , 425 - 450 , 450 - 475 , 475 - 500 , 500 - 525 , 525 - 550 , 550 - 575 , 575 - 600 , 600 - 625 , 625 - 650 , 650 - 675 , 675 - 700 , 700 - 725 | ||
 | Click To Change The Sort Order: By Market Cap or Company Size Performance: Year-to-date, Week and Day |  |
|
Get the most comprehensive stock market coverage daily at 12Stocks.com ➞ Best Stocks Today ➞ Best Stocks Weekly ➞ Best Stocks Year-to-Date ➞ Best Stocks Trends ➞  Best Stocks Today 12Stocks.com Best Nasdaq Stocks ➞ Best S&P 500 Stocks ➞ Best Tech Stocks ➞ Best Biotech Stocks ➞ |
| Detailed Overview of Healthcare Stocks |
| Healthcare Technical Overview, Leaders & Laggards, Top Healthcare ETF Funds & Detailed Healthcare Stocks List, Charts, Trends & More |
| Healthcare Sector: Technical Analysis, Trends & YTD Performance | |
| Healthcare sector is composed of stocks
from pharmaceutical, biotech, diagnostics labs, insurance providers
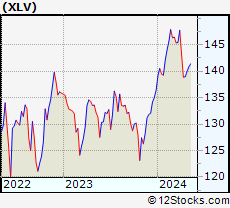
and healthcare services. Healthcare sector, as represented by XLV, an exchange-traded fund [ETF] that holds basket of Healthcare stocks (e.g, Merck, Amgen) is up by 7.24% and is currently underperforming the overall market by -3.67% year-to-date. Below is a quick view of Technical charts and trends: |
|
 XLV Weekly Chart |
|
| Long Term Trend: Very Good | |
| Medium Term Trend: Very Good | |
 XLV Daily Chart |
|
| Short Term Trend: Not Good | |
| Overall Trend Score: 83 | |
| YTD Performance: 7.24% | |
| **Trend Scores & Views Are Only For Educational Purposes And Not For Investing | |
| 12Stocks.com: Top Performing Healthcare Sector Stocks | ||||||||||||||||||||||||||||||||||||||||||||||||
 The top performing Healthcare sector stocks year to date are
Now, more recently, over last week, the top performing Healthcare sector stocks on the move are


|
||||||||||||||||||||||||||||||||||||||||||||||||
| 12Stocks.com: Investing in Healthcare Sector using Exchange Traded Funds | |
|
The following table shows list of key exchange traded funds (ETF) that
help investors track Healthcare Index. For detailed view, check out our ETF Funds section of our website. Quick View: Move mouse or cursor over ETF symbol (ticker) to view short-term Technical chart and over ETF name to view long term chart. Click on ticker or stock name for detailed view. Click on to add stock symbol to your watchlist and to view watchlist. |
12Stocks.com List of ETFs that track Healthcare Index
| Ticker | ETF Name | Watchlist | Recent Price | Smart Investing & Trading Score | Change % | Week % | Year-to-date % |
| XLV | Health Care | | 146.25 | 83 | 0.17 | -0.04 | 7.24% |
| XBI | Biotech | | 91.57 | 45 | -0.76 | 0.43 | 2.55% |
| IBB | Biotechnology | | 136.86 | 70 | -0.47 | 0.12 | 0.74% |
| BBH | Biotech | | 168.04 | 83 | -0.33 | 0.03 | 1.65% |
| VHT | Health Care | | 266.91 | 67 | 0.02 | -0.07 | 6.47% |
| IYH | Healthcare | | 61.39 | 62 | 0.24 | 0.08 | 7.24% |
| IHF | Healthcare Providers | | 53.71 | 76 | 0.32 | -0.37 | 2.29% |
| IHI | Medical Devices | | 56.36 | 30 | -0.16 | -0.58 | 4.43% |
| BIB | Biotechnology | | 57.88 | 63 | -0.02 | 1.62 | 1.45% |
| BIS | Short Biotech | | 17.32 | 18 | -0.06 | -1.53 | -4.15% |
| XHE | Health Care Equipment | | 86.97 | 61 | -0.61 | -0.55 | 3.22% |
| CURE | Healthcare Bull 3X | | 118.20 | 70 | -0.04 | -0.76 | 16.18% |
| LABU | Biotech Bull 3X | | 113.12 | 32 | -2.31 | 1.19 | -7.26% |
| LABD | Biotech Bear 3X | | 7.83 | 61 | 2.09 | -1.51 | -19.2% |
| PSCH | SmallCap Health Care | | 43.44 | 56 | -0.02 | 0.1 | 1.5% |
| XHS | Health Care Services | | 91.28 | 73 | -0.65 | -0.29 | 2.62% |
| PTH | DWA Healthcare Momentum | | 43.07 | 35 | -0.09 | 1.03 | 10.04% |
| BTEC | Principal Healthcare Innovators | | 36.83 | 28 | -0.30 | 0.96 | 1.38% |
| RXL | Health Care | | 103.09 | 83 | 0.19 | 0.32 | 12.79% |
| RXD | Short Health Care | | 10.57 | 25 | 0.00 | 0.07 | -11.36% |
| 12Stocks.com: Charts, Trends, Fundamental Data and Performances of Healthcare Stocks | |
|
We now take in-depth look at all Healthcare stocks including charts, multi-period performances and overall trends (as measured by Smart Investing & Trading Score). One can sort Healthcare stocks (click link to choose) by Daily, Weekly and by Year-to-Date performances. Also, one can sort by size of the company or by market capitalization. |
| Select Your Default Chart Type: | |||||
| |||||
| Click on stock symbol or name for detailed view. Click on to add stock symbol to your watchlist and to view watchlist. Quick View: Move mouse or cursor over "Daily" to quickly view daily Technical stock chart and over "Weekly" to view weekly Technical stock chart. | |||||

 | PTGX Protagonist Therapeutics, Inc. |
| Sector: Health Care | |
| SubSector: Biotechnology | |
| MarketCap: 165.285 Millions | |
| Recent Price: 31.74 Smart Investing & Trading Score: 75 | |
| Day Percent Change: 1.54% Day Change: 0.48 | |
| Week Change: 3.25% Year-to-date Change: 38.4% | |
| PTGX Links: Profile News Message Board | |
| Charts:- Daily , Weekly | |
| Add PTGX to Watchlist: View: Get Complete PTGX Trend Analysis ➞ | |
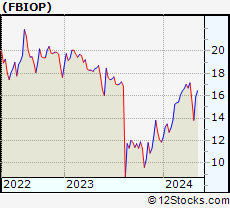 | FBIOP Fortress Biotech, Inc. |
| Sector: Health Care | |
| SubSector: Biotechnology | |
| MarketCap: 836.085 Millions | |
| Recent Price: 16.43 Smart Investing & Trading Score: 59 | |
| Day Percent Change: 0.00% Day Change: 0.00 | |
| Week Change: -1.47% Year-to-date Change: 38.4% | |
| FBIOP Links: Profile News Message Board | |
| Charts:- Daily , Weekly | |
| Add FBIOP to Watchlist: View: Get Complete FBIOP Trend Analysis ➞ | |
 | TYRA Tyra Biosciences, Inc. |
| Sector: Health Care | |
| SubSector: Biotechnology | |
| MarketCap: 732 Millions | |
| Recent Price: 18.37 Smart Investing & Trading Score: 27 | |
| Day Percent Change: -1.87% Day Change: -0.35 | |
| Week Change: 0.6% Year-to-date Change: 37.8% | |
| TYRA Links: Profile News Message Board | |
| Charts:- Daily , Weekly | |
| Add TYRA to Watchlist: View: Get Complete TYRA Trend Analysis ➞ | |
 | LLY Eli Lilly and Company |
| Sector: Health Care | |
| SubSector: Drug Manufacturers - Major | |
| MarketCap: 130066 Millions | |
| Recent Price: 803.17 Smart Investing & Trading Score: 95 | |
| Day Percent Change: 2.55% Day Change: 19.99 | |
| Week Change: 4.31% Year-to-date Change: 37.8% | |
| LLY Links: Profile News Message Board | |
| Charts:- Daily , Weekly | |
| Add LLY to Watchlist: View: Get Complete LLY Trend Analysis ➞ | |
 | LYEL Lyell Immunopharma, Inc. |
| Sector: Health Care | |
| SubSector: Biotechnology | |
| MarketCap: 809 Millions | |
| Recent Price: 2.69 Smart Investing & Trading Score: 42 | |
| Day Percent Change: 0.94% Day Change: 0.02 | |
| Week Change: -1.64% Year-to-date Change: 37.2% | |
| LYEL Links: Profile News Message Board | |
| Charts:- Daily , Weekly | |
| Add LYEL to Watchlist: View: Get Complete LYEL Trend Analysis ➞ | |
 | OCUL Ocular Therapeutix, Inc. |
| Sector: Health Care | |
| SubSector: Biotechnology | |
| MarketCap: 249.985 Millions | |
| Recent Price: 6.11 Smart Investing & Trading Score: 25 | |
| Day Percent Change: -2.86% Day Change: -0.18 | |
| Week Change: -0.97% Year-to-date Change: 37.0% | |
| OCUL Links: Profile News Message Board | |
| Charts:- Daily , Weekly | |
| Add OCUL to Watchlist: View: Get Complete OCUL Trend Analysis ➞ | |
 | SLN Silence Therapeutics plc |
| Sector: Health Care | |
| SubSector: Biotechnology | |
| MarketCap: 198 Millions | |
| Recent Price: 24.00 Smart Investing & Trading Score: 69 | |
| Day Percent Change: 2.78% Day Change: 0.65 | |
| Week Change: 4.35% Year-to-date Change: 36.7% | |
| SLN Links: Profile News Message Board | |
| Charts:- Daily , Weekly | |
| Add SLN to Watchlist: View: Get Complete SLN Trend Analysis ➞ | |
 | GKOS Glaukos Corporation |
| Sector: Health Care | |
| SubSector: Medical Instruments & Supplies | |
| MarketCap: 1103.6 Millions | |
| Recent Price: 108.53 Smart Investing & Trading Score: 58 | |
| Day Percent Change: -0.68% Day Change: -0.74 | |
| Week Change: -1.15% Year-to-date Change: 36.5% | |
| GKOS Links: Profile News Message Board | |
| Charts:- Daily , Weekly | |
| Add GKOS to Watchlist: View: Get Complete GKOS Trend Analysis ➞ | |
 | STAA STAAR Surgical Company |
| Sector: Health Care | |
| SubSector: Medical Instruments & Supplies | |
| MarketCap: 1334.6 Millions | |
| Recent Price: 42.51 Smart Investing & Trading Score: 61 | |
| Day Percent Change: -0.68% Day Change: -0.29 | |
| Week Change: -0.44% Year-to-date Change: 36.2% | |
| STAA Links: Profile News Message Board | |
| Charts:- Daily , Weekly | |
| Add STAA to Watchlist: View: Get Complete STAA Trend Analysis ➞ | |
 | ADAP Adaptimmune Therapeutics plc |
| Sector: Health Care | |
| SubSector: Biotechnology | |
| MarketCap: 380.985 Millions | |
| Recent Price: 1.08 Smart Investing & Trading Score: 10 | |
| Day Percent Change: -1.82% Day Change: -0.02 | |
| Week Change: -2.7% Year-to-date Change: 36.2% | |
| ADAP Links: Profile News Message Board | |
| Charts:- Daily , Weekly | |
| Add ADAP to Watchlist: View: Get Complete ADAP Trend Analysis ➞ | |
 | CRMD CorMedix, Inc. |
| Sector: Health Care | |
| SubSector: Biotechnology | |
| MarketCap: 90.7785 Millions | |
| Recent Price: 5.08 Smart Investing & Trading Score: 46 | |
| Day Percent Change: 0.59% Day Change: 0.03 | |
| Week Change: -1.93% Year-to-date Change: 35.1% | |
| CRMD Links: Profile News Message Board | |
| Charts:- Daily , Weekly | |
| Add CRMD to Watchlist: View: Get Complete CRMD Trend Analysis ➞ | |
 | SIGA SIGA Technologies, Inc. |
| Sector: Health Care | |
| SubSector: Biotechnology | |
| MarketCap: 424.285 Millions | |
| Recent Price: 7.55 Smart Investing & Trading Score: 46 | |
| Day Percent Change: 0.00% Day Change: 0.00 | |
| Week Change: -0.79% Year-to-date Change: 34.8% | |
| SIGA Links: Profile News Message Board | |
| Charts:- Daily , Weekly | |
| Add SIGA to Watchlist: View: Get Complete SIGA Trend Analysis ➞ | |
 | ATRA Atara Biotherapeutics, Inc. |
| Sector: Health Care | |
| SubSector: Biotechnology | |
| MarketCap: 579.185 Millions | |
| Recent Price: 0.69 Smart Investing & Trading Score: 74 | |
| Day Percent Change: -2.77% Day Change: -0.02 | |
| Week Change: 13.16% Year-to-date Change: 34.6% | |
| ATRA Links: Profile News Message Board | |
| Charts:- Daily , Weekly | |
| Add ATRA to Watchlist: View: Get Complete ATRA Trend Analysis ➞ | |
 | XOMA XOMA Corporation |
| Sector: Health Care | |
| SubSector: Biotechnology | |
| MarketCap: 174.885 Millions | |
| Recent Price: 24.90 Smart Investing & Trading Score: 61 | |
| Day Percent Change: -0.52% Day Change: -0.13 | |
| Week Change: -2.96% Year-to-date Change: 34.6% | |
| XOMA Links: Profile News Message Board | |
| Charts:- Daily , Weekly | |
| Add XOMA to Watchlist: View: Get Complete XOMA Trend Analysis ➞ | |
 | KRYS Krystal Biotech, Inc. |
| Sector: Health Care | |
| SubSector: Biotechnology | |
| MarketCap: 874.085 Millions | |
| Recent Price: 166.82 Smart Investing & Trading Score: 73 | |
| Day Percent Change: 1.44% Day Change: 2.37 | |
| Week Change: 1.65% Year-to-date Change: 34.5% | |
| KRYS Links: Profile News Message Board | |
| Charts:- Daily , Weekly | |
| Add KRYS to Watchlist: View: Get Complete KRYS Trend Analysis ➞ | |
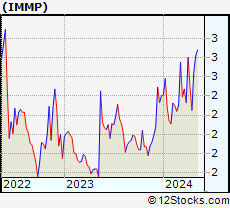 | IMMP Immutep Limited |
| Sector: Health Care | |
| SubSector: Biotechnology | |
| MarketCap: 71.5785 Millions | |
| Recent Price: 3.23 Smart Investing & Trading Score: 100 | |
| Day Percent Change: 4.03% Day Change: 0.13 | |
| Week Change: 8.95% Year-to-date Change: 34.4% | |
| IMMP Links: Profile News Message Board | |
| Charts:- Daily , Weekly | |
| Add IMMP to Watchlist: View: Get Complete IMMP Trend Analysis ➞ | |
 | FGEN FibroGen, Inc. |
| Sector: Health Care | |
| SubSector: Biotechnology | |
| MarketCap: 2502.95 Millions | |
| Recent Price: 1.19 Smart Investing & Trading Score: 50 | |
| Day Percent Change: -0.83% Day Change: -0.01 | |
| Week Change: -0.83% Year-to-date Change: 34.3% | |
| FGEN Links: Profile News Message Board | |
| Charts:- Daily , Weekly | |
| Add FGEN to Watchlist: View: Get Complete FGEN Trend Analysis ➞ | |
 | SRPT Sarepta Therapeutics, Inc. |
| Sector: Health Care | |
| SubSector: Biotechnology | |
| MarketCap: 7388.05 Millions | |
| Recent Price: 129.24 Smart Investing & Trading Score: 23 | |
| Day Percent Change: -1.22% Day Change: -1.59 | |
| Week Change: -1.63% Year-to-date Change: 34.0% | |
| SRPT Links: Profile News Message Board | |
| Charts:- Daily , Weekly | |
| Add SRPT to Watchlist: View: Get Complete SRPT Trend Analysis ➞ | |
 | AHCO AdaptHealth Corp. |
| Sector: Health Care | |
| SubSector: Medical Appliances & Equipment | |
| MarketCap: 1084.8 Millions | |
| Recent Price: 9.77 Smart Investing & Trading Score: 17 | |
| Day Percent Change: -1.21% Day Change: -0.12 | |
| Week Change: -2.1% Year-to-date Change: 34.0% | |
| AHCO Links: Profile News Message Board | |
| Charts:- Daily , Weekly | |
| Add AHCO to Watchlist: View: Get Complete AHCO Trend Analysis ➞ | |
 | BLFS BioLife Solutions, Inc. |
| Sector: Health Care | |
| SubSector: Medical Instruments & Supplies | |
| MarketCap: 264.36 Millions | |
| Recent Price: 21.76 Smart Investing & Trading Score: 68 | |
| Day Percent Change: -0.32% Day Change: -0.07 | |
| Week Change: -0.91% Year-to-date Change: 33.9% | |
| BLFS Links: Profile News Message Board | |
| Charts:- Daily , Weekly | |
| Add BLFS to Watchlist: View: Get Complete BLFS Trend Analysis ➞ | |
 | CRON Cronos Group Inc. |
| Sector: Health Care | |
| SubSector: Biotechnology | |
| MarketCap: 1935.95 Millions | |
| Recent Price: 2.78 Smart Investing & Trading Score: 46 | |
| Day Percent Change: 0.00% Day Change: 0.00 | |
| Week Change: -4.14% Year-to-date Change: 33.0% | |
| CRON Links: Profile News Message Board | |
| Charts:- Daily , Weekly | |
| Add CRON to Watchlist: View: Get Complete CRON Trend Analysis ➞ | |
 | ENTA Enanta Pharmaceuticals, Inc. |
| Sector: Health Care | |
| SubSector: Biotechnology | |
| MarketCap: 998.385 Millions | |
| Recent Price: 12.49 Smart Investing & Trading Score: 27 | |
| Day Percent Change: 0.16% Day Change: 0.02 | |
| Week Change: 2.97% Year-to-date Change: 32.7% | |
| ENTA Links: Profile News Message Board | |
| Charts:- Daily , Weekly | |
| Add ENTA to Watchlist: View: Get Complete ENTA Trend Analysis ➞ | |
 | DVA DaVita Inc. |
| Sector: Health Care | |
| SubSector: Specialized Health Services | |
| MarketCap: 8954.36 Millions | |
| Recent Price: 138.69 Smart Investing & Trading Score: 75 | |
| Day Percent Change: -1.59% Day Change: -2.24 | |
| Week Change: -0.81% Year-to-date Change: 32.4% | |
| DVA Links: Profile News Message Board | |
| Charts:- Daily , Weekly | |
| Add DVA to Watchlist: View: Get Complete DVA Trend Analysis ➞ | |
 | BSX Boston Scientific Corporation |
| Sector: Health Care | |
| SubSector: Medical Appliances & Equipment | |
| MarketCap: 41541.2 Millions | |
| Recent Price: 75.67 Smart Investing & Trading Score: 100 | |
| Day Percent Change: 0.41% Day Change: 0.31 | |
| Week Change: 1.37% Year-to-date Change: 30.9% | |
| BSX Links: Profile News Message Board | |
| Charts:- Daily , Weekly | |
| Add BSX to Watchlist: View: Get Complete BSX Trend Analysis ➞ | |
 | NVO Novo Nordisk A/S |
| Sector: Health Care | |
| SubSector: Biotechnology | |
| MarketCap: 100744 Millions | |
| Recent Price: 135.16 Smart Investing & Trading Score: 90 | |
| Day Percent Change: 1.69% Day Change: 2.25 | |
| Week Change: 2.48% Year-to-date Change: 30.7% | |
| NVO Links: Profile News Message Board | |
| Charts:- Daily , Weekly | |
| Add NVO to Watchlist: View: Get Complete NVO Trend Analysis ➞ | |
| For tabular summary view of above stock list: Summary View ➞ 0 - 25 , 25 - 50 , 50 - 75 , 75 - 100 , 100 - 125 , 125 - 150 , 150 - 175 , 175 - 200 , 200 - 225 , 225 - 250 , 250 - 275 , 275 - 300 , 300 - 325 , 325 - 350 , 350 - 375 , 375 - 400 , 400 - 425 , 425 - 450 , 450 - 475 , 475 - 500 , 500 - 525 , 525 - 550 , 550 - 575 , 575 - 600 , 600 - 625 , 625 - 650 , 650 - 675 , 675 - 700 , 700 - 725 | ||
| Click To Change The Sort Order: By Market Cap or Company Size Performance: Year-to-date, Week and Day | |
| Select Chart Type: | ||
|
Best Stocks Today 12Stocks.com |
© 2024 12Stocks.com Terms & Conditions Privacy Contact Us
All Information Provided Only For Education And Not To Be Used For Investing or Trading. See Terms & Conditions


One More Thing ... Get Best Stocks Delivered Daily!
Never Ever Miss A Move With Our Top Ten Stocks Lists
Find Best Stocks In Any Market - Bull or Bear Market
Take A Peek At Our Top Ten Stocks Lists: Daily, Weekly, Year-to-Date & Top Trends
Find Best Stocks In Any Market - Bull or Bear Market
Take A Peek At Our Top Ten Stocks Lists: Daily, Weekly, Year-to-Date & Top Trends
Healthcare Stocks With Best Up Trends [0-bearish to 100-bullish]: Third Harmonic[100], Concord [100], Brainstorm Cell[100], Arbutus Biopharma[100], Tandem Diabetes[100], PureTech Health[100], Genfit SA[100], Heron [100], Integer [100], Vericel [100], Boston Scientific[100]
Best Healthcare Stocks Year-to-Date:
Pieris [6042.86%], Precision BioSciences[3472.6%], Avenue [2266.46%], Inovio [2052.94%], Assembly Biosciences[1717.46%], Aurora Cannabis[1398.32%], Agenus [1240.74%], NuCana [1103.52%], Adverum Biotechnologies[949.42%], Affimed N.V[716%], Burning Rock[690.76%] Best Healthcare Stocks This Week:
DURECT [38.14%], Genelux [31.78%], Concord [29.19%], iBio [27.37%], Nobilis Health[26.23%], Pulse Biosciences[24.58%], Scilex Holding[22.22%], Dyne [17.81%], PTC [17.45%], Accelerate Diagnostics[17.35%], CareMax [16.61%] Best Healthcare Stocks Daily:
DURECT [25.00%], Accelerate Diagnostics[17.96%], CareMax [17.83%], RAPT [15.00%], Pulse Biosciences[13.40%], Genelux [11.86%], Relay [11.58%], Sol-Gel Technologies[10.62%], iBio [9.30%], Vaxxinity [9.30%], Third Harmonic[8.54%]