
 Login Sign Up


| |||||
 |  | ||||

| 12Stocks.com Market Intelligence |
Best Healthcare Stocks
 | "Discover best trending healthcare stocks with 12Stocks.com." |
| - Subu Vdaygiri, Founder, 12Stocks.com |
| In a hurry? Healthcare Stocks Lists: Performance Trends Table, Stock Charts
Sort Healthcare stocks: Daily, Weekly, Year-to-Date, Market Cap & Trends. Filter Healthcare stocks list by size:All Healthcare Large Mid-Range Small |
| 12Stocks.com Healthcare Stocks Performances & Trends Daily | |||||||||
|
|  The overall Smart Investing & Trading Score is 38 (0-bearish to 100-bullish) which puts Healthcare sector in short term bearish to neutral trend. The Smart Investing & Trading Score from previous trading session is 52 and hence a deterioration of trend.
| ||||||||
Here are the Smart Investing & Trading Scores of the most requested Healthcare stocks at 12Stocks.com (click stock name for detailed review):
|


| 12Stocks.com: Investing in Healthcare sector with Stocks | |
|
The following table helps investors and traders sort through current performance and trends (as measured by Smart Investing & Trading Score) of various
stocks in the Healthcare sector. Quick View: Move mouse or cursor over stock symbol (ticker) to view short-term Technical chart and over stock name to view long term chart. Click on  to add stock symbol to your watchlist and to add stock symbol to your watchlist and  to view watchlist. Click on any ticker or stock name for detailed market intelligence report for that stock. to view watchlist. Click on any ticker or stock name for detailed market intelligence report for that stock. |
12Stocks.com Performance of Stocks in Healthcare Sector
| Ticker | Stock Name | Watchlist | Category | Recent Price | Smart Investing & Trading Score | Change % | YTD Change% |
| ARAY | Accuray |   | Equipment | 2.18 | 25 | -0.91% | -22.97% |
| ENZ | Enzo Biochem | | Laboratories | 1.07 | 28 | 0.94% | -23.02% |
| ARVN | Arvinas | | Biotechnology | 31.60 | 10 | -2.89% | -23.23% |
| BVS | Bioventus | | Medical Devices | 4.06 | 10 | -2.75% | -23.25% |
| UBX | Unity Biotechnology | | Biotechnology | 1.48 | 10 | 0.68% | -23.32% |
| CLPT | ClearPoint Neuro | | Equipment | 5.22 | 10 | -2.06% | -23.40% |
| INMD | InMode | | Equipment | 17.03 | 10 | -1.90% | -23.43% |
| PRVA | Privia Health | | Health Information | 17.99 | 15 | -2.73% | -23.87% |
| TLRY | Tilray | | Pharmaceutical | 1.75 | 30 | -4.89% | -23.91% |
| BWAY | Brainsway | | Laboratories | 4.92 | 35 | -2.19% | -24.07% |
| RIGL | Rigel | | Biotechnology | 1.10 | 25 | -2.22% | -24.14% |
| VIR | Vir Biotechnology | | Biotechnology | 7.63 | 20 | -5.10% | -24.16% |
| ACCD | Accolade | | Health Information | 9.10 | 17 | -3.19% | -24.29% |
| PODD | Insulet | | Instruments | 164.17 | 53 | -1.84% | -24.34% |
| PCRX | Pacira BioSciences | | Pharmaceutical | 25.50 | 20 | -1.54% | -24.42% |
| TRDA | Entrada | | Biotechnology | 12.36 | 35 | -1.44% | -24.68% |
| VIGL | Vigil Neuroscience | | Biotechnology | 2.58 | 46 | -7.86% | -24.78% |
| ALNY | Alnylam | | Biotechnology | 143.71 | 18 | -0.06% | -24.92% |
| VOR | Vor Biopharma | | Biotechnology | 1.67 | 30 | -4.58% | -25.00% |
| SRRK | Scholar Rock | | Biotechnology | 13.98 | 76 | -0.78% | -25.64% |
| ZURA | Zura Bio | | Biotechnology | 3.48 | 68 | 6.75% | -25.72% |
| GOSS | Gossamer Bio | | Biotechnology | 0.68 | 35 | -4.42% | -25.81% |
| TNGX | Tango | | Biotechnology | 7.33 | 57 | -5.54% | -25.96% |
| ETNB | 89bio | | Biotechnology | 8.26 | 10 | -3.79% | -26.10% |
| RCKT | Rocket | | Biotechnology | 22.13 | 20 | -6.35% | -26.16% |
| For chart view version of above stock list: Chart View ➞ 0 - 25 , 25 - 50 , 50 - 75 , 75 - 100 , 100 - 125 , 125 - 150 , 150 - 175 , 175 - 200 , 200 - 225 , 225 - 250 , 250 - 275 , 275 - 300 , 300 - 325 , 325 - 350 , 350 - 375 , 375 - 400 , 400 - 425 , 425 - 450 , 450 - 475 , 475 - 500 , 500 - 525 , 525 - 550 , 550 - 575 , 575 - 600 , 600 - 625 , 625 - 650 , 650 - 675 , 675 - 700 , 700 - 725 | ||
 | Click To Change The Sort Order: By Market Cap or Company Size Performance: Year-to-date, Week and Day |  |
|
Get the most comprehensive stock market coverage daily at 12Stocks.com ➞ Best Stocks Today ➞ Best Stocks Weekly ➞ Best Stocks Year-to-Date ➞ Best Stocks Trends ➞  Best Stocks Today 12Stocks.com Best Nasdaq Stocks ➞ Best S&P 500 Stocks ➞ Best Tech Stocks ➞ Best Biotech Stocks ➞ |
| Detailed Overview of Healthcare Stocks |
| Healthcare Technical Overview, Leaders & Laggards, Top Healthcare ETF Funds & Detailed Healthcare Stocks List, Charts, Trends & More |
| Healthcare Sector: Technical Analysis, Trends & YTD Performance | |
| Healthcare sector is composed of stocks
from pharmaceutical, biotech, diagnostics labs, insurance providers
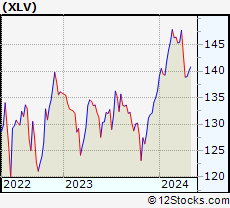
and healthcare services. Healthcare sector, as represented by XLV, an exchange-traded fund [ETF] that holds basket of Healthcare stocks (e.g, Merck, Amgen) is up by 2.6% and is currently underperforming the overall market by -2.56% year-to-date. Below is a quick view of Technical charts and trends: |
|
 XLV Weekly Chart |
|
| Long Term Trend: Not Good | |
| Medium Term Trend: Not Good | |
 XLV Daily Chart |
|
| Short Term Trend: Very Good | |
| Overall Trend Score: 38 | |
| YTD Performance: 2.6% | |
| **Trend Scores & Views Are Only For Educational Purposes And Not For Investing | |
| 12Stocks.com: Top Performing Healthcare Sector Stocks | ||||||||||||||||||||||||||||||||||||||||||||||||
 The top performing Healthcare sector stocks year to date are
Now, more recently, over last week, the top performing Healthcare sector stocks on the move are


|
||||||||||||||||||||||||||||||||||||||||||||||||
| 12Stocks.com: Investing in Healthcare Sector using Exchange Traded Funds | |
|
The following table shows list of key exchange traded funds (ETF) that
help investors track Healthcare Index. For detailed view, check out our ETF Funds section of our website. Quick View: Move mouse or cursor over ETF symbol (ticker) to view short-term Technical chart and over ETF name to view long term chart. Click on ticker or stock name for detailed view. Click on to add stock symbol to your watchlist and to view watchlist. |
12Stocks.com List of ETFs that track Healthcare Index
| Ticker | ETF Name | Watchlist | Recent Price | Smart Investing & Trading Score | Change % | Week % | Year-to-date % |
| XLV | Health Care | | 139.92 | 38 | -0.67 | 0.7 | 2.6% |
| XBI | Biotech | | 82.22 | 25 | -2.05 | -0.74 | -7.92% |
| IBB | Biotechnology | | 125.67 | 18 | -1.64 | 0.76 | -7.49% |
| BBH | Biotech | | 154.61 | 49 | -1.73 | 1.48 | -6.47% |
| VHT | Health Care | | 255.24 | 45 | -0.79 | 0.75 | 1.81% |
| IYH | Healthcare | | 58.68 | 45 | -0.69 | 0.89 | 2.5% |
| IHF | Healthcare Providers | | 52.11 | 55 | -0.29 | -0.19 | -0.76% |
| IHI | Medical Devices | | 55.27 | 43 | -0.66 | 1.67 | 2.41% |
| BIB | Biotechnology | | 48.83 | 32 | -2.69 | 1.31 | -14.41% |
| BIS | Short Biotech | | 20.59 | 61 | 2.49 | -1.46 | 13.95% |
| XHE | Health Care Equipment | | 81.77 | 28 | -1.73 | 0.62 | -2.96% |
| CURE | Healthcare Bull 3X | | 105.32 | 25 | -2.35 | 1.92 | 3.52% |
| LABU | Biotech Bull 3X | | 83.72 | 25 | -6.35 | -2.71 | -31.36% |
| LABD | Biotech Bear 3X | | 11.03 | 75 | 6.36 | 2.13 | 13.83% |
| PSCH | SmallCap Health Care | | 40.31 | 35 | -1.98 | 0.32 | -5.82% |
| XHS | Health Care Services | | 87.68 | 68 | -1.15 | 0.68 | -1.43% |
| PTH | DWA Healthcare Momentum | | 39.60 | 46 | -0.08 | 0.18 | 1.18% |
| BTEC | Principal Healthcare Innovators | | 34.21 | 32 | 0.02 | 1.04 | -5.83% |
| RXL | Health Care | | 94.52 | 17 | -1.55 | 1.39 | 3.41% |
| RXD | Short Health Care | | 11.46 | 71 | 0.98 | -1.59 | -3.94% |
| 12Stocks.com: Charts, Trends, Fundamental Data and Performances of Healthcare Stocks | |
|
We now take in-depth look at all Healthcare stocks including charts, multi-period performances and overall trends (as measured by Smart Investing & Trading Score). One can sort Healthcare stocks (click link to choose) by Daily, Weekly and by Year-to-Date performances. Also, one can sort by size of the company or by market capitalization. |
| Select Your Default Chart Type: | |||||
| |||||
| Click on stock symbol or name for detailed view. Click on to add stock symbol to your watchlist and to view watchlist. Quick View: Move mouse or cursor over "Daily" to quickly view daily Technical stock chart and over "Weekly" to view weekly Technical stock chart. | |||||

 | ARAY Accuray Incorporated |
| Sector: Health Care | |
| SubSector: Medical Appliances & Equipment | |
| MarketCap: 169.58 Millions | |
| Recent Price: 2.18 Smart Investing & Trading Score: 25 | |
| Day Percent Change: -0.91% Day Change: -0.02 | |
| Week Change: 1.87% Year-to-date Change: -23.0% | |
| ARAY Links: Profile News Message Board | |
| Charts:- Daily , Weekly | |
| Add ARAY to Watchlist: View: Get Complete ARAY Trend Analysis ➞ | |
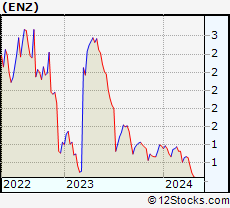 | ENZ Enzo Biochem, Inc. |
| Sector: Health Care | |
| SubSector: Medical Laboratories & Research | |
| MarketCap: 156.3 Millions | |
| Recent Price: 1.07 Smart Investing & Trading Score: 28 | |
| Day Percent Change: 0.94% Day Change: 0.01 | |
| Week Change: -1.83% Year-to-date Change: -23.0% | |
| ENZ Links: Profile News Message Board | |
| Charts:- Daily , Weekly | |
| Add ENZ to Watchlist: View: Get Complete ENZ Trend Analysis ➞ | |
 | ARVN Arvinas, Inc. |
| Sector: Health Care | |
| SubSector: Biotechnology | |
| MarketCap: 3469.85 Millions | |
| Recent Price: 31.60 Smart Investing & Trading Score: 10 | |
| Day Percent Change: -2.89% Day Change: -0.94 | |
| Week Change: -9.14% Year-to-date Change: -23.2% | |
| ARVN Links: Profile News Message Board | |
| Charts:- Daily , Weekly | |
| Add ARVN to Watchlist: View: Get Complete ARVN Trend Analysis ➞ | |
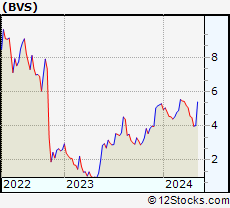 | BVS Bioventus Inc. |
| Sector: Health Care | |
| SubSector: Medical Devices | |
| MarketCap: 234 Millions | |
| Recent Price: 4.06 Smart Investing & Trading Score: 10 | |
| Day Percent Change: -2.75% Day Change: -0.12 | |
| Week Change: -9.38% Year-to-date Change: -23.3% | |
| BVS Links: Profile News Message Board | |
| Charts:- Daily , Weekly | |
| Add BVS to Watchlist: View: Get Complete BVS Trend Analysis ➞ | |
 | UBX Unity Biotechnology, Inc. |
| Sector: Health Care | |
| SubSector: Biotechnology | |
| MarketCap: 254.985 Millions | |
| Recent Price: 1.48 Smart Investing & Trading Score: 10 | |
| Day Percent Change: 0.68% Day Change: 0.01 | |
| Week Change: -1.33% Year-to-date Change: -23.3% | |
| UBX Links: Profile News Message Board | |
| Charts:- Daily , Weekly | |
| Add UBX to Watchlist: View: Get Complete UBX Trend Analysis ➞ | |
 | CLPT ClearPoint Neuro, Inc. |
| Sector: Health Care | |
| SubSector: Medical Appliances & Equipment | |
| MarketCap: 55.108 Millions | |
| Recent Price: 5.22 Smart Investing & Trading Score: 10 | |
| Day Percent Change: -2.06% Day Change: -0.11 | |
| Week Change: -2.43% Year-to-date Change: -23.4% | |
| CLPT Links: Profile News Message Board | |
| Charts:- Daily , Weekly | |
| Add CLPT to Watchlist: View: Get Complete CLPT Trend Analysis ➞ | |
 | INMD InMode Ltd. |
| Sector: Health Care | |
| SubSector: Medical Appliances & Equipment | |
| MarketCap: 689.08 Millions | |
| Recent Price: 17.03 Smart Investing & Trading Score: 10 | |
| Day Percent Change: -1.90% Day Change: -0.33 | |
| Week Change: -2.24% Year-to-date Change: -23.4% | |
| INMD Links: Profile News Message Board | |
| Charts:- Daily , Weekly | |
| Add INMD to Watchlist: View: Get Complete INMD Trend Analysis ➞ | |
 | PRVA Privia Health Group, Inc. |
| Sector: Health Care | |
| SubSector: Health Information Services | |
| MarketCap: 3130 Millions | |
| Recent Price: 17.99 Smart Investing & Trading Score: 15 | |
| Day Percent Change: -2.73% Day Change: -0.51 | |
| Week Change: -0.5% Year-to-date Change: -23.9% | |
| PRVA Links: Profile News Message Board | |
| Charts:- Daily , Weekly | |
| Add PRVA to Watchlist: View: Get Complete PRVA Trend Analysis ➞ | |
 | TLRY Tilray, Inc. |
| Sector: Health Care | |
| SubSector: Drug Manufacturers - Other | |
| MarketCap: 452.533 Millions | |
| Recent Price: 1.75 Smart Investing & Trading Score: 30 | |
| Day Percent Change: -4.89% Day Change: -0.09 | |
| Week Change: 1.16% Year-to-date Change: -23.9% | |
| TLRY Links: Profile News Message Board | |
| Charts:- Daily , Weekly | |
| Add TLRY to Watchlist: View: Get Complete TLRY Trend Analysis ➞ | |
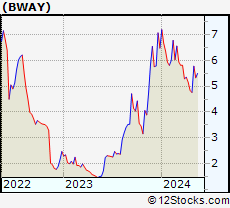 | BWAY Brainsway Ltd. |
| Sector: Health Care | |
| SubSector: Medical Laboratories & Research | |
| MarketCap: 65.03 Millions | |
| Recent Price: 4.92 Smart Investing & Trading Score: 35 | |
| Day Percent Change: -2.19% Day Change: -0.11 | |
| Week Change: 1.76% Year-to-date Change: -24.1% | |
| BWAY Links: Profile News Message Board | |
| Charts:- Daily , Weekly | |
| Add BWAY to Watchlist: View: Get Complete BWAY Trend Analysis ➞ | |
 | RIGL Rigel Pharmaceuticals, Inc. |
| Sector: Health Care | |
| SubSector: Biotechnology | |
| MarketCap: 256.585 Millions | |
| Recent Price: 1.10 Smart Investing & Trading Score: 25 | |
| Day Percent Change: -2.22% Day Change: -0.02 | |
| Week Change: 1.85% Year-to-date Change: -24.1% | |
| RIGL Links: Profile News Message Board | |
| Charts:- Daily , Weekly | |
| Add RIGL to Watchlist: View: Get Complete RIGL Trend Analysis ➞ | |
 | VIR Vir Biotechnology, Inc. |
| Sector: Health Care | |
| SubSector: Biotechnology | |
| MarketCap: 3916.75 Millions | |
| Recent Price: 7.63 Smart Investing & Trading Score: 20 | |
| Day Percent Change: -5.10% Day Change: -0.41 | |
| Week Change: -4.15% Year-to-date Change: -24.2% | |
| VIR Links: Profile News Message Board | |
| Charts:- Daily , Weekly | |
| Add VIR to Watchlist: View: Get Complete VIR Trend Analysis ➞ | |
 | ACCD Accolade, Inc. |
| Sector: Health Care | |
| SubSector: Health Information Services | |
| MarketCap: 32987 Millions | |
| Recent Price: 9.10 Smart Investing & Trading Score: 17 | |
| Day Percent Change: -3.19% Day Change: -0.30 | |
| Week Change: -2.78% Year-to-date Change: -24.3% | |
| ACCD Links: Profile News Message Board | |
| Charts:- Daily , Weekly | |
| Add ACCD to Watchlist: View: Get Complete ACCD Trend Analysis ➞ | |
 | PODD Insulet Corporation |
| Sector: Health Care | |
| SubSector: Medical Instruments & Supplies | |
| MarketCap: 9313.2 Millions | |
| Recent Price: 164.17 Smart Investing & Trading Score: 53 | |
| Day Percent Change: -1.84% Day Change: -3.08 | |
| Week Change: -1.25% Year-to-date Change: -24.3% | |
| PODD Links: Profile News Message Board | |
| Charts:- Daily , Weekly | |
| Add PODD to Watchlist: View: Get Complete PODD Trend Analysis ➞ | |
 | PCRX Pacira BioSciences, Inc. |
| Sector: Health Care | |
| SubSector: Drugs - Generic | |
| MarketCap: 1403.95 Millions | |
| Recent Price: 25.50 Smart Investing & Trading Score: 20 | |
| Day Percent Change: -1.54% Day Change: -0.40 | |
| Week Change: -2.86% Year-to-date Change: -24.4% | |
| PCRX Links: Profile News Message Board | |
| Charts:- Daily , Weekly | |
| Add PCRX to Watchlist: View: Get Complete PCRX Trend Analysis ➞ | |
 | TRDA Entrada Therapeutics, Inc. |
| Sector: Health Care | |
| SubSector: Biotechnology | |
| MarketCap: 481 Millions | |
| Recent Price: 12.36 Smart Investing & Trading Score: 35 | |
| Day Percent Change: -1.44% Day Change: -0.18 | |
| Week Change: 1.73% Year-to-date Change: -24.7% | |
| TRDA Links: Profile News Message Board | |
| Charts:- Daily , Weekly | |
| Add TRDA to Watchlist: View: Get Complete TRDA Trend Analysis ➞ | |
 | VIGL Vigil Neuroscience, Inc. |
| Sector: Health Care | |
| SubSector: Biotechnology | |
| MarketCap: 339 Millions | |
| Recent Price: 2.58 Smart Investing & Trading Score: 46 | |
| Day Percent Change: -7.86% Day Change: -0.22 | |
| Week Change: -8.51% Year-to-date Change: -24.8% | |
| VIGL Links: Profile News Message Board | |
| Charts:- Daily , Weekly | |
| Add VIGL to Watchlist: View: Get Complete VIGL Trend Analysis ➞ | |
 | ALNY Alnylam Pharmaceuticals, Inc. |
| Sector: Health Care | |
| SubSector: Biotechnology | |
| MarketCap: 12793.2 Millions | |
| Recent Price: 143.71 Smart Investing & Trading Score: 18 | |
| Day Percent Change: -0.06% Day Change: -0.09 | |
| Week Change: -0.48% Year-to-date Change: -24.9% | |
| ALNY Links: Profile News Message Board | |
| Charts:- Daily , Weekly | |
| Add ALNY to Watchlist: View: Get Complete ALNY Trend Analysis ➞ | |
 | VOR Vor Biopharma Inc. |
| Sector: Health Care | |
| SubSector: Biotechnology | |
| MarketCap: 224 Millions | |
| Recent Price: 1.67 Smart Investing & Trading Score: 30 | |
| Day Percent Change: -4.58% Day Change: -0.08 | |
| Week Change: -2.63% Year-to-date Change: -25.0% | |
| VOR Links: Profile News Message Board | |
| Charts:- Daily , Weekly | |
| Add VOR to Watchlist: View: Get Complete VOR Trend Analysis ➞ | |
 | SRRK Scholar Rock Holding Corporation |
| Sector: Health Care | |
| SubSector: Biotechnology | |
| MarketCap: 441.385 Millions | |
| Recent Price: 13.98 Smart Investing & Trading Score: 76 | |
| Day Percent Change: -0.78% Day Change: -0.11 | |
| Week Change: 0.94% Year-to-date Change: -25.6% | |
| SRRK Links: Profile News Message Board | |
| Charts:- Daily , Weekly | |
| Add SRRK to Watchlist: View: Get Complete SRRK Trend Analysis ➞ | |
 | ZURA Zura Bio Limited |
| Sector: Health Care | |
| SubSector: Biotechnology | |
| MarketCap: 242 Millions | |
| Recent Price: 3.48 Smart Investing & Trading Score: 68 | |
| Day Percent Change: 6.75% Day Change: 0.22 | |
| Week Change: 5.14% Year-to-date Change: -25.7% | |
| ZURA Links: Profile News Message Board | |
| Charts:- Daily , Weekly | |
| Add ZURA to Watchlist: View: Get Complete ZURA Trend Analysis ➞ | |
 | GOSS Gossamer Bio, Inc. |
| Sector: Health Care | |
| SubSector: Biotechnology | |
| MarketCap: 653.285 Millions | |
| Recent Price: 0.68 Smart Investing & Trading Score: 35 | |
| Day Percent Change: -4.42% Day Change: -0.03 | |
| Week Change: -13.61% Year-to-date Change: -25.8% | |
| GOSS Links: Profile News Message Board | |
| Charts:- Daily , Weekly | |
| Add GOSS to Watchlist: View: Get Complete GOSS Trend Analysis ➞ | |
 | TNGX Tango Therapeutics, Inc. |
| Sector: Health Care | |
| SubSector: Biotechnology | |
| MarketCap: 302 Millions | |
| Recent Price: 7.33 Smart Investing & Trading Score: 57 | |
| Day Percent Change: -5.54% Day Change: -0.43 | |
| Week Change: 0.27% Year-to-date Change: -26.0% | |
| TNGX Links: Profile News Message Board | |
| Charts:- Daily , Weekly | |
| Add TNGX to Watchlist: View: Get Complete TNGX Trend Analysis ➞ | |
 | ETNB 89bio, Inc. |
| Sector: Health Care | |
| SubSector: Biotechnology | |
| MarketCap: 517.485 Millions | |
| Recent Price: 8.26 Smart Investing & Trading Score: 10 | |
| Day Percent Change: -3.79% Day Change: -0.32 | |
| Week Change: -9.09% Year-to-date Change: -26.1% | |
| ETNB Links: Profile News Message Board | |
| Charts:- Daily , Weekly | |
| Add ETNB to Watchlist: View: Get Complete ETNB Trend Analysis ➞ | |
 | RCKT Rocket Pharmaceuticals, Inc. |
| Sector: Health Care | |
| SubSector: Biotechnology | |
| MarketCap: 899.585 Millions | |
| Recent Price: 22.13 Smart Investing & Trading Score: 20 | |
| Day Percent Change: -6.35% Day Change: -1.50 | |
| Week Change: -3.02% Year-to-date Change: -26.2% | |
| RCKT Links: Profile News Message Board | |
| Charts:- Daily , Weekly | |
| Add RCKT to Watchlist: View: Get Complete RCKT Trend Analysis ➞ | |
| For tabular summary view of above stock list: Summary View ➞ 0 - 25 , 25 - 50 , 50 - 75 , 75 - 100 , 100 - 125 , 125 - 150 , 150 - 175 , 175 - 200 , 200 - 225 , 225 - 250 , 250 - 275 , 275 - 300 , 300 - 325 , 325 - 350 , 350 - 375 , 375 - 400 , 400 - 425 , 425 - 450 , 450 - 475 , 475 - 500 , 500 - 525 , 525 - 550 , 550 - 575 , 575 - 600 , 600 - 625 , 625 - 650 , 650 - 675 , 675 - 700 , 700 - 725 | ||
| Click To Change The Sort Order: By Market Cap or Company Size Performance: Year-to-date, Week and Day | |
| Select Chart Type: | ||
|
Best Stocks Today 12Stocks.com |
© 2024 12Stocks.com Terms & Conditions Privacy Contact Us
All Information Provided Only For Education And Not To Be Used For Investing or Trading. See Terms & Conditions


One More Thing ... Get Best Stocks Delivered Daily!
Never Ever Miss A Move With Our Top Ten Stocks Lists
Find Best Stocks In Any Market - Bull or Bear Market
Take A Peek At Our Top Ten Stocks Lists: Daily, Weekly, Year-to-Date & Top Trends
Find Best Stocks In Any Market - Bull or Bear Market
Take A Peek At Our Top Ten Stocks Lists: Daily, Weekly, Year-to-Date & Top Trends
Healthcare Stocks With Best Up Trends [0-bearish to 100-bullish]: AstraZeneca [100], Merck [100], Annovis Bio[100], Haemonetics [100], Tandem Diabetes[100], Boston Scientific[100], Agios [100], Agenus [95], Mesoblast [95], Cullinan Oncology[93], Avadel [93]
Best Healthcare Stocks Year-to-Date:
Pieris [6273.63%], Precision BioSciences[2590.41%], Inovio [1885.29%], Assembly Biosciences[1529.07%], Aurora Cannabis[1311.17%], NuCana [1198.17%], Adverum Biotechnologies[1147.34%], Agenus [902.54%], Affimed N.V[680.8%], CareMax [490.72%], Mesoblast [459.09%] Best Healthcare Stocks This Week:
Pieris [7900%], Agenus [56.31%], VolitionRx [44.5%], ProKidney [32.84%], Seres [32.65%], Annovis Bio[30%], BeyondSpring [26.11%], Cullinan Oncology[22.92%], Pharvaris N.V[18.84%], OptiNose [18.42%], GeneDx [18.15%] Best Healthcare Stocks Daily:
OptiNose [14.56%], Galera [13.74%], Agenus [11.86%], VolitionRx [11.26%], ADiTx [10.57%], Apollomics [9.94%], Pharming [9.06%], Structure [8.13%], Pharvaris N.V[7.91%], ProKidney [7.75%], Community Health[7.26%]