
 Login Sign Up


| |||||
 |  | ||||

| 12Stocks.com Market Intelligence |
Best Healthcare Stocks
 | "Discover best trending healthcare stocks with 12Stocks.com." |
| - Subu Vdaygiri, Founder, 12Stocks.com |
| In a hurry? Healthcare Stocks Lists: Performance Trends Table, Stock Charts
Sort Healthcare stocks: Daily, Weekly, Year-to-Date, Market Cap & Trends. Filter Healthcare stocks list by size:All Healthcare Large Mid-Range Small |
| 12Stocks.com Healthcare Stocks Performances & Trends Daily | |||||||||
|
|  The overall Smart Investing & Trading Score is 25 (0-bearish to 100-bullish) which puts Healthcare sector in short term bearish to neutral trend. The Smart Investing & Trading Score from previous trading session is 18 and hence an improvement of trend.
| ||||||||
Here are the Smart Investing & Trading Scores of the most requested Healthcare stocks at 12Stocks.com (click stock name for detailed review):
|


| 12Stocks.com: Investing in Healthcare sector with Stocks | |
|
The following table helps investors and traders sort through current performance and trends (as measured by Smart Investing & Trading Score) of various
stocks in the Healthcare sector. Quick View: Move mouse or cursor over stock symbol (ticker) to view short-term Technical chart and over stock name to view long term chart. Click on  to add stock symbol to your watchlist and to add stock symbol to your watchlist and  to view watchlist. Click on any ticker or stock name for detailed market intelligence report for that stock. to view watchlist. Click on any ticker or stock name for detailed market intelligence report for that stock. |
12Stocks.com Performance of Stocks in Healthcare Sector
| Ticker | Stock Name | Watchlist | Category | Recent Price | Smart Investing & Trading Score | Change % | Weekly Change% |
| NCNA | NuCana |   | Biotechnology | 3.79 | 73 | -6.42% | 1,592.72% |
| HUMA | Humacyte | | Biotechnology | 4.01 | 100 | 23.57% | 39.24% |
| PROK | ProKidney | | Biotechnology | 2.40 | 75 | 4.11% | 37.43% |
| RGC | Regencell Bioscience | | Drug Manufacturers - Specialty & Generic | 5.22 | 24 | 0.00% | 37.01% |
| VERO | Venus Concept | | Equipment | 0.84 | 57 | 7.47% | 23.97% |
| ALXO | ALX Oncology | | Biotechnology | 15.96 | 95 | 1.53% | 22.49% |
| ME | 23andMe Holding | | Diagnostics & Research | 0.54 | 62 | -8.41% | 22.09% |
| VNDA | Vanda | | Biotechnology | 4.99 | 93 | 0.40% | 21.12% |
| GRTX | Galera | | Biotechnology | 0.19 | 54 | 0.54% | 17.05% |
| RANI | Rani | | Biotechnology | 6.30 | 75 | 3.11% | 16.67% |
| OSCR | Oscar Health | | Healthcare Plans | 17.01 | 100 | 2.90% | 15.40% |
| UNH | UnitedHealth | | Insurance | 502.15 | 74 | 1.82% | 14.33% |
| ZCMD | Zhongchao | | Health Information | 1.87 | 73 | -44.67% | 14.02% |
| ACCD | Accolade | | Health Information | 9.36 | 42 | 1.85% | 13.45% |
| DAWN | Day One | | Biotechnology | 15.59 | 85 | 4.04% | 13.18% |
| AQST | Aquestive | | Biotechnology | 4.42 | 83 | -1.89% | 13.04% |
| DRRX | DURECT | | Pharmaceutical | 0.91 | 68 | 0.00% | 12.82% |
| OM | Outset | | Medical Devices | 2.29 | 67 | 2.01% | 11.46% |
| AVDL | Avadel | | Biotechnology | 17.77 | 78 | 2.24% | 11.13% |
| ADCT | ADC | | Biotechnology | 4.87 | 76 | 2.31% | 10.93% |
| AGL | agilon health | | Medical Care Facilities | 5.48 | 52 | 4.48% | 10.71% |
| ALVO | Alvotech | | Drug Manufacturers - Specialty & Generic | 13.55 | 64 | 5.16% | 10.70% |
| VBIV | VBI Vaccines | | Biotechnology | 0.64 | 62 | 1.48% | 10.17% |
| ITCI | Intra-Cellular Therapies | | Biotechnology | 72.24 | 68 | 0.33% | 9.65% |
| ALHC | Alignment | | Healthcare Plans | 5.13 | 64 | 0.49% | 9.26% |
| For chart view version of above stock list: Chart View ➞ 0 - 25 , 25 - 50 , 50 - 75 , 75 - 100 , 100 - 125 , 125 - 150 , 150 - 175 , 175 - 200 , 200 - 225 , 225 - 250 , 250 - 275 , 275 - 300 , 300 - 325 , 325 - 350 , 350 - 375 , 375 - 400 , 400 - 425 , 425 - 450 , 450 - 475 , 475 - 500 , 500 - 525 , 525 - 550 , 550 - 575 , 575 - 600 , 600 - 625 , 625 - 650 , 650 - 675 | ||
 | Click To Change The Sort Order: By Market Cap or Company Size Performance: Year-to-date, Week and Day |  |
|
Get the most comprehensive stock market coverage daily at 12Stocks.com ➞ Best Stocks Today ➞ Best Stocks Weekly ➞ Best Stocks Year-to-Date ➞ Best Stocks Trends ➞  Best Stocks Today 12Stocks.com Best Nasdaq Stocks ➞ Best S&P 500 Stocks ➞ Best Tech Stocks ➞ Best Biotech Stocks ➞ |
| Detailed Overview of Healthcare Stocks |
| Healthcare Technical Overview, Leaders & Laggards, Top Healthcare ETF Funds & Detailed Healthcare Stocks List, Charts, Trends & More |
| Healthcare Sector: Technical Analysis, Trends & YTD Performance | |
| Healthcare sector is composed of stocks
from pharmaceutical, biotech, diagnostics labs, insurance providers
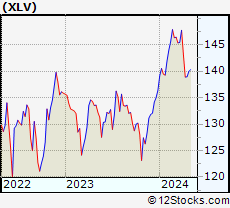
and healthcare services. Healthcare sector, as represented by XLV, an exchange-traded fund [ETF] that holds basket of Healthcare stocks (e.g, Merck, Amgen) is up by 1.84% and is currently underperforming the overall market by -2.24% year-to-date. Below is a quick view of Technical charts and trends: |
|
 XLV Weekly Chart |
|
| Long Term Trend: Not Good | |
| Medium Term Trend: Not Good | |
 XLV Daily Chart |
|
| Short Term Trend: Very Good | |
| Overall Trend Score: 25 | |
| YTD Performance: 1.84% | |
| **Trend Scores & Views Are Only For Educational Purposes And Not For Investing | |
| 12Stocks.com: Top Performing Healthcare Sector Stocks | ||||||||||||||||||||||||||||||||||||||||||||||||
 The top performing Healthcare sector stocks year to date are
Now, more recently, over last week, the top performing Healthcare sector stocks on the move are


|
||||||||||||||||||||||||||||||||||||||||||||||||
| 12Stocks.com: Investing in Healthcare Sector using Exchange Traded Funds | |
|
The following table shows list of key exchange traded funds (ETF) that
help investors track Healthcare Index. For detailed view, check out our ETF Funds section of our website. Quick View: Move mouse or cursor over ETF symbol (ticker) to view short-term Technical chart and over ETF name to view long term chart. Click on ticker or stock name for detailed view. Click on to add stock symbol to your watchlist and to view watchlist. |
12Stocks.com List of ETFs that track Healthcare Index
| Ticker | ETF Name | Watchlist | Recent Price | Smart Investing & Trading Score | Change % | Week % | Year-to-date % |
| XLV | Health Care | | 138.88 | 25 | 0.33 | -0.02 | 1.84% |
| IBB | Biotechnology | | 124.78 | 10 | 0.11 | -3.7 | -8.15% |
| BBH | Biotech | | 152.16 | 10 | -0.12 | -3.45 | -7.95% |
| IHF | Healthcare Providers | | 52.08 | 52 | 1.04 | 3.05 | -0.82% |
| PSCH | SmallCap Health Care | | 40.05 | 20 | -0.07 | -3.33 | -6.43% |
| XHS | Health Care Services | | 86.13 | 18 | -0.07 | -2.14 | -3.17% |
| PTH | DWA Healthcare Momentum | | 39.53 | 23 | -0.10 | -5.5 | 1% |
| BTEC | Principal Healthcare Innovators | | 33.86 | 0 | -0.67 | -5.92 | -6.8% |
| RXL | Health Care | | 93.43 | 25 | 1.08 | 0.19 | 2.22% |
| RXD | Short Health Care | | 11.63 | 76 | -0.39 | 0.24 | -2.49% |
| 12Stocks.com: Charts, Trends, Fundamental Data and Performances of Healthcare Stocks | |
|
We now take in-depth look at all Healthcare stocks including charts, multi-period performances and overall trends (as measured by Smart Investing & Trading Score). One can sort Healthcare stocks (click link to choose) by Daily, Weekly and by Year-to-Date performances. Also, one can sort by size of the company or by market capitalization. |
| Select Your Default Chart Type: | |||||
| |||||
| Click on stock symbol or name for detailed view. Click on to add stock symbol to your watchlist and to view watchlist. Quick View: Move mouse or cursor over "Daily" to quickly view daily Technical stock chart and over "Weekly" to view weekly Technical stock chart. | |||||

 | NCNA NuCana plc |
| Sector: Health Care | |
| SubSector: Biotechnology | |
| MarketCap: 185.785 Millions | |
| Recent Price: 3.79 Smart Investing & Trading Score: 73 | |
| Day Percent Change: -6.42% Day Change: -0.26 | |
| Week Change: 1592.72% Year-to-date Change: 1,181.3% | |
| NCNA Links: Profile News Message Board | |
| Charts:- Daily , Weekly | |
| Add NCNA to Watchlist: View: Get Complete NCNA Trend Analysis ➞ | |
 | HUMA Humacyte, Inc. |
| Sector: Health Care | |
| SubSector: Biotechnology | |
| MarketCap: 297 Millions | |
| Recent Price: 4.01 Smart Investing & Trading Score: 100 | |
| Day Percent Change: 23.57% Day Change: 0.76 | |
| Week Change: 39.24% Year-to-date Change: 41.2% | |
| HUMA Links: Profile News Message Board | |
| Charts:- Daily , Weekly | |
| Add HUMA to Watchlist: View: Get Complete HUMA Trend Analysis ➞ | |
 | PROK ProKidney Corp. |
| Sector: Health Care | |
| SubSector: Biotechnology | |
| MarketCap: 2470 Millions | |
| Recent Price: 2.40 Smart Investing & Trading Score: 75 | |
| Day Percent Change: 4.11% Day Change: 0.09 | |
| Week Change: 37.43% Year-to-date Change: 37.8% | |
| PROK Links: Profile News Message Board | |
| Charts:- Daily , Weekly | |
| Add PROK to Watchlist: View: Get Complete PROK Trend Analysis ➞ | |
 | RGC Regencell Bioscience Holdings Limited |
| Sector: Health Care | |
| SubSector: Drug Manufacturers - Specialty & Generic | |
| MarketCap: 284 Millions | |
| Recent Price: 5.22 Smart Investing & Trading Score: 24 | |
| Day Percent Change: 0.00% Day Change: 0.00 | |
| Week Change: 37.01% Year-to-date Change: -50.3% | |
| RGC Links: Profile News Message Board | |
| Charts:- Daily , Weekly | |
| Add RGC to Watchlist: View: Get Complete RGC Trend Analysis ➞ | |
 | VERO Venus Concept Inc. |
| Sector: Health Care | |
| SubSector: Medical Appliances & Equipment | |
| MarketCap: 101.08 Millions | |
| Recent Price: 0.84 Smart Investing & Trading Score: 57 | |
| Day Percent Change: 7.47% Day Change: 0.06 | |
| Week Change: 23.97% Year-to-date Change: -28.8% | |
| VERO Links: Profile News Message Board | |
| Charts:- Daily , Weekly | |
| Add VERO to Watchlist: View: Get Complete VERO Trend Analysis ➞ | |
 | ALXO ALX Oncology Holdings Inc. |
| Sector: Health Care | |
| SubSector: Biotechnology | |
| MarketCap: 41787 Millions | |
| Recent Price: 15.96 Smart Investing & Trading Score: 95 | |
| Day Percent Change: 1.53% Day Change: 0.24 | |
| Week Change: 22.49% Year-to-date Change: 7.3% | |
| ALXO Links: Profile News Message Board | |
| Charts:- Daily , Weekly | |
| Add ALXO to Watchlist: View: Get Complete ALXO Trend Analysis ➞ | |
 | ME 23andMe Holding Co. |
| Sector: Health Care | |
| SubSector: Diagnostics & Research | |
| MarketCap: 802 Millions | |
| Recent Price: 0.54 Smart Investing & Trading Score: 62 | |
| Day Percent Change: -8.41% Day Change: -0.05 | |
| Week Change: 22.09% Year-to-date Change: -39.3% | |
| ME Links: Profile News Message Board | |
| Charts:- Daily , Weekly | |
| Add ME to Watchlist: View: Get Complete ME Trend Analysis ➞ | |
 | VNDA Vanda Pharmaceuticals Inc. |
| Sector: Health Care | |
| SubSector: Biotechnology | |
| MarketCap: 464.585 Millions | |
| Recent Price: 4.99 Smart Investing & Trading Score: 93 | |
| Day Percent Change: 0.40% Day Change: 0.02 | |
| Week Change: 21.12% Year-to-date Change: 18.3% | |
| VNDA Links: Profile News Message Board | |
| Charts:- Daily , Weekly | |
| Add VNDA to Watchlist: View: Get Complete VNDA Trend Analysis ➞ | |
 | GRTX Galera Therapeutics, Inc. |
| Sector: Health Care | |
| SubSector: Biotechnology | |
| MarketCap: 277.585 Millions | |
| Recent Price: 0.19 Smart Investing & Trading Score: 54 | |
| Day Percent Change: 0.54% Day Change: 0.00 | |
| Week Change: 17.05% Year-to-date Change: 27.9% | |
| GRTX Links: Profile News Message Board | |
| Charts:- Daily , Weekly | |
| Add GRTX to Watchlist: View: Get Complete GRTX Trend Analysis ➞ | |
 | RANI Rani Therapeutics Holdings, Inc. |
| Sector: Health Care | |
| SubSector: Biotechnology | |
| MarketCap: 202 Millions | |
| Recent Price: 6.30 Smart Investing & Trading Score: 75 | |
| Day Percent Change: 3.11% Day Change: 0.19 | |
| Week Change: 16.67% Year-to-date Change: 90.9% | |
| RANI Links: Profile News Message Board | |
| Charts:- Daily , Weekly | |
| Add RANI to Watchlist: View: Get Complete RANI Trend Analysis ➞ | |
 | OSCR Oscar Health, Inc. |
| Sector: Health Care | |
| SubSector: Healthcare Plans | |
| MarketCap: 1790 Millions | |
| Recent Price: 17.01 Smart Investing & Trading Score: 100 | |
| Day Percent Change: 2.90% Day Change: 0.48 | |
| Week Change: 15.4% Year-to-date Change: 86.8% | |
| OSCR Links: Profile News Message Board | |
| Charts:- Daily , Weekly | |
| Add OSCR to Watchlist: View: Get Complete OSCR Trend Analysis ➞ | |
 | UNH UnitedHealth Group Incorporated |
| Sector: Health Care | |
| SubSector: Health Care Plans | |
| MarketCap: 217384 Millions | |
| Recent Price: 502.15 Smart Investing & Trading Score: 74 | |
| Day Percent Change: 1.82% Day Change: 8.97 | |
| Week Change: 14.33% Year-to-date Change: -4.6% | |
| UNH Links: Profile News Message Board | |
| Charts:- Daily , Weekly | |
| Add UNH to Watchlist: View: Get Complete UNH Trend Analysis ➞ | |
 | ZCMD Zhongchao Inc. |
| Sector: Health Care | |
| SubSector: Health Information Services | |
| MarketCap: 41487 Millions | |
| Recent Price: 1.87 Smart Investing & Trading Score: 73 | |
| Day Percent Change: -44.67% Day Change: -1.51 | |
| Week Change: 14.02% Year-to-date Change: 412.2% | |
| ZCMD Links: Profile News Message Board | |
| Charts:- Daily , Weekly | |
| Add ZCMD to Watchlist: View: Get Complete ZCMD Trend Analysis ➞ | |
 | ACCD Accolade, Inc. |
| Sector: Health Care | |
| SubSector: Health Information Services | |
| MarketCap: 32987 Millions | |
| Recent Price: 9.36 Smart Investing & Trading Score: 42 | |
| Day Percent Change: 1.85% Day Change: 0.17 | |
| Week Change: 13.45% Year-to-date Change: -22.1% | |
| ACCD Links: Profile News Message Board | |
| Charts:- Daily , Weekly | |
| Add ACCD to Watchlist: View: Get Complete ACCD Trend Analysis ➞ | |
 | DAWN Day One Biopharmaceuticals, Inc. |
| Sector: Health Care | |
| SubSector: Biotechnology | |
| MarketCap: 1040 Millions | |
| Recent Price: 15.59 Smart Investing & Trading Score: 85 | |
| Day Percent Change: 4.04% Day Change: 0.61 | |
| Week Change: 13.18% Year-to-date Change: 6.1% | |
| DAWN Links: Profile News Message Board | |
| Charts:- Daily , Weekly | |
| Add DAWN to Watchlist: View: Get Complete DAWN Trend Analysis ➞ | |
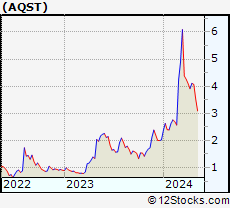 | AQST Aquestive Therapeutics, Inc. |
| Sector: Health Care | |
| SubSector: Biotechnology | |
| MarketCap: 94.2785 Millions | |
| Recent Price: 4.42 Smart Investing & Trading Score: 83 | |
| Day Percent Change: -1.89% Day Change: -0.08 | |
| Week Change: 13.04% Year-to-date Change: 118.8% | |
| AQST Links: Profile News Message Board | |
| Charts:- Daily , Weekly | |
| Add AQST to Watchlist: View: Get Complete AQST Trend Analysis ➞ | |
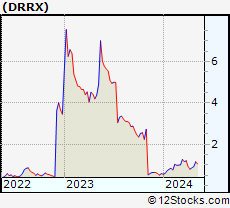 | DRRX DURECT Corporation |
| Sector: Health Care | |
| SubSector: Drug Manufacturers - Other | |
| MarketCap: 256.333 Millions | |
| Recent Price: 0.91 Smart Investing & Trading Score: 68 | |
| Day Percent Change: 0.00% Day Change: 0.00 | |
| Week Change: 12.82% Year-to-date Change: 54.2% | |
| DRRX Links: Profile News Message Board | |
| Charts:- Daily , Weekly | |
| Add DRRX to Watchlist: View: Get Complete DRRX Trend Analysis ➞ | |
 | OM Outset Medical, Inc. |
| Sector: Health Care | |
| SubSector: Medical Devices | |
| MarketCap: 21787 Millions | |
| Recent Price: 2.29 Smart Investing & Trading Score: 67 | |
| Day Percent Change: 2.01% Day Change: 0.04 | |
| Week Change: 11.46% Year-to-date Change: -57.8% | |
| OM Links: Profile News Message Board | |
| Charts:- Daily , Weekly | |
| Add OM to Watchlist: View: Get Complete OM Trend Analysis ➞ | |
 | AVDL Avadel Pharmaceuticals plc |
| Sector: Health Care | |
| SubSector: Biotechnology | |
| MarketCap: 354.485 Millions | |
| Recent Price: 17.77 Smart Investing & Trading Score: 78 | |
| Day Percent Change: 2.24% Day Change: 0.39 | |
| Week Change: 11.13% Year-to-date Change: 25.9% | |
| AVDL Links: Profile News Message Board | |
| Charts:- Daily , Weekly | |
| Add AVDL to Watchlist: View: Get Complete AVDL Trend Analysis ➞ | |
 | ADCT ADC Therapeutics SA |
| Sector: Health Care | |
| SubSector: Biotechnology | |
| MarketCap: 26087 Millions | |
| Recent Price: 4.87 Smart Investing & Trading Score: 76 | |
| Day Percent Change: 2.31% Day Change: 0.11 | |
| Week Change: 10.93% Year-to-date Change: 193.4% | |
| ADCT Links: Profile News Message Board | |
| Charts:- Daily , Weekly | |
| Add ADCT to Watchlist: View: Get Complete ADCT Trend Analysis ➞ | |
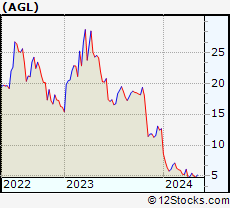 | AGL agilon health, inc. |
| Sector: Health Care | |
| SubSector: Medical Care Facilities | |
| MarketCap: 7310 Millions | |
| Recent Price: 5.48 Smart Investing & Trading Score: 52 | |
| Day Percent Change: 4.48% Day Change: 0.24 | |
| Week Change: 10.71% Year-to-date Change: -56.7% | |
| AGL Links: Profile News Message Board | |
| Charts:- Daily , Weekly | |
| Add AGL to Watchlist: View: Get Complete AGL Trend Analysis ➞ | |
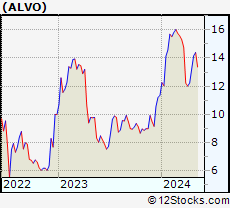 | ALVO Alvotech |
| Sector: Health Care | |
| SubSector: Drug Manufacturers - Specialty & Generic | |
| MarketCap: 2160 Millions | |
| Recent Price: 13.55 Smart Investing & Trading Score: 64 | |
| Day Percent Change: 5.16% Day Change: 0.67 | |
| Week Change: 10.7% Year-to-date Change: 19.3% | |
| ALVO Links: Profile News Message Board | |
| Charts:- Daily , Weekly | |
| Add ALVO to Watchlist: View: Get Complete ALVO Trend Analysis ➞ | |
 | VBIV VBI Vaccines Inc. |
| Sector: Health Care | |
| SubSector: Biotechnology | |
| MarketCap: 139.785 Millions | |
| Recent Price: 0.64 Smart Investing & Trading Score: 62 | |
| Day Percent Change: 1.48% Day Change: 0.01 | |
| Week Change: 10.17% Year-to-date Change: 8.8% | |
| VBIV Links: Profile News Message Board | |
| Charts:- Daily , Weekly | |
| Add VBIV to Watchlist: View: Get Complete VBIV Trend Analysis ➞ | |
 | ITCI Intra-Cellular Therapies, Inc. |
| Sector: Health Care | |
| SubSector: Biotechnology | |
| MarketCap: 991.885 Millions | |
| Recent Price: 72.24 Smart Investing & Trading Score: 68 | |
| Day Percent Change: 0.33% Day Change: 0.24 | |
| Week Change: 9.65% Year-to-date Change: 0.9% | |
| ITCI Links: Profile News Message Board | |
| Charts:- Daily , Weekly | |
| Add ITCI to Watchlist: View: Get Complete ITCI Trend Analysis ➞ | |
 | ALHC Alignment Healthcare, Inc. |
| Sector: Health Care | |
| SubSector: Healthcare Plans | |
| MarketCap: 1100 Millions | |
| Recent Price: 5.13 Smart Investing & Trading Score: 64 | |
| Day Percent Change: 0.49% Day Change: 0.02 | |
| Week Change: 9.26% Year-to-date Change: -42.0% | |
| ALHC Links: Profile News Message Board | |
| Charts:- Daily , Weekly | |
| Add ALHC to Watchlist: View: Get Complete ALHC Trend Analysis ➞ | |
| For tabular summary view of above stock list: Summary View ➞ 0 - 25 , 25 - 50 , 50 - 75 , 75 - 100 , 100 - 125 , 125 - 150 , 150 - 175 , 175 - 200 , 200 - 225 , 225 - 250 , 250 - 275 , 275 - 300 , 300 - 325 , 325 - 350 , 350 - 375 , 375 - 400 , 400 - 425 , 425 - 450 , 450 - 475 , 475 - 500 , 500 - 525 , 525 - 550 , 550 - 575 , 575 - 600 , 600 - 625 , 625 - 650 , 650 - 675 | ||
| Click To Change The Sort Order: By Market Cap or Company Size Performance: Year-to-date, Week and Day | |
| Select Chart Type: | ||
|
Best Stocks Today 12Stocks.com |
© 2024 12Stocks.com Terms & Conditions Privacy Contact Us
All Information Provided Only For Education And Not To Be Used For Investing or Trading. See Terms & Conditions


One More Thing ... Get Best Stocks Delivered Daily!
Never Ever Miss A Move With Our Top Ten Stocks Lists
Find Best Stocks In Any Market - Bull or Bear Market
Take A Peek At Our Top Ten Stocks Lists: Daily, Weekly, Year-to-Date & Top Trends
Find Best Stocks In Any Market - Bull or Bear Market
Take A Peek At Our Top Ten Stocks Lists: Daily, Weekly, Year-to-Date & Top Trends
Healthcare Stocks With Best Up Trends [0-bearish to 100-bullish]: Humacyte [100], Oscar Health[100], Lantheus [100], Geron [100], ALX Oncology[95], Phibro Animal[95], Fresenius [95], Glaukos [93], Vanda [93], Agios [90], Mesoblast [88]
Best Healthcare Stocks Year-to-Date:
Precision BioSciences[2746.58%], Inovio [1809.8%], Assembly Biosciences[1525.41%], Aurora Cannabis[1275.47%], NuCana [1181.27%], Agenus [581.24%], Corbus [523.84%], CareMax [456.7%], Zhongchao [412.19%], Mesoblast [369.09%], Janux [343.37%] Best Healthcare Stocks This Week:
NuCana [1592.72%], Humacyte [39.24%], ProKidney [37.43%], Regencell Bioscience[37.01%], Venus Concept[23.97%], ALX Oncology[22.49%], 23andMe Holding[22.09%], Vanda [21.12%], Galera [17.05%], Rani [16.67%], Oscar Health[15.4%] Best Healthcare Stocks Daily:
Humacyte [23.57%], Adaptimmune [14.09%], Agenus [13.48%], Hyperfine [10.37%], Pacific Biosciences[8.56%], CareMax [7.57%], Venus Concept[7.47%], Belite Bio[7.47%], Aesthetic [6.77%], Accelerate Diagnostics[6.36%], Sangamo [6.18%]