
 Login Sign Up


| |||||
 |  | ||||

| 12Stocks.com Market Intelligence |
Best Healthcare Stocks
 | "Discover best trending healthcare stocks with 12Stocks.com." |
| - Subu Vdaygiri, Founder, 12Stocks.com |
| In a hurry? Healthcare Stocks Lists: Performance Trends Table, Stock Charts
Sort Healthcare stocks: Daily, Weekly, Year-to-Date, Market Cap & Trends. Filter Healthcare stocks list by size:All Healthcare Large Mid-Range Small |
| 12Stocks.com Healthcare Stocks Performances & Trends Daily | |||||||||
|
|  The overall Smart Investing & Trading Score is 25 (0-bearish to 100-bullish) which puts Healthcare sector in short term bearish to neutral trend. The Smart Investing & Trading Score from previous trading session is 18 and hence an improvement of trend.
| ||||||||
Here are the Smart Investing & Trading Scores of the most requested Healthcare stocks at 12Stocks.com (click stock name for detailed review):
|


| 12Stocks.com: Investing in Healthcare sector with Stocks | |
|
The following table helps investors and traders sort through current performance and trends (as measured by Smart Investing & Trading Score) of various
stocks in the Healthcare sector. Quick View: Move mouse or cursor over stock symbol (ticker) to view short-term Technical chart and over stock name to view long term chart. Click on  to add stock symbol to your watchlist and to add stock symbol to your watchlist and  to view watchlist. Click on any ticker or stock name for detailed market intelligence report for that stock. to view watchlist. Click on any ticker or stock name for detailed market intelligence report for that stock. |
12Stocks.com Performance of Stocks in Healthcare Sector
| Ticker | Stock Name | Watchlist | Category | Recent Price | Smart Investing & Trading Score | Change % | YTD Change% |
| SCPH | sc |   | Biotechnology | 4.55 | 17 | 0.66% | -27.43% |
| MGTX | MeiraGTx | | Biotechnology | 5.09 | 10 | 1.60% | -27.49% |
| CTSO | Cytosorbents | | Laboratories | 0.80 | 35 | 0.12% | -27.75% |
| LFST | LifeStance Health | | Medical Care Facilities | 5.71 | 25 | -0.78% | -27.86% |
| VERO | Venus Concept | | Equipment | 0.85 | 57 | 8.75% | -27.97% |
| TELA | TELA Bio | | Equipment | 4.76 | 0 | -7.57% | -28.10% |
| BGNE | BeiGene | | Biotechnology | 129.52 | 10 | -1.85% | -28.19% |
| HUM | Humana | | Insurance | 328.33 | 49 | 1.08% | -28.28% |
| MDXG | MiMedx | | Equipment | 6.29 | 15 | 2.11% | -28.28% |
| DBVT | DBV Technologies | | Biotechnology | 0.68 | 10 | 3.13% | -28.45% |
| GLPG | Galapagos NV | | Biotechnology | 29.08 | 10 | 0.59% | -28.46% |
| XGN | Exagen | | Laboratories | 1.42 | 17 | 1.43% | -28.64% |
| ETON | Eton | | Biotechnology | 3.12 | 10 | 0.00% | -28.77% |
| ORGO | Organogenesis | | Pharmaceutical | 2.91 | 57 | 1.57% | -28.85% |
| NTLA | Intellia | | Biotechnology | 21.57 | 20 | 1.17% | -29.26% |
| VCYT | Veracyte | | Biotechnology | 19.45 | 42 | 1.30% | -29.30% |
| CORT | Corcept | | Biotechnology | 22.95 | 36 | 1.28% | -29.34% |
| ASRT | Assertio | | Pharmaceutical | 0.76 | 27 | 0.73% | -29.40% |
| FLGT | Fulgent Genetics | | Laboratories | 20.34 | 37 | 1.09% | -29.64% |
| OLMA | Olema | | Biotechnology | 9.86 | 7 | -0.60% | -29.87% |
| DH | Definitive | | Health Information | 7.06 | 5 | -2.89% | -29.89% |
| AUTL | Autolus | | Biotechnology | 4.51 | 0 | -6.04% | -29.97% |
| SENS | Senseonics | | Equipment | 0.40 | 10 | -4.04% | -29.98% |
| OPTN | OptiNose | | Pharmaceutical | 0.90 | 0 | -3.68% | -30.61% |
| INNV | InnovAge Holding | | Medical Care Facilities | 3.95 | 20 | -2.47% | -30.70% |
| For chart view version of above stock list: Chart View ➞ 0 - 25 , 25 - 50 , 50 - 75 , 75 - 100 , 100 - 125 , 125 - 150 , 150 - 175 , 175 - 200 , 200 - 225 , 225 - 250 , 250 - 275 , 275 - 300 , 300 - 325 , 325 - 350 , 350 - 375 , 375 - 400 , 400 - 425 , 425 - 450 , 450 - 475 , 475 - 500 , 500 - 525 , 525 - 550 , 550 - 575 , 575 - 600 , 600 - 625 , 625 - 650 , 650 - 675 , 675 - 700 , 700 - 725 | ||
 | Click To Change The Sort Order: By Market Cap or Company Size Performance: Year-to-date, Week and Day |  |
|
Get the most comprehensive stock market coverage daily at 12Stocks.com ➞ Best Stocks Today ➞ Best Stocks Weekly ➞ Best Stocks Year-to-Date ➞ Best Stocks Trends ➞  Best Stocks Today 12Stocks.com Best Nasdaq Stocks ➞ Best S&P 500 Stocks ➞ Best Tech Stocks ➞ Best Biotech Stocks ➞ |
| Detailed Overview of Healthcare Stocks |
| Healthcare Technical Overview, Leaders & Laggards, Top Healthcare ETF Funds & Detailed Healthcare Stocks List, Charts, Trends & More |
| Healthcare Sector: Technical Analysis, Trends & YTD Performance | |
| Healthcare sector is composed of stocks
from pharmaceutical, biotech, diagnostics labs, insurance providers
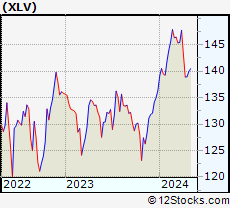
and healthcare services. Healthcare sector, as represented by XLV, an exchange-traded fund [ETF] that holds basket of Healthcare stocks (e.g, Merck, Amgen) is up by 1.88% and is currently underperforming the overall market by -1.5% year-to-date. Below is a quick view of Technical charts and trends: |
|
 XLV Weekly Chart |
|
| Long Term Trend: Not Good | |
| Medium Term Trend: Not Good | |
 XLV Daily Chart |
|
| Short Term Trend: Very Good | |
| Overall Trend Score: 25 | |
| YTD Performance: 1.88% | |
| **Trend Scores & Views Are Only For Educational Purposes And Not For Investing | |
| 12Stocks.com: Top Performing Healthcare Sector Stocks | ||||||||||||||||||||||||||||||||||||||||||||||||
 The top performing Healthcare sector stocks year to date are
Now, more recently, over last week, the top performing Healthcare sector stocks on the move are


|
||||||||||||||||||||||||||||||||||||||||||||||||
| 12Stocks.com: Investing in Healthcare Sector using Exchange Traded Funds | |
|
The following table shows list of key exchange traded funds (ETF) that
help investors track Healthcare Index. For detailed view, check out our ETF Funds section of our website. Quick View: Move mouse or cursor over ETF symbol (ticker) to view short-term Technical chart and over ETF name to view long term chart. Click on ticker or stock name for detailed view. Click on to add stock symbol to your watchlist and to view watchlist. |
12Stocks.com List of ETFs that track Healthcare Index
| Ticker | ETF Name | Watchlist | Recent Price | Smart Investing & Trading Score | Change % | Week % | Year-to-date % |
| XLV | Health Care | | 138.95 | 25 | 0.38 | 0.03 | 1.88% |
| XBI | Biotech | | 82.83 | 10 | -0.78 | -6.04 | -7.23% |
| IBB | Biotechnology | | 124.72 | 10 | 0.06 | -3.75 | -8.19% |
| BBH | Biotech | | 152.18 | 10 | -0.11 | -3.43 | -7.94% |
| VHT | Health Care | | 253.33 | 10 | 0.20 | -0.57 | 1.05% |
| IYH | Healthcare | | 58.16 | 10 | 0.19 | -0.41 | 1.59% |
| IHF | Healthcare Providers | | 52.21 | 62 | 1.29 | 3.3 | -0.57% |
| IHI | Medical Devices | | 54.36 | 15 | -0.31 | -3.1 | 0.72% |
| BIB | Biotechnology | | 48.11 | 10 | 0.35 | -6.38 | -15.67% |
| BIS | Short Biotech | | 20.96 | 95 | 0.45 | 6.94 | 15.99% |
| XHE | Health Care Equipment | | 81.27 | 28 | -0.20 | -3.13 | -3.55% |
| CURE | Healthcare Bull 3X | | 103.33 | 25 | 1.09 | -0.06 | 1.56% |
| LABU | Biotech Bull 3X | | 86.05 | 10 | -2.26 | -17.54 | -29.45% |
| LABD | Biotech Bear 3X | | 10.80 | 80 | 2.66 | 20.27 | 11.46% |
| PSCH | SmallCap Health Care | | 40.18 | 20 | 0.25 | -3.02 | -6.12% |
| XHS | Health Care Services | | 87.08 | 38 | 1.04 | -1.05 | -2.1% |
| PTH | DWA Healthcare Momentum | | 39.53 | 23 | -0.10 | -5.5 | 1% |
| BTEC | Principal Healthcare Innovators | | 33.86 | 0 | -0.67 | -5.92 | -6.8% |
| RXL | Health Care | | 93.07 | 25 | 0.68 | -0.2 | 1.82% |
| RXD | Short Health Care | | 11.64 | 76 | -0.29 | 0.34 | -2.39% |
| 12Stocks.com: Charts, Trends, Fundamental Data and Performances of Healthcare Stocks | |
|
We now take in-depth look at all Healthcare stocks including charts, multi-period performances and overall trends (as measured by Smart Investing & Trading Score). One can sort Healthcare stocks (click link to choose) by Daily, Weekly and by Year-to-Date performances. Also, one can sort by size of the company or by market capitalization. |
| Select Your Default Chart Type: | |||||
| |||||
| Click on stock symbol or name for detailed view. Click on to add stock symbol to your watchlist and to view watchlist. Quick View: Move mouse or cursor over "Daily" to quickly view daily Technical stock chart and over "Weekly" to view weekly Technical stock chart. | |||||

 | SCPH scPharmaceuticals Inc. |
| Sector: Health Care | |
| SubSector: Biotechnology | |
| MarketCap: 136.185 Millions | |
| Recent Price: 4.55 Smart Investing & Trading Score: 17 | |
| Day Percent Change: 0.66% Day Change: 0.03 | |
| Week Change: -7.71% Year-to-date Change: -27.4% | |
| SCPH Links: Profile News Message Board | |
| Charts:- Daily , Weekly | |
| Add SCPH to Watchlist: View: Get Complete SCPH Trend Analysis ➞ | |
 | MGTX MeiraGTx Holdings plc |
| Sector: Health Care | |
| SubSector: Biotechnology | |
| MarketCap: 402.885 Millions | |
| Recent Price: 5.09 Smart Investing & Trading Score: 10 | |
| Day Percent Change: 1.60% Day Change: 0.08 | |
| Week Change: -8.45% Year-to-date Change: -27.5% | |
| MGTX Links: Profile News Message Board | |
| Charts:- Daily , Weekly | |
| Add MGTX to Watchlist: View: Get Complete MGTX Trend Analysis ➞ | |
 | CTSO Cytosorbents Corporation |
| Sector: Health Care | |
| SubSector: Medical Laboratories & Research | |
| MarketCap: 166.2 Millions | |
| Recent Price: 0.80 Smart Investing & Trading Score: 35 | |
| Day Percent Change: 0.12% Day Change: 0.00 | |
| Week Change: -9.89% Year-to-date Change: -27.8% | |
| CTSO Links: Profile News Message Board | |
| Charts:- Daily , Weekly | |
| Add CTSO to Watchlist: View: Get Complete CTSO Trend Analysis ➞ | |
 | LFST LifeStance Health Group, Inc. |
| Sector: Health Care | |
| SubSector: Medical Care Facilities | |
| MarketCap: 3460 Millions | |
| Recent Price: 5.71 Smart Investing & Trading Score: 25 | |
| Day Percent Change: -0.78% Day Change: -0.04 | |
| Week Change: -5.62% Year-to-date Change: -27.9% | |
| LFST Links: Profile News Message Board | |
| Charts:- Daily , Weekly | |
| Add LFST to Watchlist: View: Get Complete LFST Trend Analysis ➞ | |
 | VERO Venus Concept Inc. |
| Sector: Health Care | |
| SubSector: Medical Appliances & Equipment | |
| MarketCap: 101.08 Millions | |
| Recent Price: 0.85 Smart Investing & Trading Score: 57 | |
| Day Percent Change: 8.75% Day Change: 0.07 | |
| Week Change: 25.44% Year-to-date Change: -28.0% | |
| VERO Links: Profile News Message Board | |
| Charts:- Daily , Weekly | |
| Add VERO to Watchlist: View: Get Complete VERO Trend Analysis ➞ | |
 | TELA TELA Bio, Inc. |
| Sector: Health Care | |
| SubSector: Medical Appliances & Equipment | |
| MarketCap: 81.808 Millions | |
| Recent Price: 4.76 Smart Investing & Trading Score: 0 | |
| Day Percent Change: -7.57% Day Change: -0.39 | |
| Week Change: -3.25% Year-to-date Change: -28.1% | |
| TELA Links: Profile News Message Board | |
| Charts:- Daily , Weekly | |
| Add TELA to Watchlist: View: Get Complete TELA Trend Analysis ➞ | |
 | BGNE BeiGene, Ltd. |
| Sector: Health Care | |
| SubSector: Biotechnology | |
| MarketCap: 10838.5 Millions | |
| Recent Price: 129.52 Smart Investing & Trading Score: 10 | |
| Day Percent Change: -1.85% Day Change: -2.44 | |
| Week Change: -8.34% Year-to-date Change: -28.2% | |
| BGNE Links: Profile News Message Board | |
| Charts:- Daily , Weekly | |
| Add BGNE to Watchlist: View: Get Complete BGNE Trend Analysis ➞ | |
 | HUM Humana Inc. |
| Sector: Health Care | |
| SubSector: Health Care Plans | |
| MarketCap: 34125.6 Millions | |
| Recent Price: 328.33 Smart Investing & Trading Score: 49 | |
| Day Percent Change: 1.08% Day Change: 3.50 | |
| Week Change: 5.04% Year-to-date Change: -28.3% | |
| HUM Links: Profile News Message Board | |
| Charts:- Daily , Weekly | |
| Add HUM to Watchlist: View: Get Complete HUM Trend Analysis ➞ | |
 | MDXG MiMedx Group, Inc. |
| Sector: Health Care | |
| SubSector: Medical Appliances & Equipment | |
| MarketCap: 371.08 Millions | |
| Recent Price: 6.29 Smart Investing & Trading Score: 15 | |
| Day Percent Change: 2.11% Day Change: 0.13 | |
| Week Change: -2.33% Year-to-date Change: -28.3% | |
| MDXG Links: Profile News Message Board | |
| Charts:- Daily , Weekly | |
| Add MDXG to Watchlist: View: Get Complete MDXG Trend Analysis ➞ | |
 | DBVT DBV Technologies S.A. |
| Sector: Health Care | |
| SubSector: Biotechnology | |
| MarketCap: 405.885 Millions | |
| Recent Price: 0.68 Smart Investing & Trading Score: 10 | |
| Day Percent Change: 3.13% Day Change: 0.02 | |
| Week Change: -1.83% Year-to-date Change: -28.5% | |
| DBVT Links: Profile News Message Board | |
| Charts:- Daily , Weekly | |
| Add DBVT to Watchlist: View: Get Complete DBVT Trend Analysis ➞ | |
 | GLPG Galapagos NV |
| Sector: Health Care | |
| SubSector: Biotechnology | |
| MarketCap: 9541.55 Millions | |
| Recent Price: 29.08 Smart Investing & Trading Score: 10 | |
| Day Percent Change: 0.59% Day Change: 0.17 | |
| Week Change: -3.87% Year-to-date Change: -28.5% | |
| GLPG Links: Profile News Message Board | |
| Charts:- Daily , Weekly | |
| Add GLPG to Watchlist: View: Get Complete GLPG Trend Analysis ➞ | |
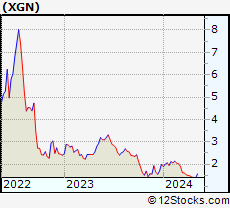 | XGN Exagen Inc. |
| Sector: Health Care | |
| SubSector: Medical Laboratories & Research | |
| MarketCap: 231.7 Millions | |
| Recent Price: 1.42 Smart Investing & Trading Score: 17 | |
| Day Percent Change: 1.43% Day Change: 0.02 | |
| Week Change: -4.05% Year-to-date Change: -28.6% | |
| XGN Links: Profile News Message Board | |
| Charts:- Daily , Weekly | |
| Add XGN to Watchlist: View: Get Complete XGN Trend Analysis ➞ | |
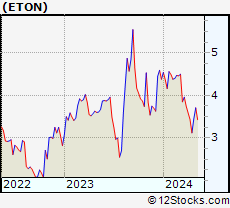 | ETON Eton Pharmaceuticals, Inc. |
| Sector: Health Care | |
| SubSector: Biotechnology | |
| MarketCap: 65.0785 Millions | |
| Recent Price: 3.12 Smart Investing & Trading Score: 10 | |
| Day Percent Change: 0.00% Day Change: 0.00 | |
| Week Change: -9.3% Year-to-date Change: -28.8% | |
| ETON Links: Profile News Message Board | |
| Charts:- Daily , Weekly | |
| Add ETON to Watchlist: View: Get Complete ETON Trend Analysis ➞ | |
 | ORGO Organogenesis Holdings Inc. |
| Sector: Health Care | |
| SubSector: Drugs - Generic | |
| MarketCap: 239.685 Millions | |
| Recent Price: 2.91 Smart Investing & Trading Score: 57 | |
| Day Percent Change: 1.57% Day Change: 0.04 | |
| Week Change: 1.04% Year-to-date Change: -28.9% | |
| ORGO Links: Profile News Message Board | |
| Charts:- Daily , Weekly | |
| Add ORGO to Watchlist: View: Get Complete ORGO Trend Analysis ➞ | |
 | NTLA Intellia Therapeutics, Inc. |
| Sector: Health Care | |
| SubSector: Biotechnology | |
| MarketCap: 707.185 Millions | |
| Recent Price: 21.57 Smart Investing & Trading Score: 20 | |
| Day Percent Change: 1.17% Day Change: 0.25 | |
| Week Change: -11.12% Year-to-date Change: -29.3% | |
| NTLA Links: Profile News Message Board | |
| Charts:- Daily , Weekly | |
| Add NTLA to Watchlist: View: Get Complete NTLA Trend Analysis ➞ | |
 | VCYT Veracyte, Inc. |
| Sector: Health Care | |
| SubSector: Biotechnology | |
| MarketCap: 1089.05 Millions | |
| Recent Price: 19.45 Smart Investing & Trading Score: 42 | |
| Day Percent Change: 1.30% Day Change: 0.25 | |
| Week Change: -3.86% Year-to-date Change: -29.3% | |
| VCYT Links: Profile News Message Board | |
| Charts:- Daily , Weekly | |
| Add VCYT to Watchlist: View: Get Complete VCYT Trend Analysis ➞ | |
 | CORT Corcept Therapeutics Incorporated |
| Sector: Health Care | |
| SubSector: Biotechnology | |
| MarketCap: 1228.45 Millions | |
| Recent Price: 22.95 Smart Investing & Trading Score: 36 | |
| Day Percent Change: 1.28% Day Change: 0.29 | |
| Week Change: -2.38% Year-to-date Change: -29.3% | |
| CORT Links: Profile News Message Board | |
| Charts:- Daily , Weekly | |
| Add CORT to Watchlist: View: Get Complete CORT Trend Analysis ➞ | |
 | ASRT Assertio Therapeutics, Inc. |
| Sector: Health Care | |
| SubSector: Drugs - Generic | |
| MarketCap: 65.8185 Millions | |
| Recent Price: 0.76 Smart Investing & Trading Score: 27 | |
| Day Percent Change: 0.73% Day Change: 0.01 | |
| Week Change: -12.17% Year-to-date Change: -29.4% | |
| ASRT Links: Profile News Message Board | |
| Charts:- Daily , Weekly | |
| Add ASRT to Watchlist: View: Get Complete ASRT Trend Analysis ➞ | |
 | FLGT Fulgent Genetics, Inc. |
| Sector: Health Care | |
| SubSector: Medical Laboratories & Research | |
| MarketCap: 222.2 Millions | |
| Recent Price: 20.34 Smart Investing & Trading Score: 37 | |
| Day Percent Change: 1.09% Day Change: 0.22 | |
| Week Change: -3.46% Year-to-date Change: -29.6% | |
| FLGT Links: Profile News Message Board | |
| Charts:- Daily , Weekly | |
| Add FLGT to Watchlist: View: Get Complete FLGT Trend Analysis ➞ | |
 | OLMA Olema Pharmaceuticals, Inc. |
| Sector: Health Care | |
| SubSector: Biotechnology | |
| MarketCap: 17687 Millions | |
| Recent Price: 9.86 Smart Investing & Trading Score: 7 | |
| Day Percent Change: -0.60% Day Change: -0.06 | |
| Week Change: -9.21% Year-to-date Change: -29.9% | |
| OLMA Links: Profile News Message Board | |
| Charts:- Daily , Weekly | |
| Add OLMA to Watchlist: View: Get Complete OLMA Trend Analysis ➞ | |
 | DH Definitive Healthcare Corp. |
| Sector: Health Care | |
| SubSector: Health Information Services | |
| MarketCap: 1690 Millions | |
| Recent Price: 7.06 Smart Investing & Trading Score: 5 | |
| Day Percent Change: -2.89% Day Change: -0.21 | |
| Week Change: -3.95% Year-to-date Change: -29.9% | |
| DH Links: Profile News Message Board | |
| Charts:- Daily , Weekly | |
| Add DH to Watchlist: View: Get Complete DH Trend Analysis ➞ | |
 | AUTL Autolus Therapeutics plc |
| Sector: Health Care | |
| SubSector: Biotechnology | |
| MarketCap: 296.285 Millions | |
| Recent Price: 4.51 Smart Investing & Trading Score: 0 | |
| Day Percent Change: -6.04% Day Change: -0.29 | |
| Week Change: -10.16% Year-to-date Change: -30.0% | |
| AUTL Links: Profile News Message Board | |
| Charts:- Daily , Weekly | |
| Add AUTL to Watchlist: View: Get Complete AUTL Trend Analysis ➞ | |
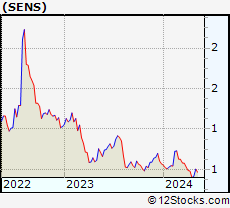 | SENS Senseonics Holdings, Inc. |
| Sector: Health Care | |
| SubSector: Medical Appliances & Equipment | |
| MarketCap: 154.38 Millions | |
| Recent Price: 0.40 Smart Investing & Trading Score: 10 | |
| Day Percent Change: -4.04% Day Change: -0.02 | |
| Week Change: -17.01% Year-to-date Change: -30.0% | |
| SENS Links: Profile News Message Board | |
| Charts:- Daily , Weekly | |
| Add SENS to Watchlist: View: Get Complete SENS Trend Analysis ➞ | |
 | OPTN OptiNose, Inc. |
| Sector: Health Care | |
| SubSector: Drugs - Generic | |
| MarketCap: 183.385 Millions | |
| Recent Price: 0.90 Smart Investing & Trading Score: 0 | |
| Day Percent Change: -3.68% Day Change: -0.03 | |
| Week Change: -26.63% Year-to-date Change: -30.6% | |
| OPTN Links: Profile News Message Board | |
| Charts:- Daily , Weekly | |
| Add OPTN to Watchlist: View: Get Complete OPTN Trend Analysis ➞ | |
 | INNV InnovAge Holding Corp. |
| Sector: Health Care | |
| SubSector: Medical Care Facilities | |
| MarketCap: 1010 Millions | |
| Recent Price: 3.95 Smart Investing & Trading Score: 20 | |
| Day Percent Change: -2.47% Day Change: -0.10 | |
| Week Change: 1.02% Year-to-date Change: -30.7% | |
| INNV Links: Profile News Message Board | |
| Charts:- Daily , Weekly | |
| Add INNV to Watchlist: View: Get Complete INNV Trend Analysis ➞ | |
| For tabular summary view of above stock list: Summary View ➞ 0 - 25 , 25 - 50 , 50 - 75 , 75 - 100 , 100 - 125 , 125 - 150 , 150 - 175 , 175 - 200 , 200 - 225 , 225 - 250 , 250 - 275 , 275 - 300 , 300 - 325 , 325 - 350 , 350 - 375 , 375 - 400 , 400 - 425 , 425 - 450 , 450 - 475 , 475 - 500 , 500 - 525 , 525 - 550 , 550 - 575 , 575 - 600 , 600 - 625 , 625 - 650 , 650 - 675 , 675 - 700 , 700 - 725 | ||
| Click To Change The Sort Order: By Market Cap or Company Size Performance: Year-to-date, Week and Day | |
| Select Chart Type: | ||
|
Best Stocks Today 12Stocks.com |
© 2024 12Stocks.com Terms & Conditions Privacy Contact Us
All Information Provided Only For Education And Not To Be Used For Investing or Trading. See Terms & Conditions


One More Thing ... Get Best Stocks Delivered Daily!
Never Ever Miss A Move With Our Top Ten Stocks Lists
Find Best Stocks In Any Market - Bull or Bear Market
Take A Peek At Our Top Ten Stocks Lists: Daily, Weekly, Year-to-Date & Top Trends
Find Best Stocks In Any Market - Bull or Bear Market
Take A Peek At Our Top Ten Stocks Lists: Daily, Weekly, Year-to-Date & Top Trends
Healthcare Stocks With Best Up Trends [0-bearish to 100-bullish]: Vanda [100], Humacyte [95], Phibro Animal[95], ALX Oncology[95], Fresenius [95], Oscar Health[95], Lantheus [93], United [93], Mesoblast [88], OPKO Health[88], Aurora Cannabis[88]
Best Healthcare Stocks Year-to-Date:
Precision BioSciences[2571.23%], Inovio [1798.04%], Assembly Biosciences[1535.17%], Adverum Biotechnologies[1406.38%], Aurora Cannabis[1256.57%], NuCana [1188.03%], Affimed N.V[724%], Corbus [549.67%], Agenus [541.38%], CareMax [429.9%], Zhongchao [412.19%] Best Healthcare Stocks This Week:
NuCana [1601.65%], Regencell Bioscience[45.67%], Humacyte [28.47%], Venus Concept[25.44%], Vanda [24.03%], ALX Oncology[22.49%], Rani [16.67%], ProKidney [16.57%], Galera [15.36%], UnitedHealth [14.1%], Zhongchao [14.02%] Best Healthcare Stocks Daily:
Genelux [14.25%], Humacyte [14.02%], Accelerate Diagnostics[11.56%], Hyperfine [10.37%], Emergent Bio[9.68%], Venus Concept[8.75%], Adaptimmune [8.72%], BioXcel [8.63%], Corbus [7.42%], RedHill Biopharma[7.41%], DermTech [7.05%]