
 Login Sign Up


| |||||
 |  | ||||

| 12Stocks.com Market Intelligence |
Best Healthcare Stocks
 | "Discover best trending healthcare stocks with 12Stocks.com." |
| - Subu Vdaygiri, Founder, 12Stocks.com |
| In a hurry? Healthcare Stocks Lists: Performance Trends Table, Stock Charts
Sort Healthcare stocks: Daily, Weekly, Year-to-Date, Market Cap & Trends. Filter Healthcare stocks list by size:All Healthcare Large Mid-Range Small |
| 12Stocks.com Healthcare Stocks Performances & Trends Daily | |||||||||
|
|  The overall Smart Investing & Trading Score is 83 (0-bearish to 100-bullish) which puts Healthcare sector in short term bullish trend. The Smart Investing & Trading Score from previous trading session is 88 and a deterioration of trend continues.
| ||||||||
Here are the Smart Investing & Trading Scores of the most requested Healthcare stocks at 12Stocks.com (click stock name for detailed review):
|


| 12Stocks.com: Investing in Healthcare sector with Stocks | |
|
The following table helps investors and traders sort through current performance and trends (as measured by Smart Investing & Trading Score) of various
stocks in the Healthcare sector. Quick View: Move mouse or cursor over stock symbol (ticker) to view short-term Technical chart and over stock name to view long term chart. Click on  to add stock symbol to your watchlist and to add stock symbol to your watchlist and  to view watchlist. Click on any ticker or stock name for detailed market intelligence report for that stock. to view watchlist. Click on any ticker or stock name for detailed market intelligence report for that stock. |
12Stocks.com Performance of Stocks in Healthcare Sector
| Ticker | Stock Name | Watchlist | Category | Recent Price | Smart Investing & Trading Score | Change % | YTD Change% |
| SYRS | Syros |   | Biotechnology | 5.65 | 59 | 0.71% | -27.47% |
| BBIO | BridgeBio Pharma | | Biotechnology | 29.28 | 25 | -0.81% | -27.47% |
| OMGA | Omega | | Biotechnology | 2.18 | 17 | -11.74% | -27.57% |
| EXAS | Exact Sciences | | Laboratories | 53.52 | 32 | 4.94% | -27.66% |
| BLUE | bluebird bio | | Biotechnology | 1.00 | 30 | -3.23% | -27.78% |
| MRKR | Marker | | Biotechnology | 3.97 | 26 | -5.48% | -27.82% |
| CYTK | Cytokinetics | | Biotechnology | 60.14 | 35 | -0.76% | -27.97% |
| IMVT | Immunovant | | Biotechnology | 30.29 | 25 | -1.88% | -28.10% |
| OABI | OmniAb | | Biotechnology | 4.34 | 10 | -1.03% | -28.30% |
| CUE | Cue Biopharma | | Biotechnology | 1.89 | 54 | 1.07% | -28.41% |
| EMBC | Embecta | | Instruments | 13.63 | 35 | -2.01% | -28.66% |
| LEGN | Legend Biotech | | Biotechnology | 42.97 | 10 | -5.43% | -28.77% |
| ADPT | Adaptive Biotechnologies | | Biotechnology | 3.49 | 35 | -2.79% | -28.78% |
| APLS | Apellis | | Biotechnology | 42.56 | 35 | -1.53% | -28.90% |
| QURE | uniQure N.V | | Biotechnology | 4.80 | 30 | -1.03% | -29.10% |
| ATEC | Alphatec | | Instruments | 10.68 | 10 | -3.17% | -29.32% |
| SLGL | Sol-Gel Technologies | | Biotechnology | 0.78 | 59 | 10.62% | -29.42% |
| NARI | Inari | | Medical Devices | 45.74 | 42 | -0.85% | -29.57% |
| FOLD | Amicus | | Biotechnology | 9.91 | 49 | 1.64% | -30.16% |
| GLPG | Galapagos NV | | Biotechnology | 28.38 | 10 | -2.74% | -30.18% |
| STVN | Stevanato | | Instruments | 19.26 | 10 | -9.11% | -30.29% |
| PSNL | Personalis | | Biotechnology | 1.46 | 42 | -0.34% | -30.71% |
| PMVP | PMV | | Biotechnology | 2.13 | 78 | -3.39% | -31.13% |
| LUNG | Pulmonx | | Medical Devices | 8.78 | 15 | -1.57% | -31.14% |
| RLAY | Relay | | Biotechnology | 7.57 | 74 | 11.58% | -31.23% |
| For chart view version of above stock list: Chart View ➞ 0 - 25 , 25 - 50 , 50 - 75 , 75 - 100 , 100 - 125 , 125 - 150 , 150 - 175 , 175 - 200 , 200 - 225 , 225 - 250 , 250 - 275 , 275 - 300 , 300 - 325 , 325 - 350 , 350 - 375 , 375 - 400 , 400 - 425 , 425 - 450 , 450 - 475 , 475 - 500 , 500 - 525 , 525 - 550 , 550 - 575 , 575 - 600 , 600 - 625 , 625 - 650 , 650 - 675 , 675 - 700 , 700 - 725 | ||
 | Click To Change The Sort Order: By Market Cap or Company Size Performance: Year-to-date, Week and Day |  |
|
Get the most comprehensive stock market coverage daily at 12Stocks.com ➞ Best Stocks Today ➞ Best Stocks Weekly ➞ Best Stocks Year-to-Date ➞ Best Stocks Trends ➞  Best Stocks Today 12Stocks.com Best Nasdaq Stocks ➞ Best S&P 500 Stocks ➞ Best Tech Stocks ➞ Best Biotech Stocks ➞ |
| Detailed Overview of Healthcare Stocks |
| Healthcare Technical Overview, Leaders & Laggards, Top Healthcare ETF Funds & Detailed Healthcare Stocks List, Charts, Trends & More |
| Healthcare Sector: Technical Analysis, Trends & YTD Performance | |
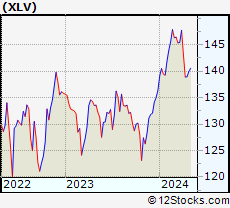
| Healthcare sector is composed of stocks
from pharmaceutical, biotech, diagnostics labs, insurance providers
and healthcare services. Healthcare sector, as represented by XLV, an exchange-traded fund [ETF] that holds basket of Healthcare stocks (e.g, Merck, Amgen) is up by 7.24% and is currently underperforming the overall market by -3.67% year-to-date. Below is a quick view of Technical charts and trends: |
|
 XLV Weekly Chart |
|
| Long Term Trend: Very Good | |
| Medium Term Trend: Very Good | |
 XLV Daily Chart |
|
| Short Term Trend: Good | |
| Overall Trend Score: 83 | |
| YTD Performance: 7.24% | |
| **Trend Scores & Views Are Only For Educational Purposes And Not For Investing | |
| 12Stocks.com: Top Performing Healthcare Sector Stocks | ||||||||||||||||||||||||||||||||||||||||||||||||
 The top performing Healthcare sector stocks year to date are
Now, more recently, over last week, the top performing Healthcare sector stocks on the move are


|
||||||||||||||||||||||||||||||||||||||||||||||||
| 12Stocks.com: Investing in Healthcare Sector using Exchange Traded Funds | |
|
The following table shows list of key exchange traded funds (ETF) that
help investors track Healthcare Index. For detailed view, check out our ETF Funds section of our website. Quick View: Move mouse or cursor over ETF symbol (ticker) to view short-term Technical chart and over ETF name to view long term chart. Click on ticker or stock name for detailed view. Click on to add stock symbol to your watchlist and to view watchlist. |
12Stocks.com List of ETFs that track Healthcare Index
| Ticker | ETF Name | Watchlist | Recent Price | Smart Investing & Trading Score | Change % | Week % | Year-to-date % |
| XLV | Health Care | | 146.25 | 83 | 0.17 | -0.04 | 7.24% |
| XBI | Biotech | | 91.57 | 45 | -0.76 | 0.43 | 2.55% |
| IBB | Biotechnology | | 136.91 | 63 | -0.44 | 0.16 | 0.78% |
| BBH | Biotech | | 168.15 | 83 | -0.26 | 0.1 | 1.72% |
| VHT | Health Care | | 266.91 | 67 | 0.02 | -0.07 | 6.47% |
| IYH | Healthcare | | 61.39 | 62 | 0.24 | 0.08 | 7.24% |
| IHF | Healthcare Providers | | 53.71 | 76 | 0.32 | -0.37 | 2.29% |
| IHI | Medical Devices | | 56.36 | 30 | -0.16 | -0.58 | 4.43% |
| BIB | Biotechnology | | 57.47 | 63 | -0.73 | 0.9 | 0.74% |
| BIS | Short Biotech | | 17.59 | 45 | 1.47 | -0.03 | -2.68% |
| XHE | Health Care Equipment | | 86.97 | 61 | -0.61 | -0.55 | 3.22% |
| CURE | Healthcare Bull 3X | | 118.89 | 70 | 0.55 | -0.18 | 16.86% |
| LABU | Biotech Bull 3X | | 113.12 | 32 | -2.31 | 1.19 | -7.26% |
| LABD | Biotech Bear 3X | | 7.83 | 61 | 2.09 | -1.51 | -19.2% |
| PSCH | SmallCap Health Care | | 43.31 | 64 | -0.31 | -0.19 | 1.2% |
| XHS | Health Care Services | | 91.28 | 76 | -0.65 | -0.29 | 2.62% |
| PTH | DWA Healthcare Momentum | | 42.76 | 43 | -0.81 | 0.3 | 9.25% |
| BTEC | Principal Healthcare Innovators | | 36.49 | 30 | -1.23 | 0.02 | 0.43% |
| RXL | Health Care | | 103.09 | 83 | 0.19 | 0.32 | 12.79% |
| RXD | Short Health Care | | 10.57 | 25 | 0.00 | 0.07 | -11.36% |
| 12Stocks.com: Charts, Trends, Fundamental Data and Performances of Healthcare Stocks | |
|
We now take in-depth look at all Healthcare stocks including charts, multi-period performances and overall trends (as measured by Smart Investing & Trading Score). One can sort Healthcare stocks (click link to choose) by Daily, Weekly and by Year-to-Date performances. Also, one can sort by size of the company or by market capitalization. |
| Select Your Default Chart Type: | |||||
| |||||
| Click on stock symbol or name for detailed view. Click on to add stock symbol to your watchlist and to view watchlist. Quick View: Move mouse or cursor over "Daily" to quickly view daily Technical stock chart and over "Weekly" to view weekly Technical stock chart. | |||||

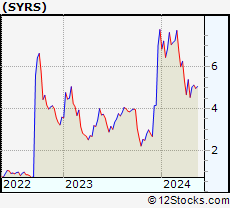 | SYRS Syros Pharmaceuticals, Inc. |
| Sector: Health Care | |
| SubSector: Biotechnology | |
| MarketCap: 275.485 Millions | |
| Recent Price: 5.65 Smart Investing & Trading Score: 59 | |
| Day Percent Change: 0.71% Day Change: 0.04 | |
| Week Change: 3.67% Year-to-date Change: -27.5% | |
| SYRS Links: Profile News Message Board | |
| Charts:- Daily , Weekly | |
| Add SYRS to Watchlist: View: Get Complete SYRS Trend Analysis ➞ | |
 | BBIO BridgeBio Pharma, Inc. |
| Sector: Health Care | |
| SubSector: Biotechnology | |
| MarketCap: 3879.35 Millions | |
| Recent Price: 29.28 Smart Investing & Trading Score: 25 | |
| Day Percent Change: -0.81% Day Change: -0.24 | |
| Week Change: -2.69% Year-to-date Change: -27.5% | |
| BBIO Links: Profile News Message Board | |
| Charts:- Daily , Weekly | |
| Add BBIO to Watchlist: View: Get Complete BBIO Trend Analysis ➞ | |
 | OMGA Omega Therapeutics, Inc. |
| Sector: Health Care | |
| SubSector: Biotechnology | |
| MarketCap: 304 Millions | |
| Recent Price: 2.18 Smart Investing & Trading Score: 17 | |
| Day Percent Change: -11.74% Day Change: -0.29 | |
| Week Change: -9.54% Year-to-date Change: -27.6% | |
| OMGA Links: Profile News Message Board | |
| Charts:- Daily , Weekly | |
| Add OMGA to Watchlist: View: Get Complete OMGA Trend Analysis ➞ | |
 | EXAS Exact Sciences Corporation |
| Sector: Health Care | |
| SubSector: Medical Laboratories & Research | |
| MarketCap: 8572 Millions | |
| Recent Price: 53.52 Smart Investing & Trading Score: 32 | |
| Day Percent Change: 4.94% Day Change: 2.52 | |
| Week Change: 6.23% Year-to-date Change: -27.7% | |
| EXAS Links: Profile News Message Board | |
| Charts:- Daily , Weekly | |
| Add EXAS to Watchlist: View: Get Complete EXAS Trend Analysis ➞ | |
 | BLUE bluebird bio, Inc. |
| Sector: Health Care | |
| SubSector: Biotechnology | |
| MarketCap: 3365.05 Millions | |
| Recent Price: 1.00 Smart Investing & Trading Score: 30 | |
| Day Percent Change: -3.23% Day Change: -0.03 | |
| Week Change: -3.23% Year-to-date Change: -27.8% | |
| BLUE Links: Profile News Message Board | |
| Charts:- Daily , Weekly | |
| Add BLUE to Watchlist: View: Get Complete BLUE Trend Analysis ➞ | |
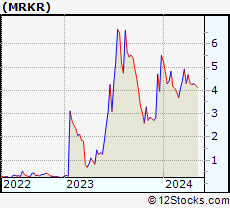 | MRKR Marker Therapeutics, Inc. |
| Sector: Health Care | |
| SubSector: Biotechnology | |
| MarketCap: 93.3785 Millions | |
| Recent Price: 3.97 Smart Investing & Trading Score: 26 | |
| Day Percent Change: -5.48% Day Change: -0.23 | |
| Week Change: -4.34% Year-to-date Change: -27.8% | |
| MRKR Links: Profile News Message Board | |
| Charts:- Daily , Weekly | |
| Add MRKR to Watchlist: View: Get Complete MRKR Trend Analysis ➞ | |
 | CYTK Cytokinetics, Incorporated |
| Sector: Health Care | |
| SubSector: Biotechnology | |
| MarketCap: 654.285 Millions | |
| Recent Price: 60.14 Smart Investing & Trading Score: 35 | |
| Day Percent Change: -0.76% Day Change: -0.46 | |
| Week Change: 1.02% Year-to-date Change: -28.0% | |
| CYTK Links: Profile News Message Board | |
| Charts:- Daily , Weekly | |
| Add CYTK to Watchlist: View: Get Complete CYTK Trend Analysis ➞ | |
 | IMVT Immunovant, Inc. |
| Sector: Health Care | |
| SubSector: Biotechnology | |
| MarketCap: 552.885 Millions | |
| Recent Price: 30.29 Smart Investing & Trading Score: 25 | |
| Day Percent Change: -1.88% Day Change: -0.58 | |
| Week Change: -1.34% Year-to-date Change: -28.1% | |
| IMVT Links: Profile News Message Board | |
| Charts:- Daily , Weekly | |
| Add IMVT to Watchlist: View: Get Complete IMVT Trend Analysis ➞ | |
 | OABI OmniAb, Inc. |
| Sector: Health Care | |
| SubSector: Biotechnology | |
| MarketCap: 570 Millions | |
| Recent Price: 4.34 Smart Investing & Trading Score: 10 | |
| Day Percent Change: -1.03% Day Change: -0.04 | |
| Week Change: -2.36% Year-to-date Change: -28.3% | |
| OABI Links: Profile News Message Board | |
| Charts:- Daily , Weekly | |
| Add OABI to Watchlist: View: Get Complete OABI Trend Analysis ➞ | |
 | CUE Cue Biopharma, Inc. |
| Sector: Health Care | |
| SubSector: Biotechnology | |
| MarketCap: 352.785 Millions | |
| Recent Price: 1.89 Smart Investing & Trading Score: 54 | |
| Day Percent Change: 1.07% Day Change: 0.02 | |
| Week Change: 10.53% Year-to-date Change: -28.4% | |
| CUE Links: Profile News Message Board | |
| Charts:- Daily , Weekly | |
| Add CUE to Watchlist: View: Get Complete CUE Trend Analysis ➞ | |
 | EMBC Embecta Corp. |
| Sector: Health Care | |
| SubSector: Medical Instruments & Supplies | |
| MarketCap: 1260 Millions | |
| Recent Price: 13.63 Smart Investing & Trading Score: 35 | |
| Day Percent Change: -2.01% Day Change: -0.28 | |
| Week Change: -5.67% Year-to-date Change: -28.7% | |
| EMBC Links: Profile News Message Board | |
| Charts:- Daily , Weekly | |
| Add EMBC to Watchlist: View: Get Complete EMBC Trend Analysis ➞ | |
 | LEGN Legend Biotech Corporation |
| Sector: Health Care | |
| SubSector: Biotechnology | |
| MarketCap: 37387 Millions | |
| Recent Price: 42.97 Smart Investing & Trading Score: 10 | |
| Day Percent Change: -5.43% Day Change: -2.46 | |
| Week Change: -4.86% Year-to-date Change: -28.8% | |
| LEGN Links: Profile News Message Board | |
| Charts:- Daily , Weekly | |
| Add LEGN to Watchlist: View: Get Complete LEGN Trend Analysis ➞ | |
 | ADPT Adaptive Biotechnologies Corporation |
| Sector: Health Care | |
| SubSector: Biotechnology | |
| MarketCap: 3525.75 Millions | |
| Recent Price: 3.49 Smart Investing & Trading Score: 35 | |
| Day Percent Change: -2.79% Day Change: -0.10 | |
| Week Change: -4.38% Year-to-date Change: -28.8% | |
| ADPT Links: Profile News Message Board | |
| Charts:- Daily , Weekly | |
| Add ADPT to Watchlist: View: Get Complete ADPT Trend Analysis ➞ | |
 | APLS Apellis Pharmaceuticals, Inc. |
| Sector: Health Care | |
| SubSector: Biotechnology | |
| MarketCap: 2030.95 Millions | |
| Recent Price: 42.56 Smart Investing & Trading Score: 35 | |
| Day Percent Change: -1.53% Day Change: -0.66 | |
| Week Change: 3.03% Year-to-date Change: -28.9% | |
| APLS Links: Profile News Message Board | |
| Charts:- Daily , Weekly | |
| Add APLS to Watchlist: View: Get Complete APLS Trend Analysis ➞ | |
 | QURE uniQure N.V. |
| Sector: Health Care | |
| SubSector: Biotechnology | |
| MarketCap: 2267.25 Millions | |
| Recent Price: 4.80 Smart Investing & Trading Score: 30 | |
| Day Percent Change: -1.03% Day Change: -0.05 | |
| Week Change: -4.19% Year-to-date Change: -29.1% | |
| QURE Links: Profile News Message Board | |
| Charts:- Daily , Weekly | |
| Add QURE to Watchlist: View: Get Complete QURE Trend Analysis ➞ | |
 | ATEC Alphatec Holdings, Inc. |
| Sector: Health Care | |
| SubSector: Medical Instruments & Supplies | |
| MarketCap: 181.16 Millions | |
| Recent Price: 10.68 Smart Investing & Trading Score: 10 | |
| Day Percent Change: -3.17% Day Change: -0.35 | |
| Week Change: -3.78% Year-to-date Change: -29.3% | |
| ATEC Links: Profile News Message Board | |
| Charts:- Daily , Weekly | |
| Add ATEC to Watchlist: View: Get Complete ATEC Trend Analysis ➞ | |
 | SLGL Sol-Gel Technologies Ltd. |
| Sector: Health Care | |
| SubSector: Biotechnology | |
| MarketCap: 183.285 Millions | |
| Recent Price: 0.78 Smart Investing & Trading Score: 59 | |
| Day Percent Change: 10.62% Day Change: 0.07 | |
| Week Change: 3.99% Year-to-date Change: -29.4% | |
| SLGL Links: Profile News Message Board | |
| Charts:- Daily , Weekly | |
| Add SLGL to Watchlist: View: Get Complete SLGL Trend Analysis ➞ | |
 | NARI Inari Medical, Inc. |
| Sector: Health Care | |
| SubSector: Medical Devices | |
| MarketCap: 33287 Millions | |
| Recent Price: 45.74 Smart Investing & Trading Score: 42 | |
| Day Percent Change: -0.85% Day Change: -0.39 | |
| Week Change: -0.02% Year-to-date Change: -29.6% | |
| NARI Links: Profile News Message Board | |
| Charts:- Daily , Weekly | |
| Add NARI to Watchlist: View: Get Complete NARI Trend Analysis ➞ | |
 | FOLD Amicus Therapeutics, Inc. |
| Sector: Health Care | |
| SubSector: Biotechnology | |
| MarketCap: 2676.75 Millions | |
| Recent Price: 9.91 Smart Investing & Trading Score: 49 | |
| Day Percent Change: 1.64% Day Change: 0.16 | |
| Week Change: 3.55% Year-to-date Change: -30.2% | |
| FOLD Links: Profile News Message Board | |
| Charts:- Daily , Weekly | |
| Add FOLD to Watchlist: View: Get Complete FOLD Trend Analysis ➞ | |
 | GLPG Galapagos NV |
| Sector: Health Care | |
| SubSector: Biotechnology | |
| MarketCap: 9541.55 Millions | |
| Recent Price: 28.38 Smart Investing & Trading Score: 10 | |
| Day Percent Change: -2.74% Day Change: -0.80 | |
| Week Change: -4.22% Year-to-date Change: -30.2% | |
| GLPG Links: Profile News Message Board | |
| Charts:- Daily , Weekly | |
| Add GLPG to Watchlist: View: Get Complete GLPG Trend Analysis ➞ | |
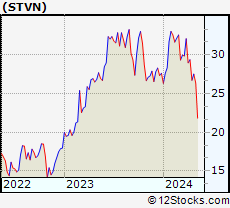 | STVN Stevanato Group S.p.A. |
| Sector: Health Care | |
| SubSector: Medical Instruments & Supplies | |
| MarketCap: 9490 Millions | |
| Recent Price: 19.26 Smart Investing & Trading Score: 10 | |
| Day Percent Change: -9.11% Day Change: -1.93 | |
| Week Change: -7% Year-to-date Change: -30.3% | |
| STVN Links: Profile News Message Board | |
| Charts:- Daily , Weekly | |
| Add STVN to Watchlist: View: Get Complete STVN Trend Analysis ➞ | |
 | PSNL Personalis, Inc. |
| Sector: Health Care | |
| SubSector: Biotechnology | |
| MarketCap: 242.385 Millions | |
| Recent Price: 1.46 Smart Investing & Trading Score: 42 | |
| Day Percent Change: -0.34% Day Change: 0.00 | |
| Week Change: 3.93% Year-to-date Change: -30.7% | |
| PSNL Links: Profile News Message Board | |
| Charts:- Daily , Weekly | |
| Add PSNL to Watchlist: View: Get Complete PSNL Trend Analysis ➞ | |
 | PMVP PMV Pharmaceuticals, Inc. |
| Sector: Health Care | |
| SubSector: Biotechnology | |
| MarketCap: 20187 Millions | |
| Recent Price: 2.13 Smart Investing & Trading Score: 78 | |
| Day Percent Change: -3.39% Day Change: -0.08 | |
| Week Change: 1.67% Year-to-date Change: -31.1% | |
| PMVP Links: Profile News Message Board | |
| Charts:- Daily , Weekly | |
| Add PMVP to Watchlist: View: Get Complete PMVP Trend Analysis ➞ | |
 | LUNG Pulmonx Corporation |
| Sector: Health Care | |
| SubSector: Medical Devices | |
| MarketCap: 18187 Millions | |
| Recent Price: 8.78 Smart Investing & Trading Score: 15 | |
| Day Percent Change: -1.57% Day Change: -0.14 | |
| Week Change: -2.44% Year-to-date Change: -31.1% | |
| LUNG Links: Profile News Message Board | |
| Charts:- Daily , Weekly | |
| Add LUNG to Watchlist: View: Get Complete LUNG Trend Analysis ➞ | |
 | RLAY Relay Therapeutics, Inc. |
| Sector: Health Care | |
| SubSector: Biotechnology | |
| MarketCap: 45887 Millions | |
| Recent Price: 7.57 Smart Investing & Trading Score: 74 | |
| Day Percent Change: 11.58% Day Change: 0.79 | |
| Week Change: 13.93% Year-to-date Change: -31.2% | |
| RLAY Links: Profile News Message Board | |
| Charts:- Daily , Weekly | |
| Add RLAY to Watchlist: View: Get Complete RLAY Trend Analysis ➞ | |
| For tabular summary view of above stock list: Summary View ➞ 0 - 25 , 25 - 50 , 50 - 75 , 75 - 100 , 100 - 125 , 125 - 150 , 150 - 175 , 175 - 200 , 200 - 225 , 225 - 250 , 250 - 275 , 275 - 300 , 300 - 325 , 325 - 350 , 350 - 375 , 375 - 400 , 400 - 425 , 425 - 450 , 450 - 475 , 475 - 500 , 500 - 525 , 525 - 550 , 550 - 575 , 575 - 600 , 600 - 625 , 625 - 650 , 650 - 675 , 675 - 700 , 700 - 725 | ||
| Click To Change The Sort Order: By Market Cap or Company Size Performance: Year-to-date, Week and Day | |
| Select Chart Type: | ||
|
Best Stocks Today 12Stocks.com |
© 2024 12Stocks.com Terms & Conditions Privacy Contact Us
All Information Provided Only For Education And Not To Be Used For Investing or Trading. See Terms & Conditions


One More Thing ... Get Best Stocks Delivered Daily!
Never Ever Miss A Move With Our Top Ten Stocks Lists
Find Best Stocks In Any Market - Bull or Bear Market
Take A Peek At Our Top Ten Stocks Lists: Daily, Weekly, Year-to-Date & Top Trends
Find Best Stocks In Any Market - Bull or Bear Market
Take A Peek At Our Top Ten Stocks Lists: Daily, Weekly, Year-to-Date & Top Trends
Healthcare Stocks With Best Up Trends [0-bearish to 100-bullish]: DURECT [100], Brainstorm Cell[100], Third Harmonic[100], Concord [100], Arbutus Biopharma[100], Madrigal [100], Tandem Diabetes[100], PureTech Health[100], Genfit SA[100], AstraZeneca [100], Moderna [100]
Best Healthcare Stocks Year-to-Date:
Pieris [6042.86%], Precision BioSciences[3472.6%], Avenue [2266.46%], Inovio [2054.9%], Assembly Biosciences[1748.56%], Aurora Cannabis[1398.32%], Agenus [1243.16%], NuCana [1103.52%], Adverum Biotechnologies[944.1%], Affimed N.V[724%], Burning Rock[690.76%] Best Healthcare Stocks This Week:
DURECT [37.07%], Genelux [31.78%], Nobilis Health[29.53%], Concord [29.19%], iBio [26.29%], Pulse Biosciences[24.58%], Accelerate Diagnostics[23.02%], Scilex Holding[22.22%], Dyne [17.88%], PTC [17.39%], CareMax [16.61%] Best Healthcare Stocks Daily:
DURECT [24.04%], Accelerate Diagnostics[23.66%], CareMax [17.83%], RAPT [15.00%], Pulse Biosciences[13.40%], Genelux [11.86%], Relay [11.58%], Sol-Gel Technologies[10.62%], Brainstorm Cell[9.35%], Vaxxinity [9.30%], Third Harmonic[8.54%]