
 Login Sign Up


| |||||
 |  | ||||

| 12Stocks.com Market Intelligence |
Best Healthcare Stocks
 | "Discover best trending healthcare stocks with 12Stocks.com." |
| - Subu Vdaygiri, Founder, 12Stocks.com |
| In a hurry? Healthcare Stocks Lists: Performance Trends Table, Stock Charts
Sort Healthcare stocks: Daily, Weekly, Year-to-Date, Market Cap & Trends. Filter Healthcare stocks list by size:All Healthcare Large Mid-Range Small |
| 12Stocks.com Healthcare Stocks Performances & Trends Daily | |||||||||
|
|  The overall Smart Investing & Trading Score is 83 (0-bearish to 100-bullish) which puts Healthcare sector in short term bullish trend. The Smart Investing & Trading Score from previous trading session is 88 and a deterioration of trend continues.
| ||||||||
Here are the Smart Investing & Trading Scores of the most requested Healthcare stocks at 12Stocks.com (click stock name for detailed review):
|


| 12Stocks.com: Investing in Healthcare sector with Stocks | |
|
The following table helps investors and traders sort through current performance and trends (as measured by Smart Investing & Trading Score) of various
stocks in the Healthcare sector. Quick View: Move mouse or cursor over stock symbol (ticker) to view short-term Technical chart and over stock name to view long term chart. Click on  to add stock symbol to your watchlist and to add stock symbol to your watchlist and  to view watchlist. Click on any ticker or stock name for detailed market intelligence report for that stock. to view watchlist. Click on any ticker or stock name for detailed market intelligence report for that stock. |
12Stocks.com Performance of Stocks in Healthcare Sector
| Ticker | Stock Name | Watchlist | Category | Recent Price | Smart Investing & Trading Score | Change % | YTD Change% |
| PNTG | Pennant |   | Long-Term | 23.68 | 83 | 2.42% | 70.11% |
| SMMT | Summit | | Biotechnology | 4.40 | 30 | -3.08% | 68.58% |
| RDNT | RadNet | | Laboratories | 58.26 | 90 | -0.39% | 67.56% |
| TNDM | Tandem Diabetes | | Instruments | 49.36 | 100 | 4.51% | 66.87% |
| MRVI | Maravai LifeSciences | | Biotechnology | 10.93 | 63 | -3.62% | 66.87% |
| DSGN | Design | | Biotechnology | 4.38 | 51 | -0.34% | 65.16% |
| ACRV | Acrivon | | Biotechnology | 8.21 | 43 | -4.04% | 65.09% |
| ITOS | iTeos | | Biotechnology | 18.02 | 83 | -0.36% | 64.76% |
| TSHA | Taysha Gene | | Biotechnology | 2.92 | 37 | -5.50% | 64.04% |
| EWTX | Edgewise | | Biotechnology | 18.52 | 80 | -1.31% | 63.22% |
| PRCT | PROCEPT BioRobotics | | Medical Devices | 68.48 | 76 | -0.23% | 61.74% |
| SPRY | ARS | | Biotechnology | 9.07 | 51 | -1.31% | 59.54% |
| MRUS | Merus N.V | | Biotechnology | 43.78 | 0 | 0.34% | 59.20% |
| TEVA | Teva | | Pharmaceutical | 16.59 | 90 | -1.31% | 58.91% |
| PAHC | Phibro Animal | | Specialized | 18.38 | 71 | 0.82% | 58.72% |
| DCPH | Deciphera | | Biotechnology | 25.49 | 66 | 0.08% | 58.03% |
| AQST | Aquestive | | Biotechnology | 3.19 | 17 | 0.00% | 57.92% |
| RXST | RxSight | | Medical Devices | 63.02 | 83 | 0.60% | 57.11% |
| TARA | ArTara | | Biotechnology | 2.94 | 25 | -1.67% | 56.79% |
| INGN | Inogen | | Instruments | 8.59 | 68 | -1.94% | 56.47% |
| ELMD | Electromed | | Equipment | 17.04 | 36 | 0.89% | 56.19% |
| APM | Aptorum | | Biotechnology | 3.81 | 26 | -21.12% | 55.60% |
| NRIX | Nurix | | Biotechnology | 15.95 | 71 | -1.48% | 54.40% |
| KURA | Kura Oncology | | Biotechnology | 22.12 | 63 | -0.54% | 53.82% |
| NVCR | NovoCure | | Equipment | 22.75 | 90 | -5.41% | 52.38% |
| For chart view version of above stock list: Chart View ➞ 0 - 25 , 25 - 50 , 50 - 75 , 75 - 100 , 100 - 125 , 125 - 150 , 150 - 175 , 175 - 200 , 200 - 225 , 225 - 250 , 250 - 275 , 275 - 300 , 300 - 325 , 325 - 350 , 350 - 375 , 375 - 400 , 400 - 425 , 425 - 450 , 450 - 475 , 475 - 500 , 500 - 525 , 525 - 550 , 550 - 575 , 575 - 600 , 600 - 625 , 625 - 650 , 650 - 675 , 675 - 700 , 700 - 725 | ||
 | Click To Change The Sort Order: By Market Cap or Company Size Performance: Year-to-date, Week and Day |  |
|
Get the most comprehensive stock market coverage daily at 12Stocks.com ➞ Best Stocks Today ➞ Best Stocks Weekly ➞ Best Stocks Year-to-Date ➞ Best Stocks Trends ➞  Best Stocks Today 12Stocks.com Best Nasdaq Stocks ➞ Best S&P 500 Stocks ➞ Best Tech Stocks ➞ Best Biotech Stocks ➞ |
| Detailed Overview of Healthcare Stocks |
| Healthcare Technical Overview, Leaders & Laggards, Top Healthcare ETF Funds & Detailed Healthcare Stocks List, Charts, Trends & More |
| Healthcare Sector: Technical Analysis, Trends & YTD Performance | |
| Healthcare sector is composed of stocks
from pharmaceutical, biotech, diagnostics labs, insurance providers
and healthcare services. Healthcare sector, as represented by XLV, an exchange-traded fund [ETF] that holds basket of Healthcare stocks (e.g, Merck, Amgen) is up by 7.24% and is currently underperforming the overall market by -3.67% year-to-date. Below is a quick view of Technical charts and trends: |
|
 XLV Weekly Chart |
|
| Long Term Trend: Very Good | |
| Medium Term Trend: Very Good | |
 XLV Daily Chart |
|
| Short Term Trend: Not Good | |
| Overall Trend Score: 83 | |
| YTD Performance: 7.24% | |
| **Trend Scores & Views Are Only For Educational Purposes And Not For Investing | |
| 12Stocks.com: Top Performing Healthcare Sector Stocks | ||||||||||||||||||||||||||||||||||||||||||||||||
 The top performing Healthcare sector stocks year to date are
Now, more recently, over last week, the top performing Healthcare sector stocks on the move are


|
||||||||||||||||||||||||||||||||||||||||||||||||
| 12Stocks.com: Investing in Healthcare Sector using Exchange Traded Funds | |
|
The following table shows list of key exchange traded funds (ETF) that
help investors track Healthcare Index. For detailed view, check out our ETF Funds section of our website. Quick View: Move mouse or cursor over ETF symbol (ticker) to view short-term Technical chart and over ETF name to view long term chart. Click on ticker or stock name for detailed view. Click on to add stock symbol to your watchlist and to view watchlist. |
12Stocks.com List of ETFs that track Healthcare Index
| Ticker | ETF Name | Watchlist | Recent Price | Smart Investing & Trading Score | Change % | Week % | Year-to-date % |
| XLV | Health Care | | 146.25 | 83 | 0.17 | -0.04 | 7.24% |
| XBI | Biotech | | 91.57 | 45 | -0.76 | 0.43 | 2.55% |
| IBB | Biotechnology | | 136.86 | 70 | -0.47 | 0.12 | 0.74% |
| BBH | Biotech | | 168.04 | 83 | -0.33 | 0.03 | 1.65% |
| VHT | Health Care | | 266.91 | 67 | 0.02 | -0.07 | 6.47% |
| IYH | Healthcare | | 61.39 | 62 | 0.24 | 0.08 | 7.24% |
| IHF | Healthcare Providers | | 53.71 | 76 | 0.32 | -0.37 | 2.29% |
| IHI | Medical Devices | | 56.36 | 30 | -0.16 | -0.58 | 4.43% |
| BIB | Biotechnology | | 57.88 | 63 | -0.02 | 1.62 | 1.45% |
| BIS | Short Biotech | | 17.32 | 18 | -0.06 | -1.53 | -4.15% |
| XHE | Health Care Equipment | | 86.97 | 61 | -0.61 | -0.55 | 3.22% |
| CURE | Healthcare Bull 3X | | 118.20 | 70 | -0.04 | -0.76 | 16.18% |
| LABU | Biotech Bull 3X | | 113.12 | 32 | -2.31 | 1.19 | -7.26% |
| LABD | Biotech Bear 3X | | 7.83 | 61 | 2.09 | -1.51 | -19.2% |
| PSCH | SmallCap Health Care | | 43.44 | 56 | -0.02 | 0.1 | 1.5% |
| XHS | Health Care Services | | 91.28 | 73 | -0.65 | -0.29 | 2.62% |
| PTH | DWA Healthcare Momentum | | 43.07 | 35 | -0.09 | 1.03 | 10.04% |
| BTEC | Principal Healthcare Innovators | | 36.83 | 28 | -0.30 | 0.96 | 1.38% |
| RXL | Health Care | | 103.09 | 83 | 0.19 | 0.32 | 12.79% |
| RXD | Short Health Care | | 10.57 | 25 | 0.00 | 0.07 | -11.36% |
| 12Stocks.com: Charts, Trends, Fundamental Data and Performances of Healthcare Stocks | |
|
We now take in-depth look at all Healthcare stocks including charts, multi-period performances and overall trends (as measured by Smart Investing & Trading Score). One can sort Healthcare stocks (click link to choose) by Daily, Weekly and by Year-to-Date performances. Also, one can sort by size of the company or by market capitalization. |
| Select Your Default Chart Type: | |||||
| |||||
| Click on stock symbol or name for detailed view. Click on to add stock symbol to your watchlist and to view watchlist. Quick View: Move mouse or cursor over "Daily" to quickly view daily Technical stock chart and over "Weekly" to view weekly Technical stock chart. | |||||

 | PNTG The Pennant Group, Inc. |
| Sector: Health Care | |
| SubSector: Long-Term Care Facilities | |
| MarketCap: 451.786 Millions | |
| Recent Price: 23.68 Smart Investing & Trading Score: 83 | |
| Day Percent Change: 2.42% Day Change: 0.56 | |
| Week Change: 2.87% Year-to-date Change: 70.1% | |
| PNTG Links: Profile News Message Board | |
| Charts:- Daily , Weekly | |
| Add PNTG to Watchlist: View: Get Complete PNTG Trend Analysis ➞ | |
 | SMMT Summit Therapeutics plc |
| Sector: Health Care | |
| SubSector: Biotechnology | |
| MarketCap: 156.985 Millions | |
| Recent Price: 4.40 Smart Investing & Trading Score: 30 | |
| Day Percent Change: -3.08% Day Change: -0.14 | |
| Week Change: -0.9% Year-to-date Change: 68.6% | |
| SMMT Links: Profile News Message Board | |
| Charts:- Daily , Weekly | |
| Add SMMT to Watchlist: View: Get Complete SMMT Trend Analysis ➞ | |
 | RDNT RadNet, Inc. |
| Sector: Health Care | |
| SubSector: Medical Laboratories & Research | |
| MarketCap: 473.2 Millions | |
| Recent Price: 58.26 Smart Investing & Trading Score: 90 | |
| Day Percent Change: -0.39% Day Change: -0.23 | |
| Week Change: 1.41% Year-to-date Change: 67.6% | |
| RDNT Links: Profile News Message Board | |
| Charts:- Daily , Weekly | |
| Add RDNT to Watchlist: View: Get Complete RDNT Trend Analysis ➞ | |
 | TNDM Tandem Diabetes Care, Inc. |
| Sector: Health Care | |
| SubSector: Medical Instruments & Supplies | |
| MarketCap: 3359.1 Millions | |
| Recent Price: 49.36 Smart Investing & Trading Score: 100 | |
| Day Percent Change: 4.51% Day Change: 2.13 | |
| Week Change: 6.68% Year-to-date Change: 66.9% | |
| TNDM Links: Profile News Message Board | |
| Charts:- Daily , Weekly | |
| Add TNDM to Watchlist: View: Get Complete TNDM Trend Analysis ➞ | |
 | MRVI Maravai LifeSciences Holdings, Inc. |
| Sector: Health Care | |
| SubSector: Biotechnology | |
| MarketCap: 67887 Millions | |
| Recent Price: 10.93 Smart Investing & Trading Score: 63 | |
| Day Percent Change: -3.62% Day Change: -0.41 | |
| Week Change: -3.45% Year-to-date Change: 66.9% | |
| MRVI Links: Profile News Message Board | |
| Charts:- Daily , Weekly | |
| Add MRVI to Watchlist: View: Get Complete MRVI Trend Analysis ➞ | |
 | DSGN Design Therapeutics, Inc. |
| Sector: Health Care | |
| SubSector: Biotechnology | |
| MarketCap: 367 Millions | |
| Recent Price: 4.38 Smart Investing & Trading Score: 51 | |
| Day Percent Change: -0.34% Day Change: -0.02 | |
| Week Change: -0.57% Year-to-date Change: 65.2% | |
| DSGN Links: Profile News Message Board | |
| Charts:- Daily , Weekly | |
| Add DSGN to Watchlist: View: Get Complete DSGN Trend Analysis ➞ | |
 | ACRV Acrivon Therapeutics, Inc. |
| Sector: Health Care | |
| SubSector: Biotechnology | |
| MarketCap: 286 Millions | |
| Recent Price: 8.21 Smart Investing & Trading Score: 43 | |
| Day Percent Change: -4.04% Day Change: -0.35 | |
| Week Change: -7.71% Year-to-date Change: 65.1% | |
| ACRV Links: Profile News Message Board | |
| Charts:- Daily , Weekly | |
| Add ACRV to Watchlist: View: Get Complete ACRV Trend Analysis ➞ | |
 | ITOS iTeos Therapeutics, Inc. |
| Sector: Health Care | |
| SubSector: Biotechnology | |
| MarketCap: 10487 Millions | |
| Recent Price: 18.02 Smart Investing & Trading Score: 83 | |
| Day Percent Change: -0.36% Day Change: -0.07 | |
| Week Change: -0.14% Year-to-date Change: 64.8% | |
| ITOS Links: Profile News Message Board | |
| Charts:- Daily , Weekly | |
| Add ITOS to Watchlist: View: Get Complete ITOS Trend Analysis ➞ | |
 | TSHA Taysha Gene Therapies, Inc. |
| Sector: Health Care | |
| SubSector: Biotechnology | |
| MarketCap: 76487 Millions | |
| Recent Price: 2.92 Smart Investing & Trading Score: 37 | |
| Day Percent Change: -5.50% Day Change: -0.17 | |
| Week Change: -5.5% Year-to-date Change: 64.0% | |
| TSHA Links: Profile News Message Board | |
| Charts:- Daily , Weekly | |
| Add TSHA to Watchlist: View: Get Complete TSHA Trend Analysis ➞ | |
 | EWTX Edgewise Therapeutics, Inc. |
| Sector: Health Care | |
| SubSector: Biotechnology | |
| MarketCap: 492 Millions | |
| Recent Price: 18.52 Smart Investing & Trading Score: 80 | |
| Day Percent Change: -1.31% Day Change: -0.25 | |
| Week Change: 2.29% Year-to-date Change: 63.2% | |
| EWTX Links: Profile News Message Board | |
| Charts:- Daily , Weekly | |
| Add EWTX to Watchlist: View: Get Complete EWTX Trend Analysis ➞ | |
 | PRCT PROCEPT BioRobotics Corporation |
| Sector: Health Care | |
| SubSector: Medical Devices | |
| MarketCap: 1600 Millions | |
| Recent Price: 68.48 Smart Investing & Trading Score: 76 | |
| Day Percent Change: -0.23% Day Change: -0.16 | |
| Week Change: 0.56% Year-to-date Change: 61.7% | |
| PRCT Links: Profile News Message Board | |
| Charts:- Daily , Weekly | |
| Add PRCT to Watchlist: View: Get Complete PRCT Trend Analysis ➞ | |
 | SPRY ARS Pharmaceuticals, Inc. |
| Sector: Health Care | |
| SubSector: Biotechnology | |
| MarketCap: 632 Millions | |
| Recent Price: 9.07 Smart Investing & Trading Score: 51 | |
| Day Percent Change: -1.31% Day Change: -0.12 | |
| Week Change: 0.44% Year-to-date Change: 59.5% | |
| SPRY Links: Profile News Message Board | |
| Charts:- Daily , Weekly | |
| Add SPRY to Watchlist: View: Get Complete SPRY Trend Analysis ➞ | |
 | MRUS Merus N.V. |
| Sector: Health Care | |
| SubSector: Biotechnology | |
| MarketCap: 417.385 Millions | |
| Recent Price: 43.78 Smart Investing & Trading Score: 0 | |
| Day Percent Change: 0.34% Day Change: 0.15 | |
| Week Change: -0.3% Year-to-date Change: 59.2% | |
| MRUS Links: Profile News Message Board | |
| Charts:- Daily , Weekly | |
| Add MRUS to Watchlist: View: Get Complete MRUS Trend Analysis ➞ | |
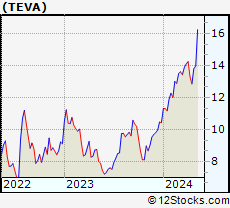 | TEVA Teva Pharmaceutical Industries Limited |
| Sector: Health Care | |
| SubSector: Drug Manufacturers - Other | |
| MarketCap: 9369.93 Millions | |
| Recent Price: 16.59 Smart Investing & Trading Score: 90 | |
| Day Percent Change: -1.31% Day Change: -0.22 | |
| Week Change: 1.84% Year-to-date Change: 58.9% | |
| TEVA Links: Profile News Message Board | |
| Charts:- Daily , Weekly | |
| Add TEVA to Watchlist: View: Get Complete TEVA Trend Analysis ➞ | |
 | PAHC Phibro Animal Health Corporation |
| Sector: Health Care | |
| SubSector: Specialized Health Services | |
| MarketCap: 852.956 Millions | |
| Recent Price: 18.38 Smart Investing & Trading Score: 71 | |
| Day Percent Change: 0.82% Day Change: 0.15 | |
| Week Change: -0.11% Year-to-date Change: 58.7% | |
| PAHC Links: Profile News Message Board | |
| Charts:- Daily , Weekly | |
| Add PAHC to Watchlist: View: Get Complete PAHC Trend Analysis ➞ | |
 | DCPH Deciphera Pharmaceuticals, Inc. |
| Sector: Health Care | |
| SubSector: Biotechnology | |
| MarketCap: 2329.95 Millions | |
| Recent Price: 25.49 Smart Investing & Trading Score: 66 | |
| Day Percent Change: 0.08% Day Change: 0.02 | |
| Week Change: 0.12% Year-to-date Change: 58.0% | |
| DCPH Links: Profile News Message Board | |
| Charts:- Daily , Weekly | |
| Add DCPH to Watchlist: View: Get Complete DCPH Trend Analysis ➞ | |
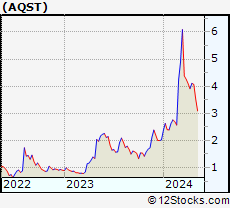 | AQST Aquestive Therapeutics, Inc. |
| Sector: Health Care | |
| SubSector: Biotechnology | |
| MarketCap: 94.2785 Millions | |
| Recent Price: 3.19 Smart Investing & Trading Score: 17 | |
| Day Percent Change: 0.00% Day Change: 0.00 | |
| Week Change: 2.57% Year-to-date Change: 57.9% | |
| AQST Links: Profile News Message Board | |
| Charts:- Daily , Weekly | |
| Add AQST to Watchlist: View: Get Complete AQST Trend Analysis ➞ | |
 | RXST RxSight, Inc. |
| Sector: Health Care | |
| SubSector: Medical Devices | |
| MarketCap: 893 Millions | |
| Recent Price: 63.02 Smart Investing & Trading Score: 83 | |
| Day Percent Change: 0.60% Day Change: 0.38 | |
| Week Change: 3.9% Year-to-date Change: 57.1% | |
| RXST Links: Profile News Message Board | |
| Charts:- Daily , Weekly | |
| Add RXST to Watchlist: View: Get Complete RXST Trend Analysis ➞ | |
 | TARA ArTara Therapeutics, Inc. |
| Sector: Health Care | |
| SubSector: Biotechnology | |
| MarketCap: 140.685 Millions | |
| Recent Price: 2.94 Smart Investing & Trading Score: 25 | |
| Day Percent Change: -1.67% Day Change: -0.05 | |
| Week Change: -4.85% Year-to-date Change: 56.8% | |
| TARA Links: Profile News Message Board | |
| Charts:- Daily , Weekly | |
| Add TARA to Watchlist: View: Get Complete TARA Trend Analysis ➞ | |
 | INGN Inogen, Inc. |
| Sector: Health Care | |
| SubSector: Medical Instruments & Supplies | |
| MarketCap: 8803.6 Millions | |
| Recent Price: 8.59 Smart Investing & Trading Score: 68 | |
| Day Percent Change: -1.94% Day Change: -0.17 | |
| Week Change: -2.72% Year-to-date Change: 56.5% | |
| INGN Links: Profile News Message Board | |
| Charts:- Daily , Weekly | |
| Add INGN to Watchlist: View: Get Complete INGN Trend Analysis ➞ | |
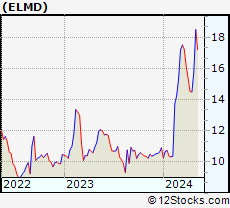 | ELMD Electromed, Inc. |
| Sector: Health Care | |
| SubSector: Medical Appliances & Equipment | |
| MarketCap: 75.708 Millions | |
| Recent Price: 17.04 Smart Investing & Trading Score: 36 | |
| Day Percent Change: 0.89% Day Change: 0.15 | |
| Week Change: -0.58% Year-to-date Change: 56.2% | |
| ELMD Links: Profile News Message Board | |
| Charts:- Daily , Weekly | |
| Add ELMD to Watchlist: View: Get Complete ELMD Trend Analysis ➞ | |
 | APM Aptorum Group Limited |
| Sector: Health Care | |
| SubSector: Biotechnology | |
| MarketCap: 88.7785 Millions | |
| Recent Price: 3.81 Smart Investing & Trading Score: 26 | |
| Day Percent Change: -21.12% Day Change: -1.02 | |
| Week Change: -19.79% Year-to-date Change: 55.6% | |
| APM Links: Profile News Message Board | |
| Charts:- Daily , Weekly | |
| Add APM to Watchlist: View: Get Complete APM Trend Analysis ➞ | |
 | NRIX Nurix Therapeutics, Inc. |
| Sector: Health Care | |
| SubSector: Biotechnology | |
| MarketCap: 16787 Millions | |
| Recent Price: 15.95 Smart Investing & Trading Score: 71 | |
| Day Percent Change: -1.48% Day Change: -0.24 | |
| Week Change: -3.86% Year-to-date Change: 54.4% | |
| NRIX Links: Profile News Message Board | |
| Charts:- Daily , Weekly | |
| Add NRIX to Watchlist: View: Get Complete NRIX Trend Analysis ➞ | |
 | KURA Kura Oncology, Inc. |
| Sector: Health Care | |
| SubSector: Biotechnology | |
| MarketCap: 401.885 Millions | |
| Recent Price: 22.12 Smart Investing & Trading Score: 63 | |
| Day Percent Change: -0.54% Day Change: -0.12 | |
| Week Change: -0.23% Year-to-date Change: 53.8% | |
| KURA Links: Profile News Message Board | |
| Charts:- Daily , Weekly | |
| Add KURA to Watchlist: View: Get Complete KURA Trend Analysis ➞ | |
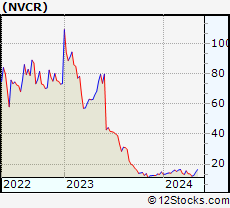 | NVCR NovoCure Limited |
| Sector: Health Care | |
| SubSector: Medical Appliances & Equipment | |
| MarketCap: 5939.5 Millions | |
| Recent Price: 22.75 Smart Investing & Trading Score: 90 | |
| Day Percent Change: -5.41% Day Change: -1.30 | |
| Week Change: 3.46% Year-to-date Change: 52.4% | |
| NVCR Links: Profile News Message Board | |
| Charts:- Daily , Weekly | |
| Add NVCR to Watchlist: View: Get Complete NVCR Trend Analysis ➞ | |
| For tabular summary view of above stock list: Summary View ➞ 0 - 25 , 25 - 50 , 50 - 75 , 75 - 100 , 100 - 125 , 125 - 150 , 150 - 175 , 175 - 200 , 200 - 225 , 225 - 250 , 250 - 275 , 275 - 300 , 300 - 325 , 325 - 350 , 350 - 375 , 375 - 400 , 400 - 425 , 425 - 450 , 450 - 475 , 475 - 500 , 500 - 525 , 525 - 550 , 550 - 575 , 575 - 600 , 600 - 625 , 625 - 650 , 650 - 675 , 675 - 700 , 700 - 725 | ||
| Click To Change The Sort Order: By Market Cap or Company Size Performance: Year-to-date, Week and Day | |
| Select Chart Type: | ||
|
Best Stocks Today 12Stocks.com |
© 2024 12Stocks.com Terms & Conditions Privacy Contact Us
All Information Provided Only For Education And Not To Be Used For Investing or Trading. See Terms & Conditions


One More Thing ... Get Best Stocks Delivered Daily!
Never Ever Miss A Move With Our Top Ten Stocks Lists
Find Best Stocks In Any Market - Bull or Bear Market
Take A Peek At Our Top Ten Stocks Lists: Daily, Weekly, Year-to-Date & Top Trends
Find Best Stocks In Any Market - Bull or Bear Market
Take A Peek At Our Top Ten Stocks Lists: Daily, Weekly, Year-to-Date & Top Trends
Healthcare Stocks With Best Up Trends [0-bearish to 100-bullish]: Third Harmonic[100], Concord [100], Brainstorm Cell[100], Arbutus Biopharma[100], Tandem Diabetes[100], PureTech Health[100], Genfit SA[100], Heron [100], Integer [100], Vericel [100], Boston Scientific[100]
Best Healthcare Stocks Year-to-Date:
Pieris [6042.86%], Precision BioSciences[3472.6%], Avenue [2266.46%], Inovio [2052.94%], Assembly Biosciences[1717.46%], Aurora Cannabis[1398.32%], Agenus [1240.74%], NuCana [1103.52%], Adverum Biotechnologies[949.42%], Affimed N.V[716%], Burning Rock[690.76%] Best Healthcare Stocks This Week:
DURECT [38.14%], Genelux [31.78%], Concord [29.19%], iBio [27.37%], Nobilis Health[26.23%], Pulse Biosciences[24.58%], Scilex Holding[22.22%], Dyne [17.81%], PTC [17.45%], Accelerate Diagnostics[17.35%], CareMax [16.61%] Best Healthcare Stocks Daily:
DURECT [25.00%], Accelerate Diagnostics[17.96%], CareMax [17.83%], RAPT [15.00%], Pulse Biosciences[13.40%], Genelux [11.86%], Relay [11.58%], Sol-Gel Technologies[10.62%], iBio [9.30%], Vaxxinity [9.30%], Third Harmonic[8.54%]