
 Login Sign Up


| |||||
 |  | ||||

| 12Stocks.com Market Intelligence |
Best Healthcare Stocks
 | "Discover best trending healthcare stocks with 12Stocks.com." |
| - Subu Vdaygiri, Founder, 12Stocks.com |
| In a hurry? Healthcare Stocks Lists: Performance Trends Table, Stock Charts
Sort Healthcare stocks: Daily, Weekly, Year-to-Date, Market Cap & Trends. Filter Healthcare stocks list by size:All Healthcare Large Mid-Range Small |
| 12Stocks.com Healthcare Stocks Performances & Trends Daily | |||||||||
|
|  The overall Smart Investing & Trading Score is 83 (0-bearish to 100-bullish) which puts Healthcare sector in short term bullish trend. The Smart Investing & Trading Score from previous trading session is 88 and a deterioration of trend continues.
| ||||||||
Here are the Smart Investing & Trading Scores of the most requested Healthcare stocks at 12Stocks.com (click stock name for detailed review):
|


| 12Stocks.com: Investing in Healthcare sector with Stocks | |
|
The following table helps investors and traders sort through current performance and trends (as measured by Smart Investing & Trading Score) of various
stocks in the Healthcare sector. Quick View: Move mouse or cursor over stock symbol (ticker) to view short-term Technical chart and over stock name to view long term chart. Click on  to add stock symbol to your watchlist and to add stock symbol to your watchlist and  to view watchlist. Click on any ticker or stock name for detailed market intelligence report for that stock. to view watchlist. Click on any ticker or stock name for detailed market intelligence report for that stock. |
12Stocks.com Performance of Stocks in Healthcare Sector
| Ticker | Stock Name | Watchlist | Category | Recent Price | Smart Investing & Trading Score | Change % | YTD Change% |
| ALVR | AlloVir |   | Biotechnology | 0.78 | 73 | 1.05% | 14.32% |
| CELC | Celcuity | | Laboratories | 16.75 | 26 | -0.30% | 14.26% |
| ALDX | Aldeyra | | Biotechnology | 4.01 | 36 | -0.50% | 14.25% |
| CDXS | Codexis | | Biotechnology | 3.47 | 10 | 2.06% | 13.77% |
| CLSD | Clearside Bio | | Biotechnology | 1.33 | 64 | 0.00% | 13.68% |
| ANIK | Anika | | Biotechnology | 25.68 | 53 | 0.16% | 13.33% |
| CSTL | Castle Biosciences | | Laboratories | 24.43 | 95 | -2.02% | 13.23% |
| USPH | U.S. Physical | | Specialized | 105.28 | 25 | -0.11% | 13.03% |
| BTMD | biote | | Medical Care Facilities | 5.60 | 10 | -0.71% | 12.90% |
| FULC | Fulcrum | | Biotechnology | 7.62 | 10 | -1.04% | 12.89% |
| REGN | Regeneron | | Biotechnology | 991.02 | 90 | 0.38% | 12.84% |
| CI | Cigna | | Insurance | 337.50 | 38 | 1.24% | 12.71% |
| IDYA | IDEAYA Biosciences | | Biotechnology | 40.06 | 17 | -0.64% | 12.59% |
| BPMC | Blueprint Medicines | | Biotechnology | 103.72 | 43 | -0.52% | 12.45% |
| APRE | Aprea | | Biotechnology | 5.28 | 25 | -2.02% | 12.36% |
| ANIP | ANI | | Biotechnology | 61.83 | 0 | 0.15% | 12.12% |
| COLL | Collegium | | Pharmaceutical | 34.49 | 35 | 1.01% | 12.07% |
| ICLR | ICON Public | | Laboratories | 316.98 | 52 | -0.55% | 11.98% |
| AXON | Axovant Sciences | | Biotechnology | 288.98 | 18 | -1.04% | 11.86% |
| OFIX | Orthofix | | Equipment | 15.05 | 83 | -0.33% | 11.65% |
| AVDL | Avadel | | Biotechnology | 15.75 | 36 | 0.32% | 11.54% |
| KNSA | Kiniksa | | Biotechnology | 19.56 | 10 | -0.56% | 11.52% |
| XNCR | Xencor | | Biotechnology | 23.61 | 85 | -0.57% | 11.23% |
| LQDA | Liquidia Technologies | | Biotechnology | 13.37 | 64 | 0.15% | 11.14% |
| TMO | Thermo Fisher | | Laboratories | 588.71 | 51 | -0.89% | 10.91% |
| For chart view version of above stock list: Chart View ➞ 0 - 25 , 25 - 50 , 50 - 75 , 75 - 100 , 100 - 125 , 125 - 150 , 150 - 175 , 175 - 200 , 200 - 225 , 225 - 250 , 250 - 275 , 275 - 300 , 300 - 325 , 325 - 350 , 350 - 375 , 375 - 400 , 400 - 425 , 425 - 450 , 450 - 475 , 475 - 500 , 500 - 525 , 525 - 550 , 550 - 575 , 575 - 600 , 600 - 625 , 625 - 650 , 650 - 675 | ||
 | Click To Change The Sort Order: By Market Cap or Company Size Performance: Year-to-date, Week and Day |  |
|
Get the most comprehensive stock market coverage daily at 12Stocks.com ➞ Best Stocks Today ➞ Best Stocks Weekly ➞ Best Stocks Year-to-Date ➞ Best Stocks Trends ➞  Best Stocks Today 12Stocks.com Best Nasdaq Stocks ➞ Best S&P 500 Stocks ➞ Best Tech Stocks ➞ Best Biotech Stocks ➞ |
| Detailed Overview of Healthcare Stocks |
| Healthcare Technical Overview, Leaders & Laggards, Top Healthcare ETF Funds & Detailed Healthcare Stocks List, Charts, Trends & More |
| Healthcare Sector: Technical Analysis, Trends & YTD Performance | |
| Healthcare sector is composed of stocks
from pharmaceutical, biotech, diagnostics labs, insurance providers
and healthcare services. Healthcare sector, as represented by XLV, an exchange-traded fund [ETF] that holds basket of Healthcare stocks (e.g, Merck, Amgen) is up by 7.35% and is currently underperforming the overall market by -3.24% year-to-date. Below is a quick view of Technical charts and trends: |
|
 XLV Weekly Chart |
|
| Long Term Trend: Very Good | |
| Medium Term Trend: Very Good | |
 XLV Daily Chart |
|
| Short Term Trend: Good | |
| Overall Trend Score: 83 | |
| YTD Performance: 7.35% | |
| **Trend Scores & Views Are Only For Educational Purposes And Not For Investing | |
| 12Stocks.com: Top Performing Healthcare Sector Stocks | ||||||||||||||||||||||||||||||||||||||||||||||||
 The top performing Healthcare sector stocks year to date are
Now, more recently, over last week, the top performing Healthcare sector stocks on the move are


|
||||||||||||||||||||||||||||||||||||||||||||||||
| 12Stocks.com: Investing in Healthcare Sector using Exchange Traded Funds | |
|
The following table shows list of key exchange traded funds (ETF) that
help investors track Healthcare Index. For detailed view, check out our ETF Funds section of our website. Quick View: Move mouse or cursor over ETF symbol (ticker) to view short-term Technical chart and over ETF name to view long term chart. Click on ticker or stock name for detailed view. Click on to add stock symbol to your watchlist and to view watchlist. |
12Stocks.com List of ETFs that track Healthcare Index
| Ticker | ETF Name | Watchlist | Recent Price | Smart Investing & Trading Score | Change % | Week % | Year-to-date % |
| XLV | Health Care | | 146.40 | 83 | 0.27 | 0.06 | 7.35% |
| IBB | Biotechnology | | 136.96 | 70 | -0.40 | 0.2 | 0.82% |
| BBH | Biotech | | 168.05 | 83 | -0.32 | 0.04 | 1.66% |
| IHF | Healthcare Providers | | 53.70 | 76 | 0.30 | -0.39 | 2.27% |
| RXL | Health Care | | 103.56 | 90 | 0.65 | 0.78 | 13.3% |
| 12Stocks.com: Charts, Trends, Fundamental Data and Performances of Healthcare Stocks | |
|
We now take in-depth look at all Healthcare stocks including charts, multi-period performances and overall trends (as measured by Smart Investing & Trading Score). One can sort Healthcare stocks (click link to choose) by Daily, Weekly and by Year-to-Date performances. Also, one can sort by size of the company or by market capitalization. |
| Select Your Default Chart Type: | |||||
| |||||
| Click on stock symbol or name for detailed view. Click on to add stock symbol to your watchlist and to view watchlist. Quick View: Move mouse or cursor over "Daily" to quickly view daily Technical stock chart and over "Weekly" to view weekly Technical stock chart. | |||||

 | ALVR AlloVir, Inc. |
| Sector: Health Care | |
| SubSector: Biotechnology | |
| MarketCap: 25787 Millions | |
| Recent Price: 0.78 Smart Investing & Trading Score: 73 | |
| Day Percent Change: 1.05% Day Change: 0.01 | |
| Week Change: 0.21% Year-to-date Change: 14.3% | |
| ALVR Links: Profile News Message Board | |
| Charts:- Daily , Weekly | |
| Add ALVR to Watchlist: View: Get Complete ALVR Trend Analysis ➞ | |
 | CELC Celcuity Inc. |
| Sector: Health Care | |
| SubSector: Medical Laboratories & Research | |
| MarketCap: 70.53 Millions | |
| Recent Price: 16.75 Smart Investing & Trading Score: 26 | |
| Day Percent Change: -0.30% Day Change: -0.05 | |
| Week Change: -0.06% Year-to-date Change: 14.3% | |
| CELC Links: Profile News Message Board | |
| Charts:- Daily , Weekly | |
| Add CELC to Watchlist: View: Get Complete CELC Trend Analysis ➞ | |
 | ALDX Aldeyra Therapeutics, Inc. |
| Sector: Health Care | |
| SubSector: Biotechnology | |
| MarketCap: 61.2785 Millions | |
| Recent Price: 4.01 Smart Investing & Trading Score: 36 | |
| Day Percent Change: -0.50% Day Change: -0.02 | |
| Week Change: 0% Year-to-date Change: 14.3% | |
| ALDX Links: Profile News Message Board | |
| Charts:- Daily , Weekly | |
| Add ALDX to Watchlist: View: Get Complete ALDX Trend Analysis ➞ | |
 | CDXS Codexis, Inc. |
| Sector: Health Care | |
| SubSector: Biotechnology | |
| MarketCap: 592.185 Millions | |
| Recent Price: 3.47 Smart Investing & Trading Score: 10 | |
| Day Percent Change: 2.06% Day Change: 0.07 | |
| Week Change: -3.88% Year-to-date Change: 13.8% | |
| CDXS Links: Profile News Message Board | |
| Charts:- Daily , Weekly | |
| Add CDXS to Watchlist: View: Get Complete CDXS Trend Analysis ➞ | |
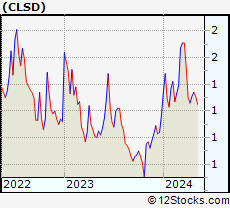 | CLSD Clearside Biomedical, Inc. |
| Sector: Health Care | |
| SubSector: Biotechnology | |
| MarketCap: 73.2785 Millions | |
| Recent Price: 1.33 Smart Investing & Trading Score: 64 | |
| Day Percent Change: 0.00% Day Change: 0.00 | |
| Week Change: 0.76% Year-to-date Change: 13.7% | |
| CLSD Links: Profile News Message Board | |
| Charts:- Daily , Weekly | |
| Add CLSD to Watchlist: View: Get Complete CLSD Trend Analysis ➞ | |
 | ANIK Anika Therapeutics, Inc. |
| Sector: Health Care | |
| SubSector: Biotechnology | |
| MarketCap: 438.385 Millions | |
| Recent Price: 25.68 Smart Investing & Trading Score: 53 | |
| Day Percent Change: 0.16% Day Change: 0.04 | |
| Week Change: 1.1% Year-to-date Change: 13.3% | |
| ANIK Links: Profile News Message Board | |
| Charts:- Daily , Weekly | |
| Add ANIK to Watchlist: View: Get Complete ANIK Trend Analysis ➞ | |
 | CSTL Castle Biosciences, Inc. |
| Sector: Health Care | |
| SubSector: Medical Laboratories & Research | |
| MarketCap: 545 Millions | |
| Recent Price: 24.43 Smart Investing & Trading Score: 95 | |
| Day Percent Change: -2.02% Day Change: -0.51 | |
| Week Change: 0.8% Year-to-date Change: 13.2% | |
| CSTL Links: Profile News Message Board | |
| Charts:- Daily , Weekly | |
| Add CSTL to Watchlist: View: Get Complete CSTL Trend Analysis ➞ | |
 | USPH U.S. Physical Therapy, Inc. |
| Sector: Health Care | |
| SubSector: Specialized Health Services | |
| MarketCap: 793.556 Millions | |
| Recent Price: 105.28 Smart Investing & Trading Score: 25 | |
| Day Percent Change: -0.11% Day Change: -0.12 | |
| Week Change: -1.35% Year-to-date Change: 13.0% | |
| USPH Links: Profile News Message Board | |
| Charts:- Daily , Weekly | |
| Add USPH to Watchlist: View: Get Complete USPH Trend Analysis ➞ | |
 | BTMD biote Corp. |
| Sector: Health Care | |
| SubSector: Medical Care Facilities | |
| MarketCap: 468 Millions | |
| Recent Price: 5.60 Smart Investing & Trading Score: 10 | |
| Day Percent Change: -0.71% Day Change: -0.04 | |
| Week Change: -2.61% Year-to-date Change: 12.9% | |
| BTMD Links: Profile News Message Board | |
| Charts:- Daily , Weekly | |
| Add BTMD to Watchlist: View: Get Complete BTMD Trend Analysis ➞ | |
 | FULC Fulcrum Therapeutics, Inc. |
| Sector: Health Care | |
| SubSector: Biotechnology | |
| MarketCap: 274.785 Millions | |
| Recent Price: 7.62 Smart Investing & Trading Score: 10 | |
| Day Percent Change: -1.04% Day Change: -0.08 | |
| Week Change: 0.93% Year-to-date Change: 12.9% | |
| FULC Links: Profile News Message Board | |
| Charts:- Daily , Weekly | |
| Add FULC to Watchlist: View: Get Complete FULC Trend Analysis ➞ | |
 | REGN Regeneron Pharmaceuticals, Inc. |
| Sector: Health Care | |
| SubSector: Biotechnology | |
| MarketCap: 51903.7 Millions | |
| Recent Price: 991.02 Smart Investing & Trading Score: 90 | |
| Day Percent Change: 0.38% Day Change: 3.75 | |
| Week Change: 0.89% Year-to-date Change: 12.8% | |
| REGN Links: Profile News Message Board | |
| Charts:- Daily , Weekly | |
| Add REGN to Watchlist: View: Get Complete REGN Trend Analysis ➞ | |
 | CI Cigna Corporation |
| Sector: Health Care | |
| SubSector: Health Care Plans | |
| MarketCap: 60251.8 Millions | |
| Recent Price: 337.50 Smart Investing & Trading Score: 38 | |
| Day Percent Change: 1.24% Day Change: 4.13 | |
| Week Change: -0.36% Year-to-date Change: 12.7% | |
| CI Links: Profile News Message Board | |
| Charts:- Daily , Weekly | |
| Add CI to Watchlist: View: Get Complete CI Trend Analysis ➞ | |
 | IDYA IDEAYA Biosciences, Inc. |
| Sector: Health Care | |
| SubSector: Biotechnology | |
| MarketCap: 89.1785 Millions | |
| Recent Price: 40.06 Smart Investing & Trading Score: 17 | |
| Day Percent Change: -0.64% Day Change: -0.26 | |
| Week Change: -1.09% Year-to-date Change: 12.6% | |
| IDYA Links: Profile News Message Board | |
| Charts:- Daily , Weekly | |
| Add IDYA to Watchlist: View: Get Complete IDYA Trend Analysis ➞ | |
 | BPMC Blueprint Medicines Corporation |
| Sector: Health Care | |
| SubSector: Biotechnology | |
| MarketCap: 3113.55 Millions | |
| Recent Price: 103.72 Smart Investing & Trading Score: 43 | |
| Day Percent Change: -0.52% Day Change: -0.54 | |
| Week Change: -1.18% Year-to-date Change: 12.5% | |
| BPMC Links: Profile News Message Board | |
| Charts:- Daily , Weekly | |
| Add BPMC to Watchlist: View: Get Complete BPMC Trend Analysis ➞ | |
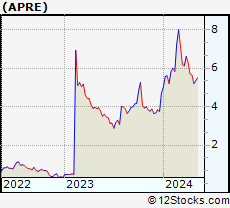 | APRE Aprea Therapeutics, Inc. |
| Sector: Health Care | |
| SubSector: Biotechnology | |
| MarketCap: 699.285 Millions | |
| Recent Price: 5.28 Smart Investing & Trading Score: 25 | |
| Day Percent Change: -2.02% Day Change: -0.11 | |
| Week Change: 0.21% Year-to-date Change: 12.4% | |
| APRE Links: Profile News Message Board | |
| Charts:- Daily , Weekly | |
| Add APRE to Watchlist: View: Get Complete APRE Trend Analysis ➞ | |
 | ANIP ANI Pharmaceuticals, Inc. |
| Sector: Health Care | |
| SubSector: Biotechnology | |
| MarketCap: 489.285 Millions | |
| Recent Price: 61.83 Smart Investing & Trading Score: 0 | |
| Day Percent Change: 0.15% Day Change: 0.10 | |
| Week Change: 0.64% Year-to-date Change: 12.1% | |
| ANIP Links: Profile News Message Board | |
| Charts:- Daily , Weekly | |
| Add ANIP to Watchlist: View: Get Complete ANIP Trend Analysis ➞ | |
 | COLL Collegium Pharmaceutical, Inc. |
| Sector: Health Care | |
| SubSector: Drugs - Generic | |
| MarketCap: 569.185 Millions | |
| Recent Price: 34.49 Smart Investing & Trading Score: 35 | |
| Day Percent Change: 1.01% Day Change: 0.34 | |
| Week Change: 6.24% Year-to-date Change: 12.1% | |
| COLL Links: Profile News Message Board | |
| Charts:- Daily , Weekly | |
| Add COLL to Watchlist: View: Get Complete COLL Trend Analysis ➞ | |
 | ICLR ICON Public Limited Company |
| Sector: Health Care | |
| SubSector: Medical Laboratories & Research | |
| MarketCap: 7011 Millions | |
| Recent Price: 316.98 Smart Investing & Trading Score: 52 | |
| Day Percent Change: -0.55% Day Change: -1.74 | |
| Week Change: 0.72% Year-to-date Change: 12.0% | |
| ICLR Links: Profile News Message Board | |
| Charts:- Daily , Weekly | |
| Add ICLR to Watchlist: View: Get Complete ICLR Trend Analysis ➞ | |
 | AXON Axovant Sciences Ltd. |
| Sector: Health Care | |
| SubSector: Biotechnology | |
| MarketCap: 1492.04 Millions | |
| Recent Price: 288.98 Smart Investing & Trading Score: 18 | |
| Day Percent Change: -1.04% Day Change: -3.05 | |
| Week Change: 0.07% Year-to-date Change: 11.9% | |
| AXON Links: Profile News Message Board | |
| Charts:- Daily , Weekly | |
| Add AXON to Watchlist: View: Get Complete AXON Trend Analysis ➞ | |
 | OFIX Orthofix Medical Inc. |
| Sector: Health Care | |
| SubSector: Medical Appliances & Equipment | |
| MarketCap: 508.18 Millions | |
| Recent Price: 15.05 Smart Investing & Trading Score: 83 | |
| Day Percent Change: -0.33% Day Change: -0.05 | |
| Week Change: 0.33% Year-to-date Change: 11.7% | |
| OFIX Links: Profile News Message Board | |
| Charts:- Daily , Weekly | |
| Add OFIX to Watchlist: View: Get Complete OFIX Trend Analysis ➞ | |
 | AVDL Avadel Pharmaceuticals plc |
| Sector: Health Care | |
| SubSector: Biotechnology | |
| MarketCap: 354.485 Millions | |
| Recent Price: 15.75 Smart Investing & Trading Score: 36 | |
| Day Percent Change: 0.32% Day Change: 0.05 | |
| Week Change: 1.68% Year-to-date Change: 11.5% | |
| AVDL Links: Profile News Message Board | |
| Charts:- Daily , Weekly | |
| Add AVDL to Watchlist: View: Get Complete AVDL Trend Analysis ➞ | |
 | KNSA Kiniksa Pharmaceuticals, Ltd. |
| Sector: Health Care | |
| SubSector: Biotechnology | |
| MarketCap: 780.285 Millions | |
| Recent Price: 19.56 Smart Investing & Trading Score: 10 | |
| Day Percent Change: -0.56% Day Change: -0.11 | |
| Week Change: -1.06% Year-to-date Change: 11.5% | |
| KNSA Links: Profile News Message Board | |
| Charts:- Daily , Weekly | |
| Add KNSA to Watchlist: View: Get Complete KNSA Trend Analysis ➞ | |
 | XNCR Xencor, Inc. |
| Sector: Health Care | |
| SubSector: Biotechnology | |
| MarketCap: 1744.35 Millions | |
| Recent Price: 23.61 Smart Investing & Trading Score: 85 | |
| Day Percent Change: -0.57% Day Change: -0.14 | |
| Week Change: 2.54% Year-to-date Change: 11.2% | |
| XNCR Links: Profile News Message Board | |
| Charts:- Daily , Weekly | |
| Add XNCR to Watchlist: View: Get Complete XNCR Trend Analysis ➞ | |
 | LQDA Liquidia Technologies, Inc. |
| Sector: Health Care | |
| SubSector: Biotechnology | |
| MarketCap: 80.4785 Millions | |
| Recent Price: 13.37 Smart Investing & Trading Score: 64 | |
| Day Percent Change: 0.15% Day Change: 0.02 | |
| Week Change: 5.19% Year-to-date Change: 11.1% | |
| LQDA Links: Profile News Message Board | |
| Charts:- Daily , Weekly | |
| Add LQDA to Watchlist: View: Get Complete LQDA Trend Analysis ➞ | |
 | TMO Thermo Fisher Scientific Inc. |
| Sector: Health Care | |
| SubSector: Medical Laboratories & Research | |
| MarketCap: 112999 Millions | |
| Recent Price: 588.71 Smart Investing & Trading Score: 51 | |
| Day Percent Change: -0.89% Day Change: -5.30 | |
| Week Change: -1.11% Year-to-date Change: 10.9% | |
| TMO Links: Profile News Message Board | |
| Charts:- Daily , Weekly | |
| Add TMO to Watchlist: View: Get Complete TMO Trend Analysis ➞ | |
| For tabular summary view of above stock list: Summary View ➞ 0 - 25 , 25 - 50 , 50 - 75 , 75 - 100 , 100 - 125 , 125 - 150 , 150 - 175 , 175 - 200 , 200 - 225 , 225 - 250 , 250 - 275 , 275 - 300 , 300 - 325 , 325 - 350 , 350 - 375 , 375 - 400 , 400 - 425 , 425 - 450 , 450 - 475 , 475 - 500 , 500 - 525 , 525 - 550 , 550 - 575 , 575 - 600 , 600 - 625 , 625 - 650 , 650 - 675 | ||
| Click To Change The Sort Order: By Market Cap or Company Size Performance: Year-to-date, Week and Day | |
| Select Chart Type: | ||
|
Best Stocks Today 12Stocks.com |
© 2024 12Stocks.com Terms & Conditions Privacy Contact Us
All Information Provided Only For Education And Not To Be Used For Investing or Trading. See Terms & Conditions


One More Thing ... Get Best Stocks Delivered Daily!
Never Ever Miss A Move With Our Top Ten Stocks Lists
Find Best Stocks In Any Market - Bull or Bear Market
Take A Peek At Our Top Ten Stocks Lists: Daily, Weekly, Year-to-Date & Top Trends
Find Best Stocks In Any Market - Bull or Bear Market
Take A Peek At Our Top Ten Stocks Lists: Daily, Weekly, Year-to-Date & Top Trends
Healthcare Stocks With Best Up Trends [0-bearish to 100-bullish]: Concord [100], Corbus [100], Arbutus Biopharma[100], Wave Life[100], Boston Scientific[100], Stoke [100], Integer [100], Heron [100], Cytosorbents [100], Genfit SA[100], Third Harmonic[100]
Best Healthcare Stocks Year-to-Date:
Pieris [6042.86%], Precision BioSciences[3397.26%], Avenue [2266.46%], Inovio [2139.22%], Assembly Biosciences[1724.17%], Aurora Cannabis[1479.17%], Agenus [1223.83%], NuCana [1117.04%], Adverum Biotechnologies[1014.51%], Affimed N.V[725.6%], Corbus [724.83%] Best Healthcare Stocks This Week:
Concord [39.09%], Genelux [27.4%], Dyne [27.35%], Scilex Holding[22.22%], PTC [20.74%], Novavax [19.91%], BioTelemetry [19.32%], Sutro Biopharma[17.08%], InnovAge Holding[16.49%], Stoke [16.08%], Vaxxinity [16.05%] Best Healthcare Stocks Daily:
Concord [16.65%], Vaxxinity [9.30%], Tandem Diabetes[9.21%], Genelux [8.14%], Mesoblast [6.29%], Brainstorm Cell[6.00%], Relay [5.75%], Exact Sciences[5.71%], Novavax [5.48%], Compugen [5.46%], Pulse Biosciences[5.13%]